
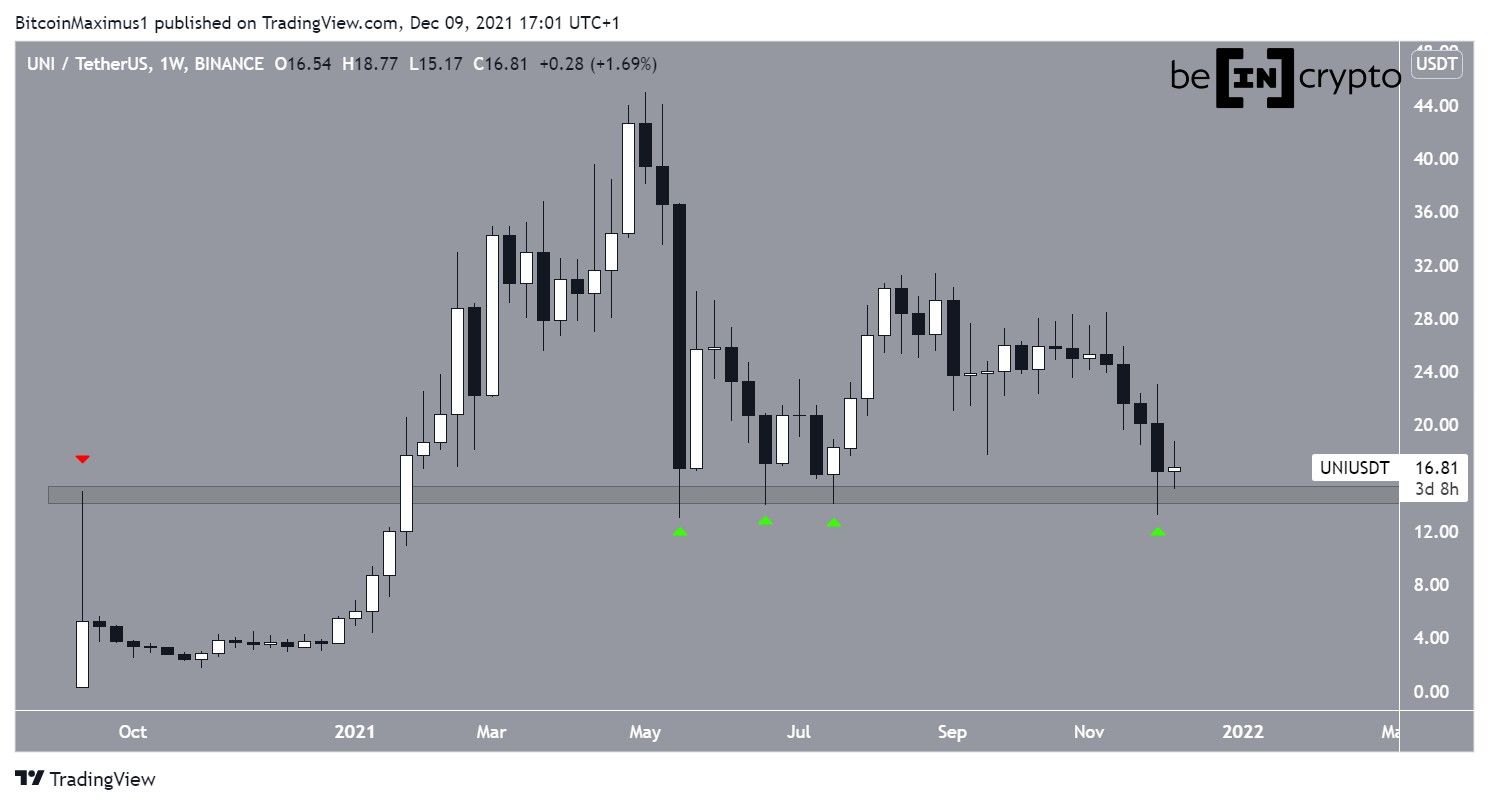
Despite breaking down from a short-term pattern, the longer-term bullish structure for Uniswap (UNI) still remains intact.
On Dec 4, UNI fell to a low of $13.18 and bounced, creating a long lower wick in the process. The lower wick is considered a sign of buying pressure. It was the fourth time (green icons) that it bounced above the $15 hoirzontal support area.
This is a crucial horizontal level, since it previously acted as resistance in Sept (red icon) before eventually turning to support.
Therefore, whether UNI is trading above or below it can be a determinant of the direction of the trend.
Current UNI pattern
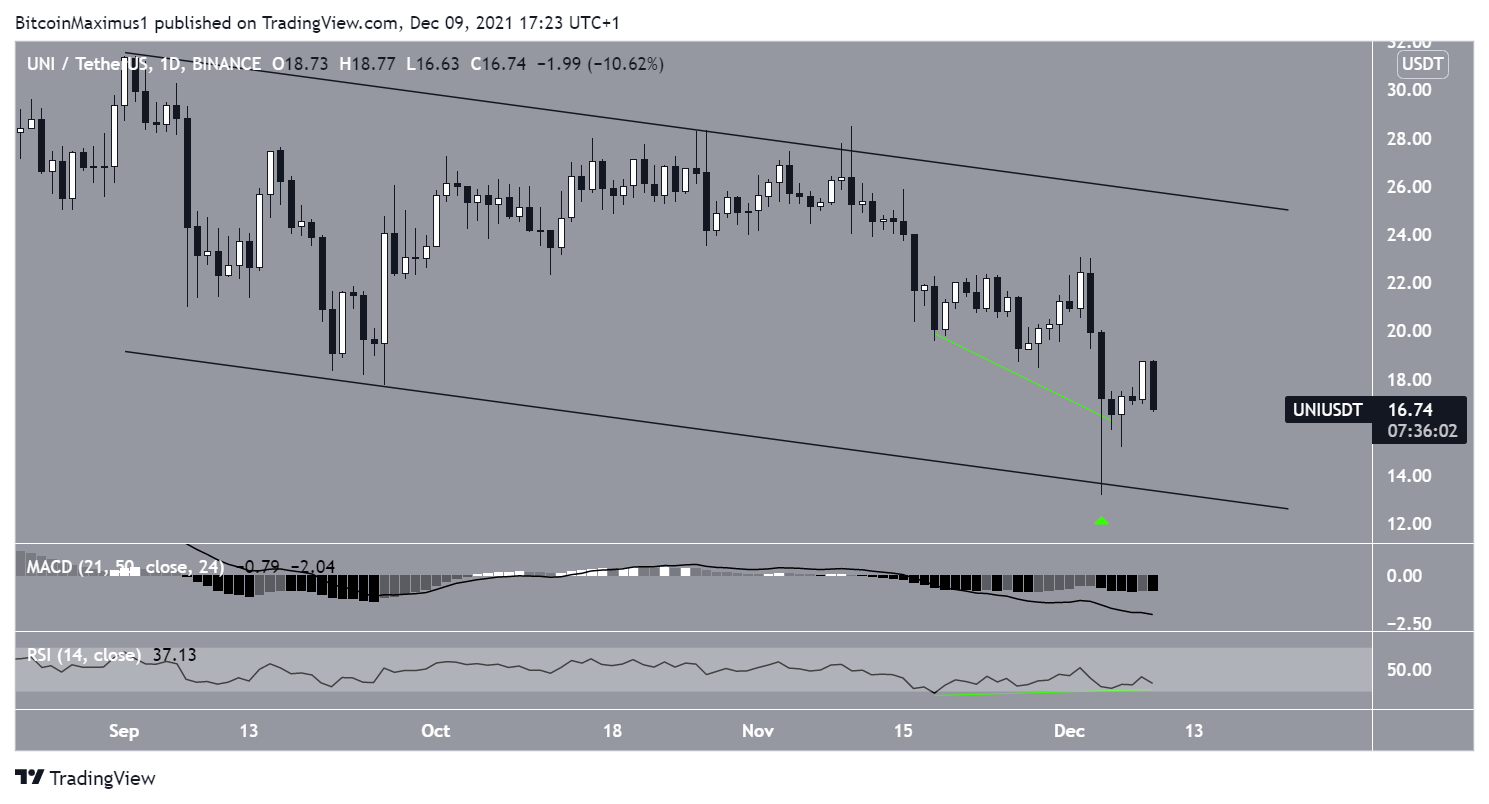
The daily chart shows that UNI is trading inside a descending parallel channel, and has been doing so since Sept 1.
The Dec 4 bounce (green icon) served to validate the support line of the channel.
Despite the bounce, technical indicators are bearish. The MACD, which is created by a short- and a long-term moving average (MA), is negative and decreasing. This means that the short-term MA is moving slower than the long-term one.
Similarly, the RSI is falling. However, it has also generated bullish divergence (green line). This is an occurrence which often preceded bullish trend reversals.
Therefore, if UNI were to reclaim the middle of the channel, it would greatly increase the chances of an eventual breakout.
As long as it is trading above the $15 area and the support of this channel, the potential for an upward movement still remains.
Short-term breakdown
Cryptocurrency trader @ByzGeneral outlined a UNI chart, stating that the token is likely to break down from its ascending wedge.
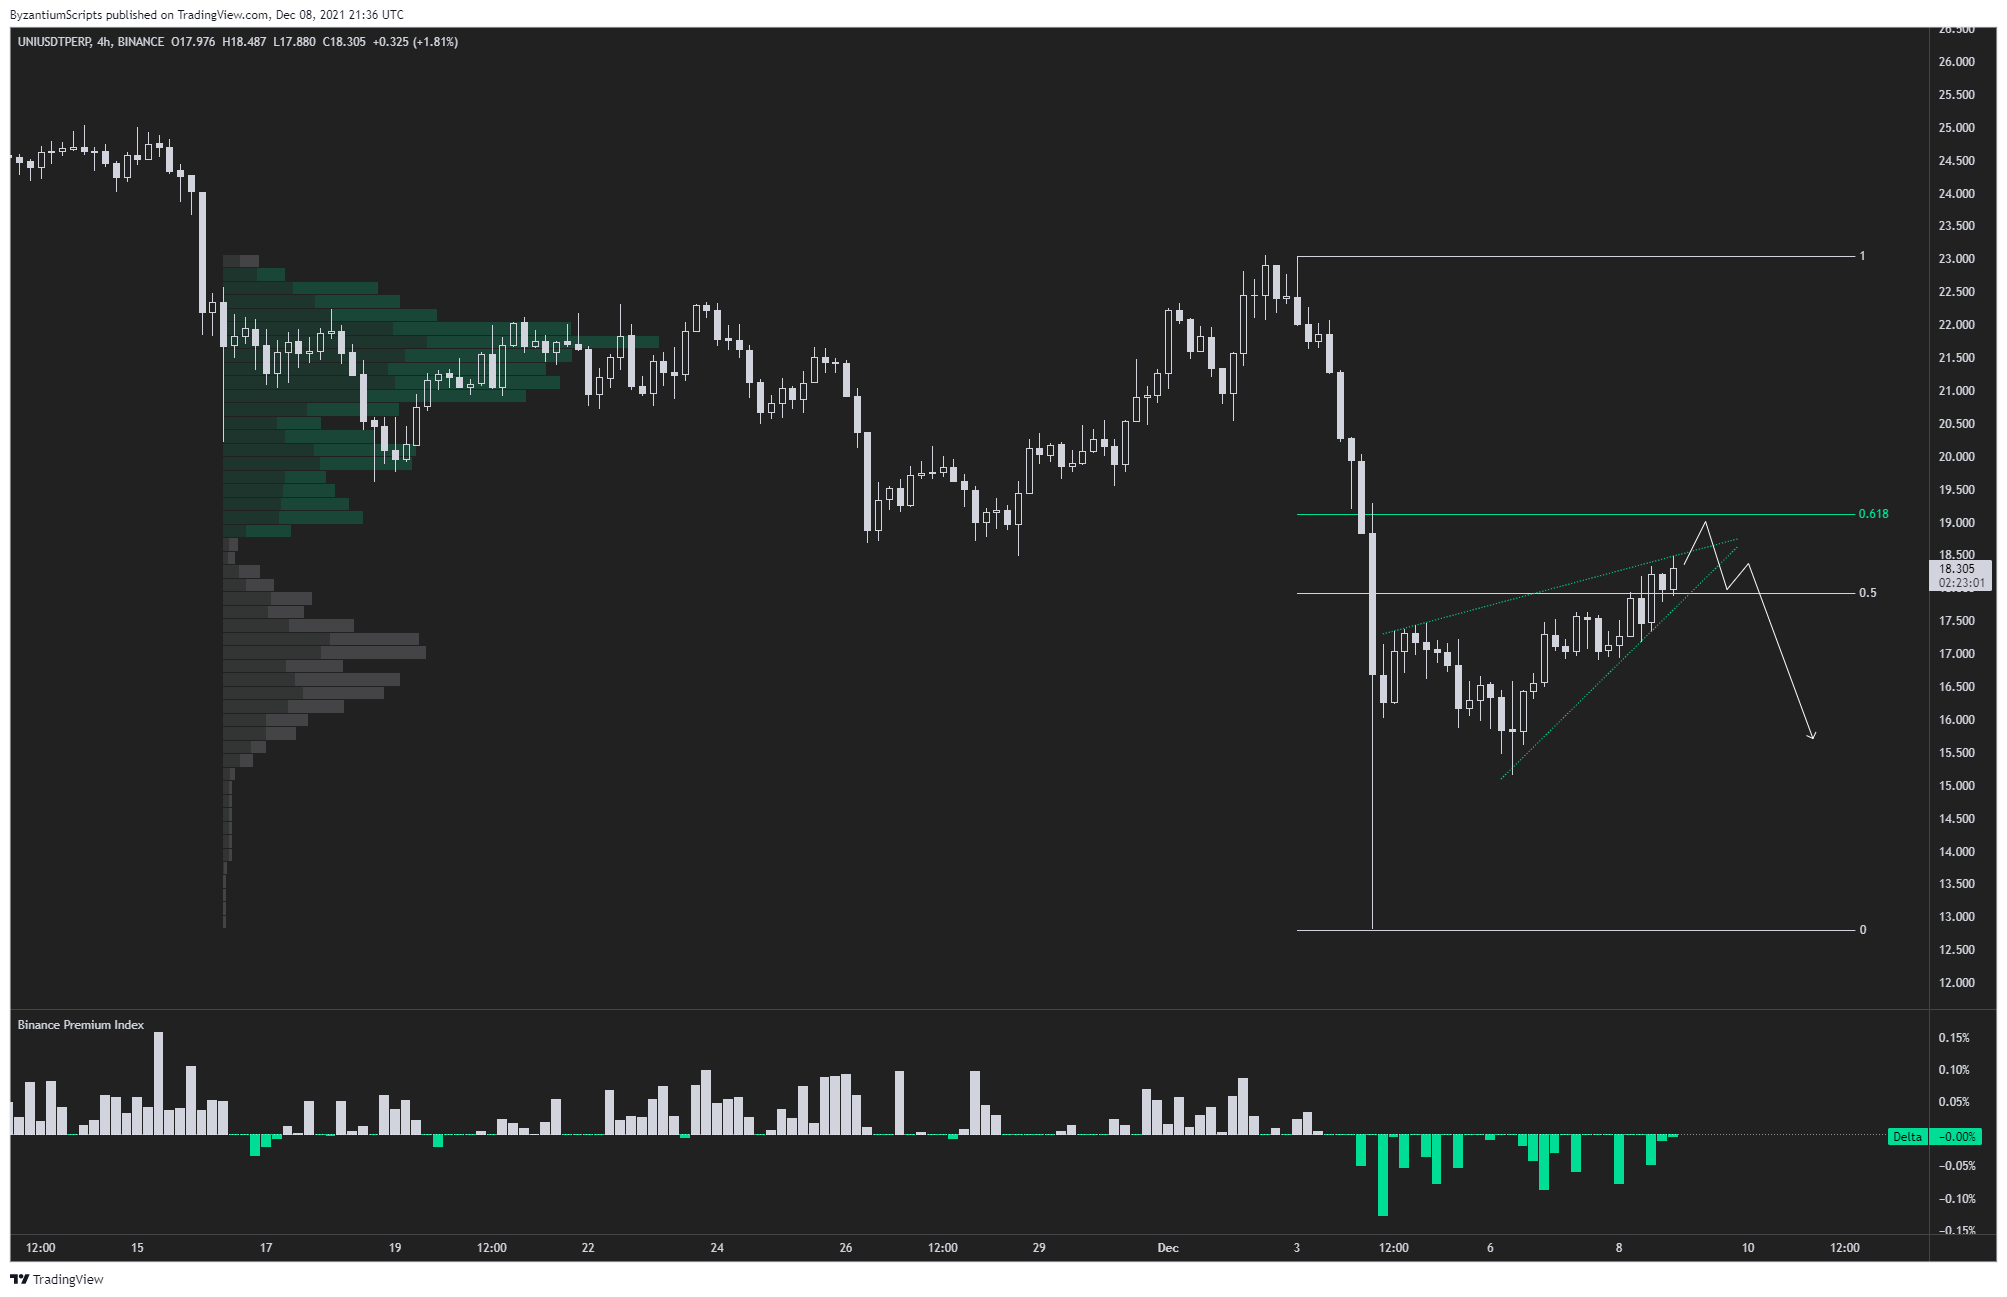
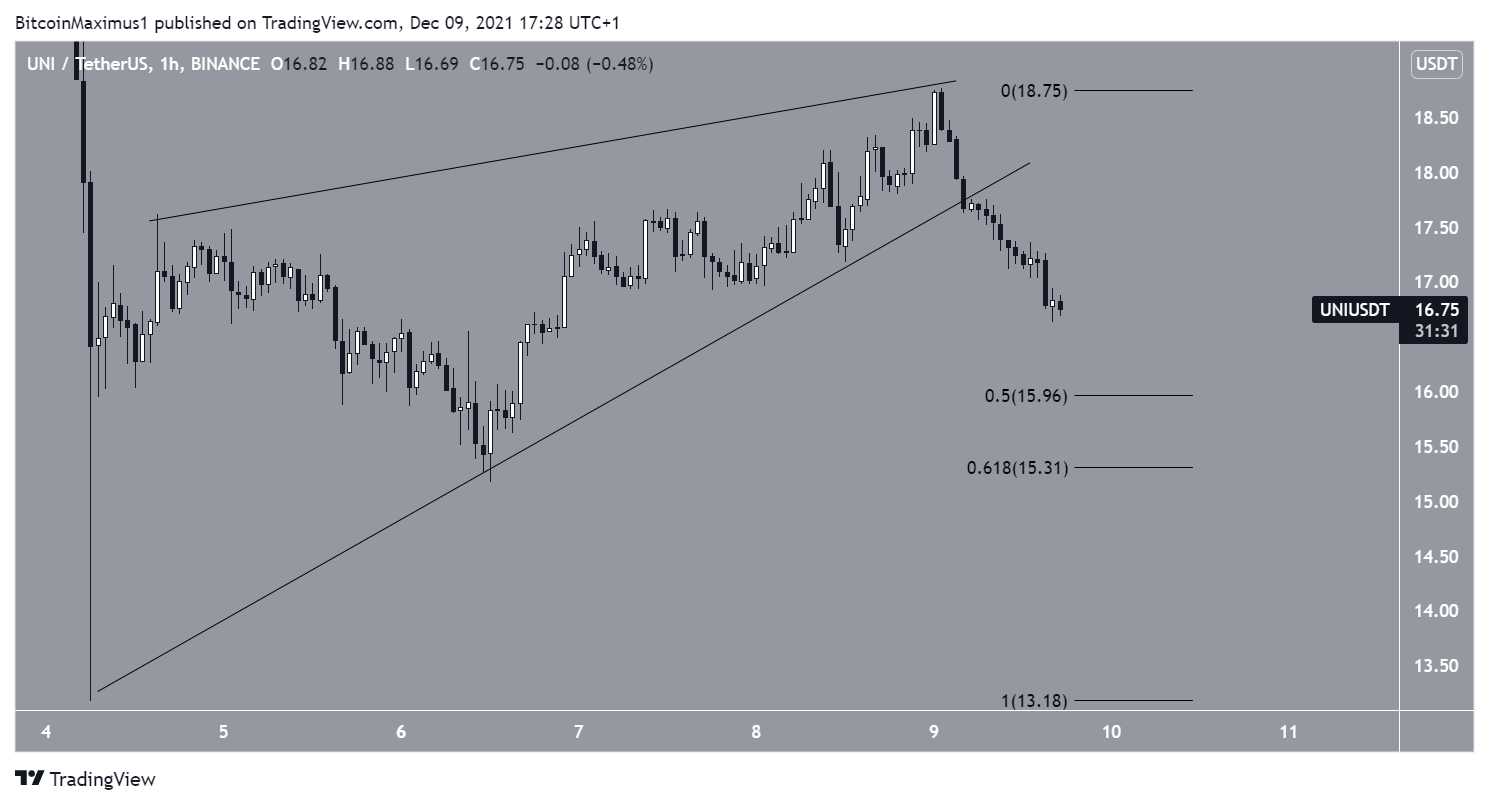
Since the tweet, UNI has broken down from the pattern.
It is currently approaching the first support area between $15.3 and $16. This support area is created by the 0.5 – 0.618 Fib retracement support levels.
If UNI is to eventually break out from the longer-term channel, it is crucial that it creates a higher low inside this area.
For BeInCrypto’s latest Bitcoin (BTC) analysis, click here.
