


The Uniswap Token (UNI) price has been increasing since breaking out from the $4.20 resistance area on Dec. 31.
While a short-term decline could occur, UNI is likely to resume its upward movement afterward.
Breakout Leads to Rally
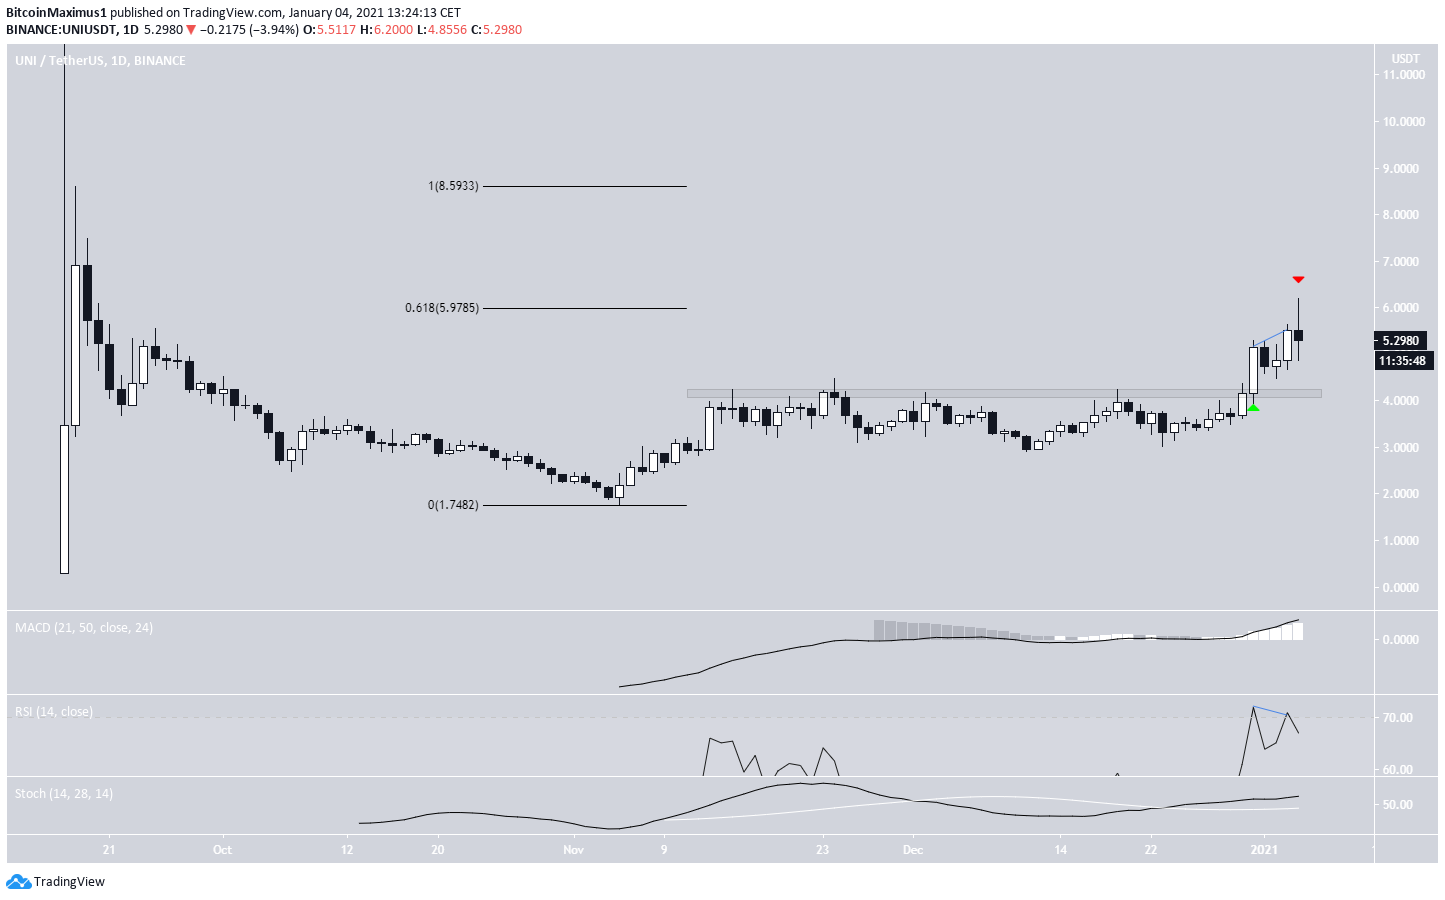
The UNI price had been struggling to move above the $4.20 resistance area since Nov. 13, making several unsuccessful breakout attempts. On Dec. 31, it finally succeeded in doing so and has been increasing since.
On Jan. 4, it reached a high of $6.20, just above the 0.618 Fib retracement level of the previous decline. However, the higher prices were not sustainable, and UNI is in the process of creating a bearish candlestick. So far, it has yet to retest the $4.20 support area.
Technical indicators are mixed. While the RSI has formed bearish divergence, the MACD and the Stochastic Oscillator are increasing.
Future Movement
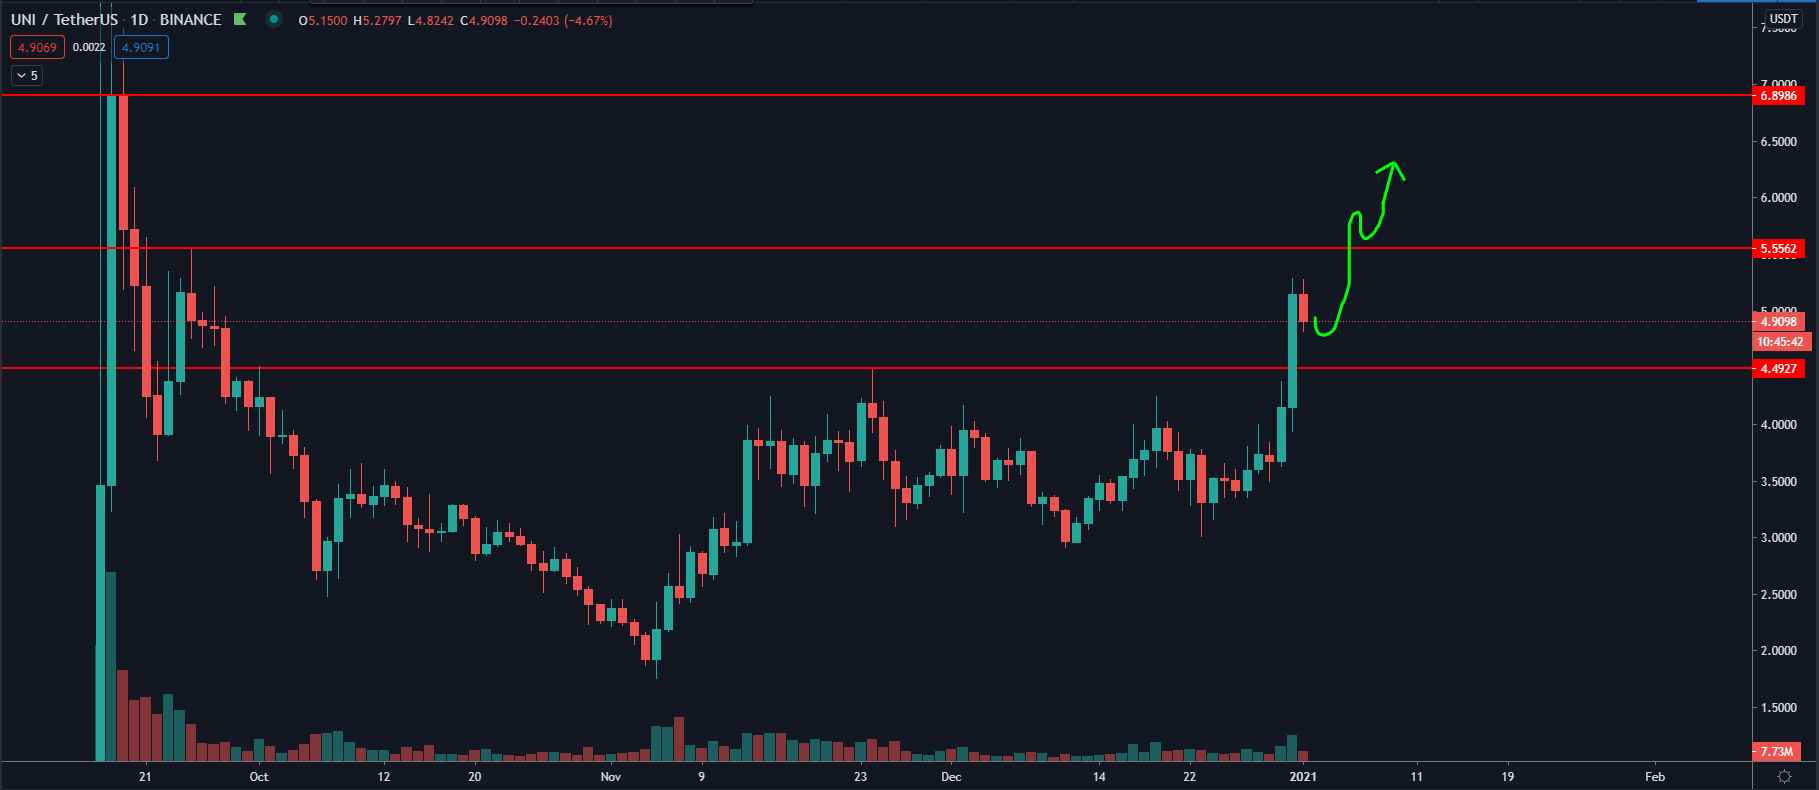
Cryptocurrency trader @Daancrypto outlined a chart showing how UNI is likely to stay above $4.50 and increase all the way to $7 if it does.
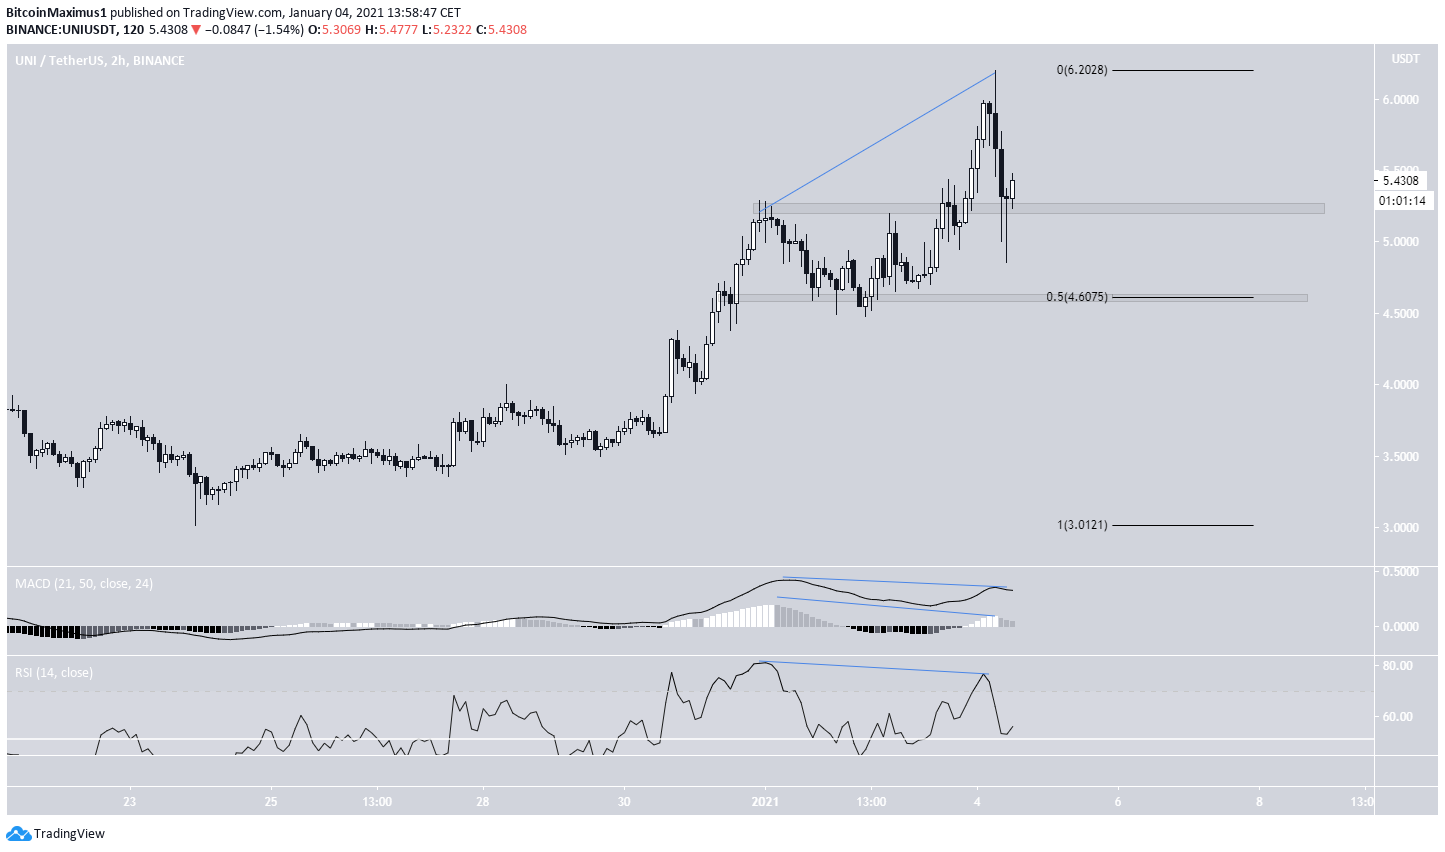
However, the two-hour chart shows pronounced weakness, in the form of bearish divergence in both the RSI and the MACD.
A fall has already occurred as a result of the divergence, with UNI trading just above the $5.20 minor support level. The next support area is at $4.60.
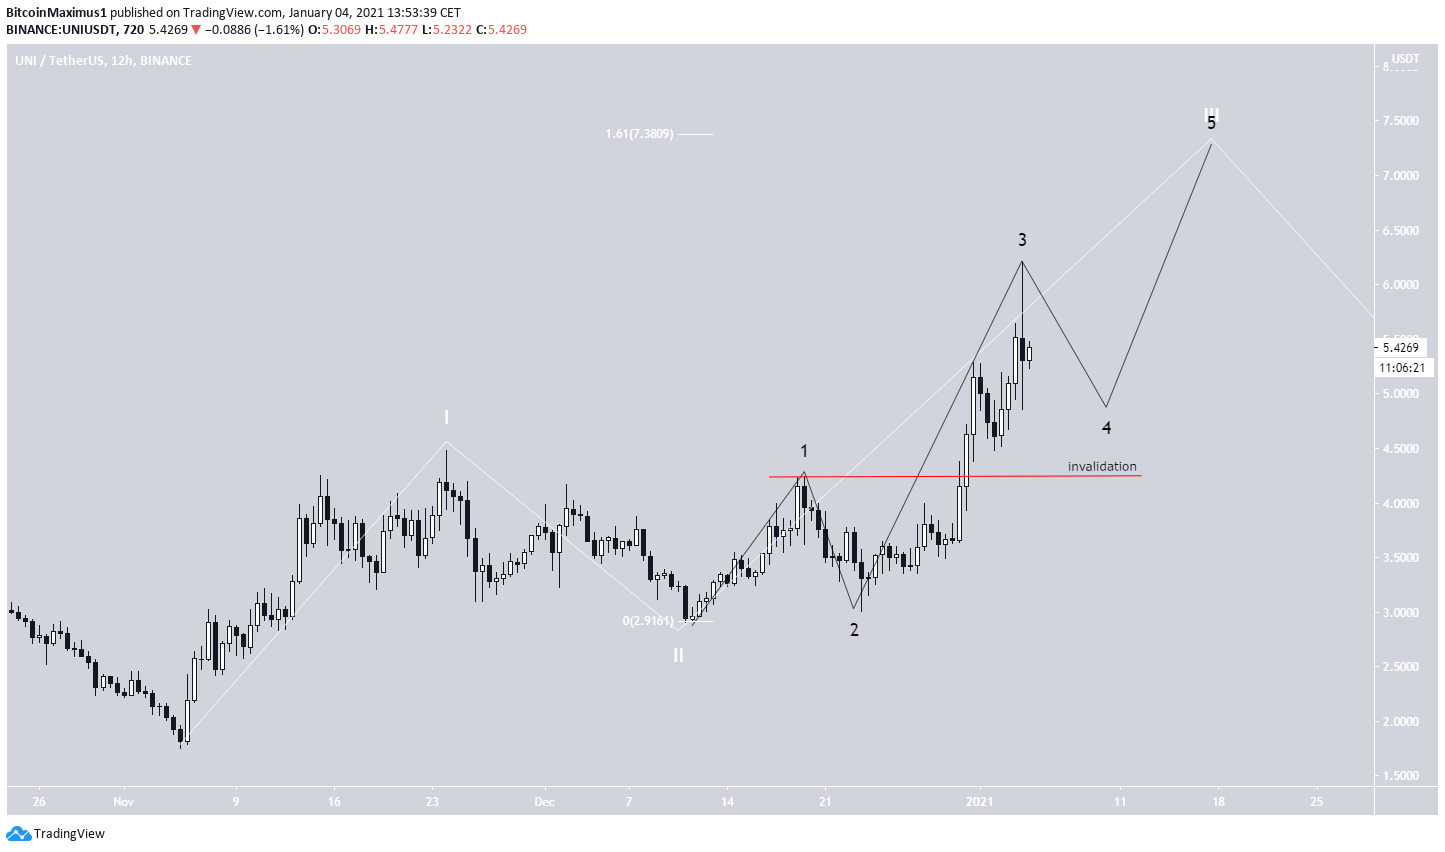
The wave count also suggests that another drop will occur before it resumes its upward movement.
The most likely count suggests that UNI is currently at the top of sub-wave 3 (shown in black below) of wave 3 (shown in white).
A possible target for the top of wave 3 is at $7.40, which would give waves 1:3 a 1:1.61 ratio, common in bullish impulses.
A decrease below the sub-wave 1 high at $4.20 (red line) would invalidate this particular wave count.
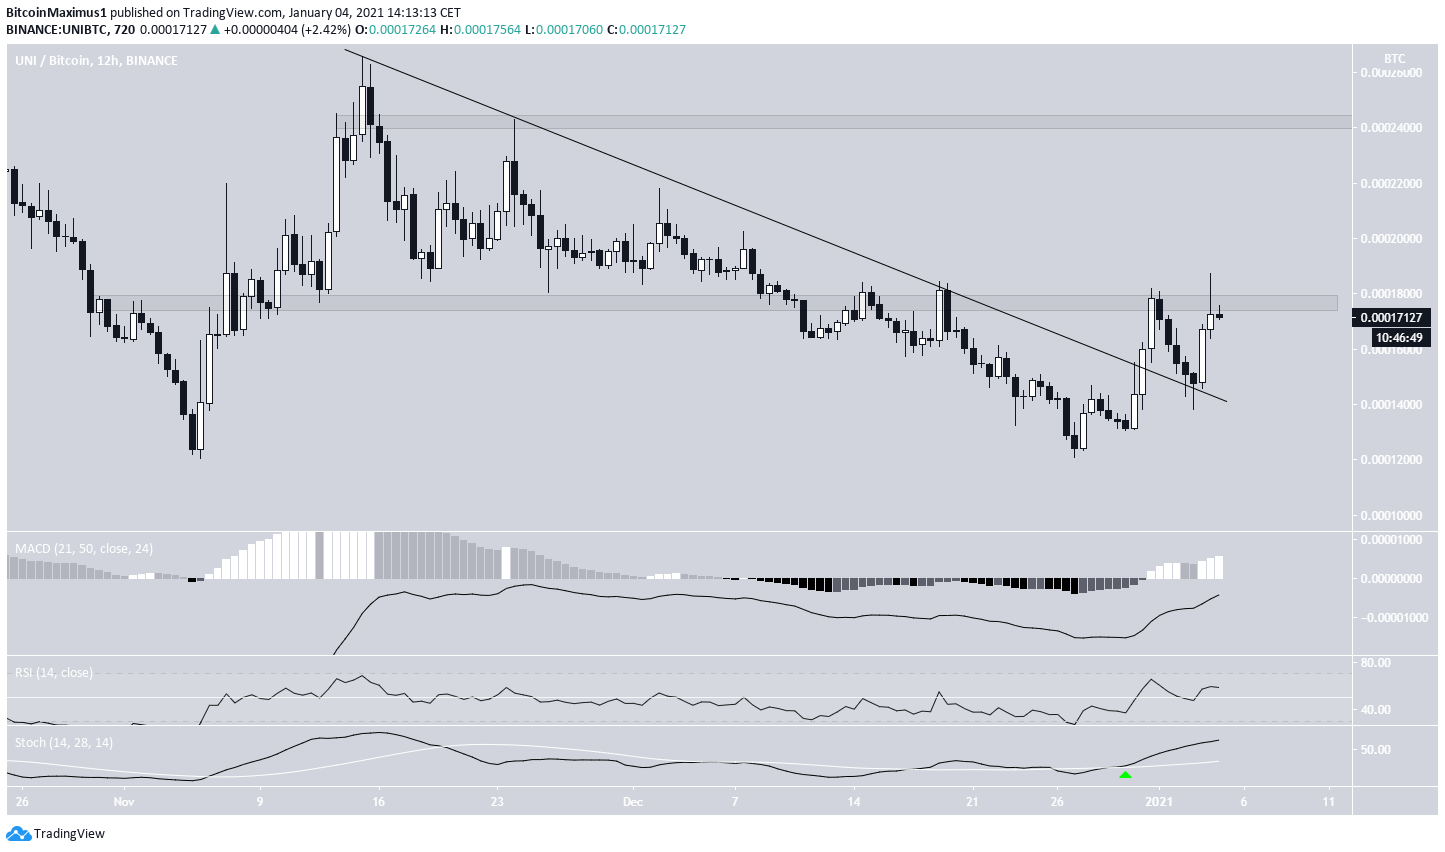
UNI/BTC
The UNI/BTC pair had been following a descending resistance line since Nov. 15. On Dec. 31, UNI broke out from this line but was rejected by the 17,700 resistance area. Afterward, it returned to validate the resistance line and initiated another upward move.
Currently, it’s making another attempt to break out from this resistance area.
Technical indicators are bullish, indicating that UNI is likely to break out. If it does, the next resistance area would be at 23,700 satoshis.
Conclusion
To conclude, both the UNI/USD and UNI/BTC pairs are expected to resume their upward movement, despite the potential for short-term drops.
For BeInCrypto’s latest Bitcoin (BTC) analysis, click here!
Disclaimer: Cryptocurrency trading carries a high level of risk and may not be suitable for all investors. The views expressed in this article do not reflect those of BeInCrypto.


