

Uniswap Labs launched Uniswap Labs Ventures, its venture capital arm, on April 12. However, the price action for Uniswap (UNI) shows mixed signs.
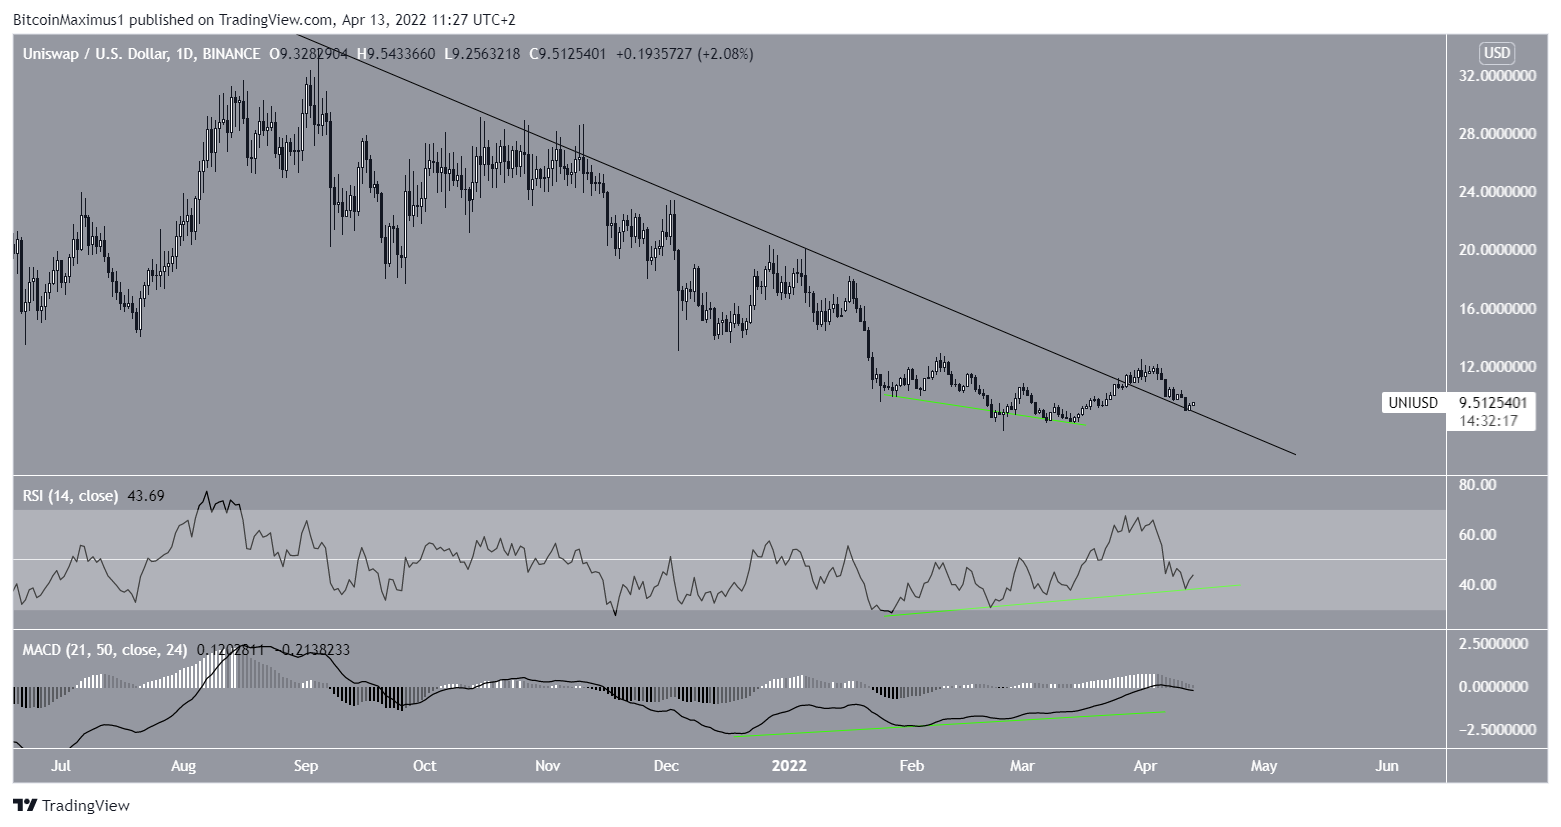
UNI has been falling since reaching an all-time high price of $48.12 on May 5. The downward movement has so far led to a low of $7.51 on Feb 24. The ensuing bounce validated the $8.30 area as support.
This is an interesting horizontal level since it previously acted as resistance during the day of the launch on Sept 18 2020 (red icon). It is likely that the area will now act as support.
After the bounce, UNI broke out from a descending resistance line that had been in place since the all-time high. This is a sign that the downward movement might have come to an end.

Mixed indicator readings
Technical indicators for UNI in the daily time frame are mixed.
On the bullish side, both the RSI and MACD have generated bullish divergences (green lines). These divergences preceded the breakout from the resistance line.
On the bearish side, the RSI and MACD are both falling. Furthermore, the former is below 50 and the latter is negative. These are considered signs of a bearish trend.
UNI wave count analysis
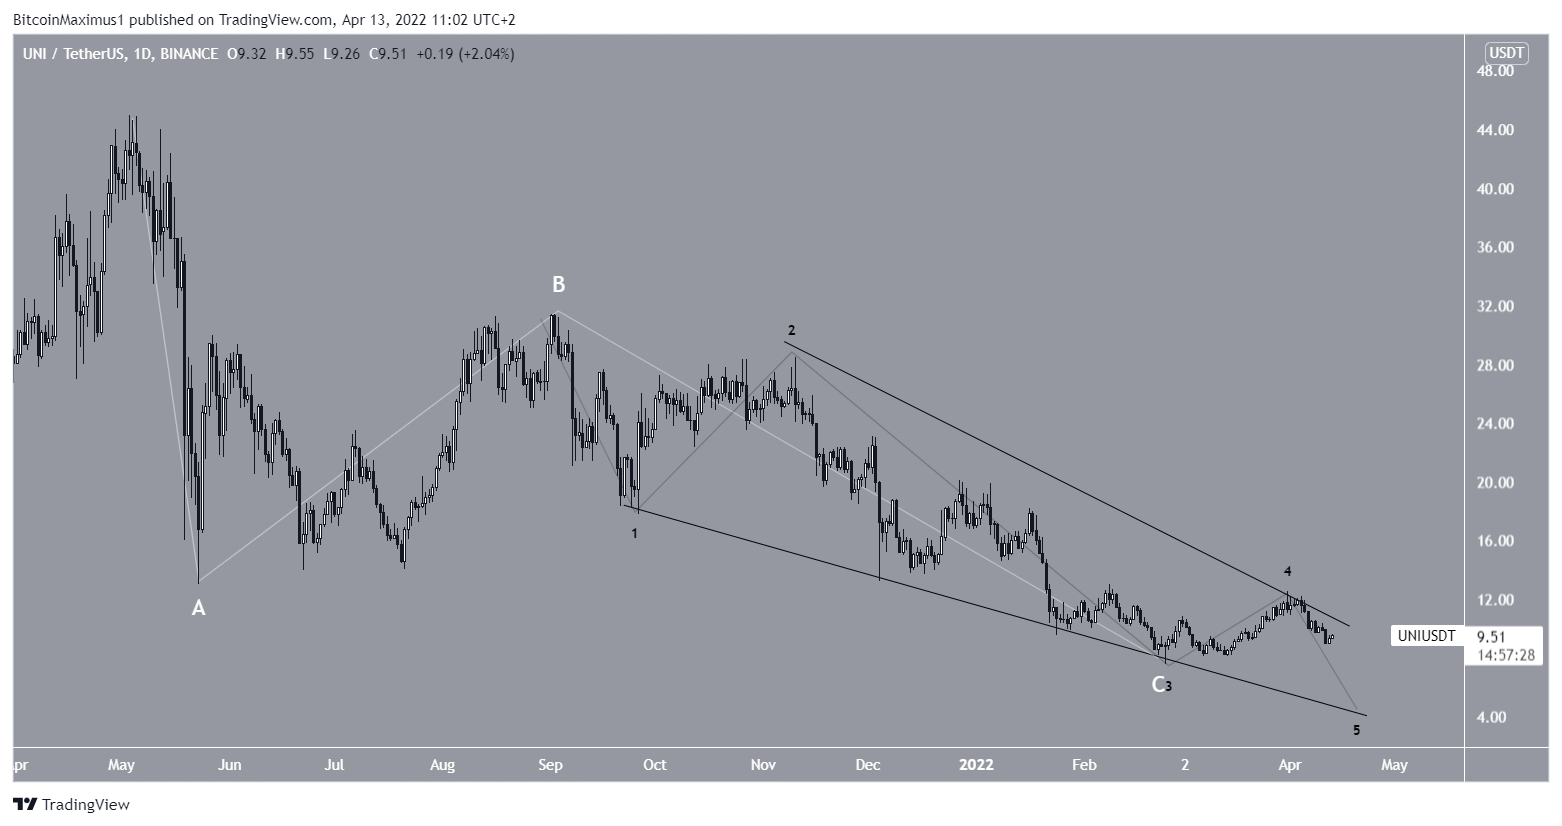
The most likely long-term count suggests that UNI is mired in an A-B-C corrective structure (white) when measuring from the aforementioned all-time high price.
The sub-wave count is shown in black, suggesting that wave C evolved into an ending diagonal.
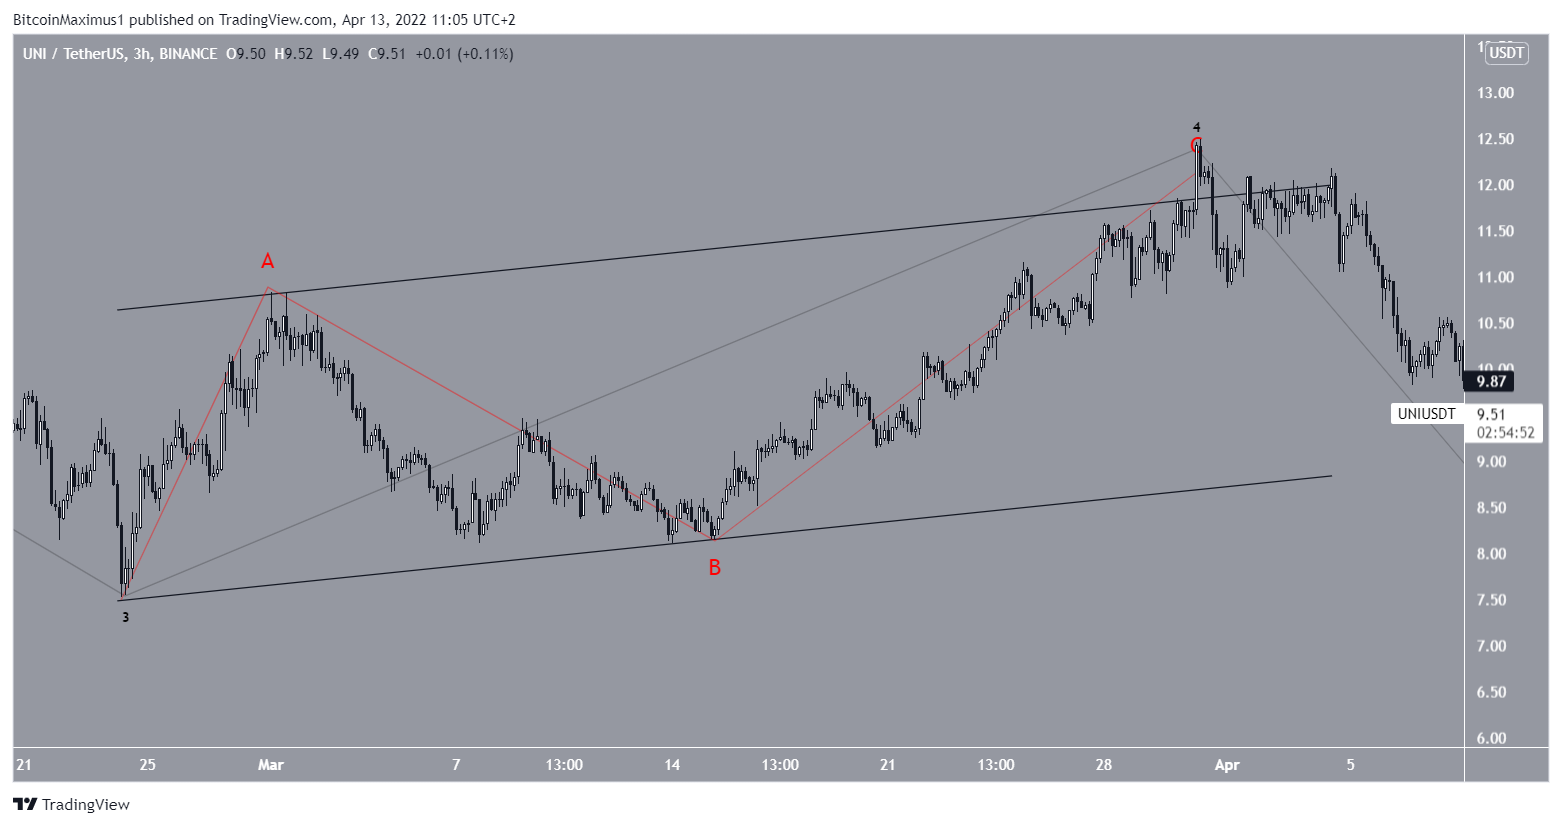
Cryptocurrency trader @JacobEmmerton stated that UNI could be completing a short-term running flat correction.

The most bullish possibility does indeed suggest that UNI is in a running flat correction.
However, it is also possible that the price has already completed an A-B-C correction (red) and is now heading downwards. This would fit better with the potential long-term count outlined prior.
Due to the mixed readings from both technical indicators and the price action, the direction of the trend cannot be determined with any confidence.
For Be[in]Crypto’s latest Bitcoin (BTC) analysis, click here
Disclaimer
In line with the Trust Project guidelines, this price analysis article is for informational purposes only and should not be considered financial or investment advice. BeInCrypto is committed to accurate, unbiased reporting, but market conditions are subject to change without notice. Always conduct your own research and consult with a professional before making any financial decisions. Please note that our Terms and Conditions, Privacy Policy, and Disclaimers have been updated.
