


The Uniswap (UNI) price reached a new all-time high on March 8 but has been decreasing since.
Similarly, Polkadot (DOT) has been falling back since reaching its all-time high on Feb. 20.
New All-Time High for UNI
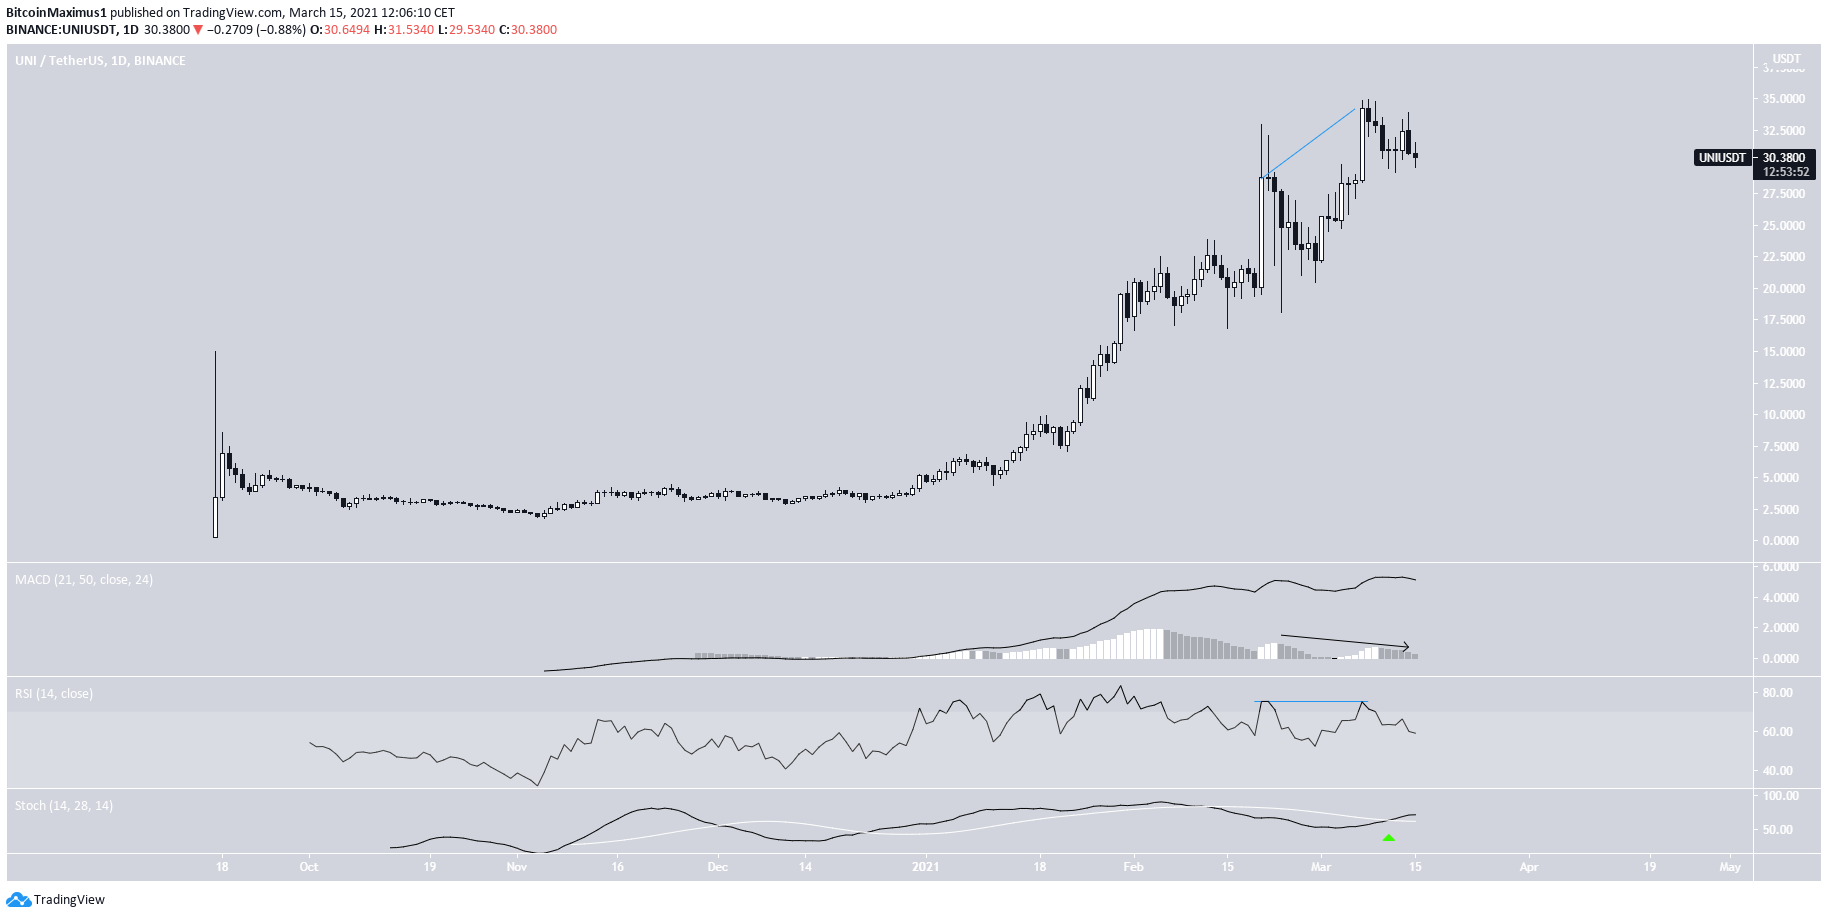
UNI has been on an extended upward move for the entirety of 2021. On March 8 it reached a new all-time high price of $34.92.
However, it generated some bearish divergence and has decreased slightly since.
The Stochastic oscillator has made a bullish cross, and the MACD is still positive despite some decreasing.
Therefore, it’s still likely that the long-term trend is bullish.
Cryptocurrency trader @TheEurosniper outlined an UNI chart, stating that the current retest is expected to provide a bounce. This could take UNI towards a potential new high.
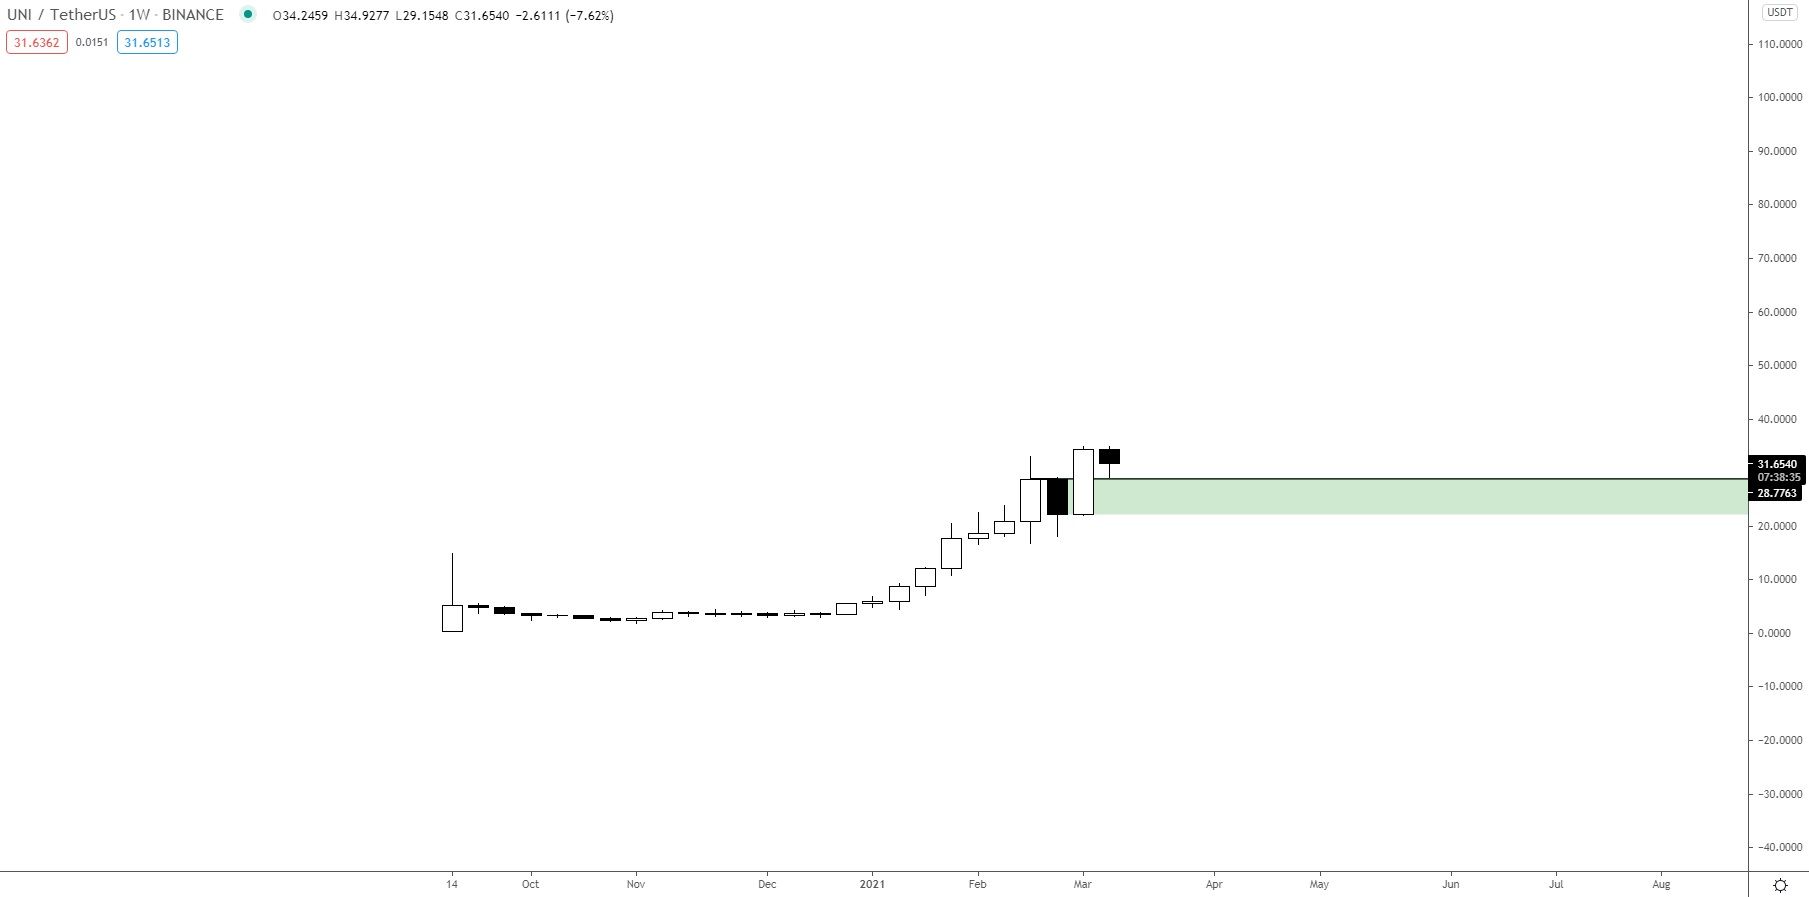
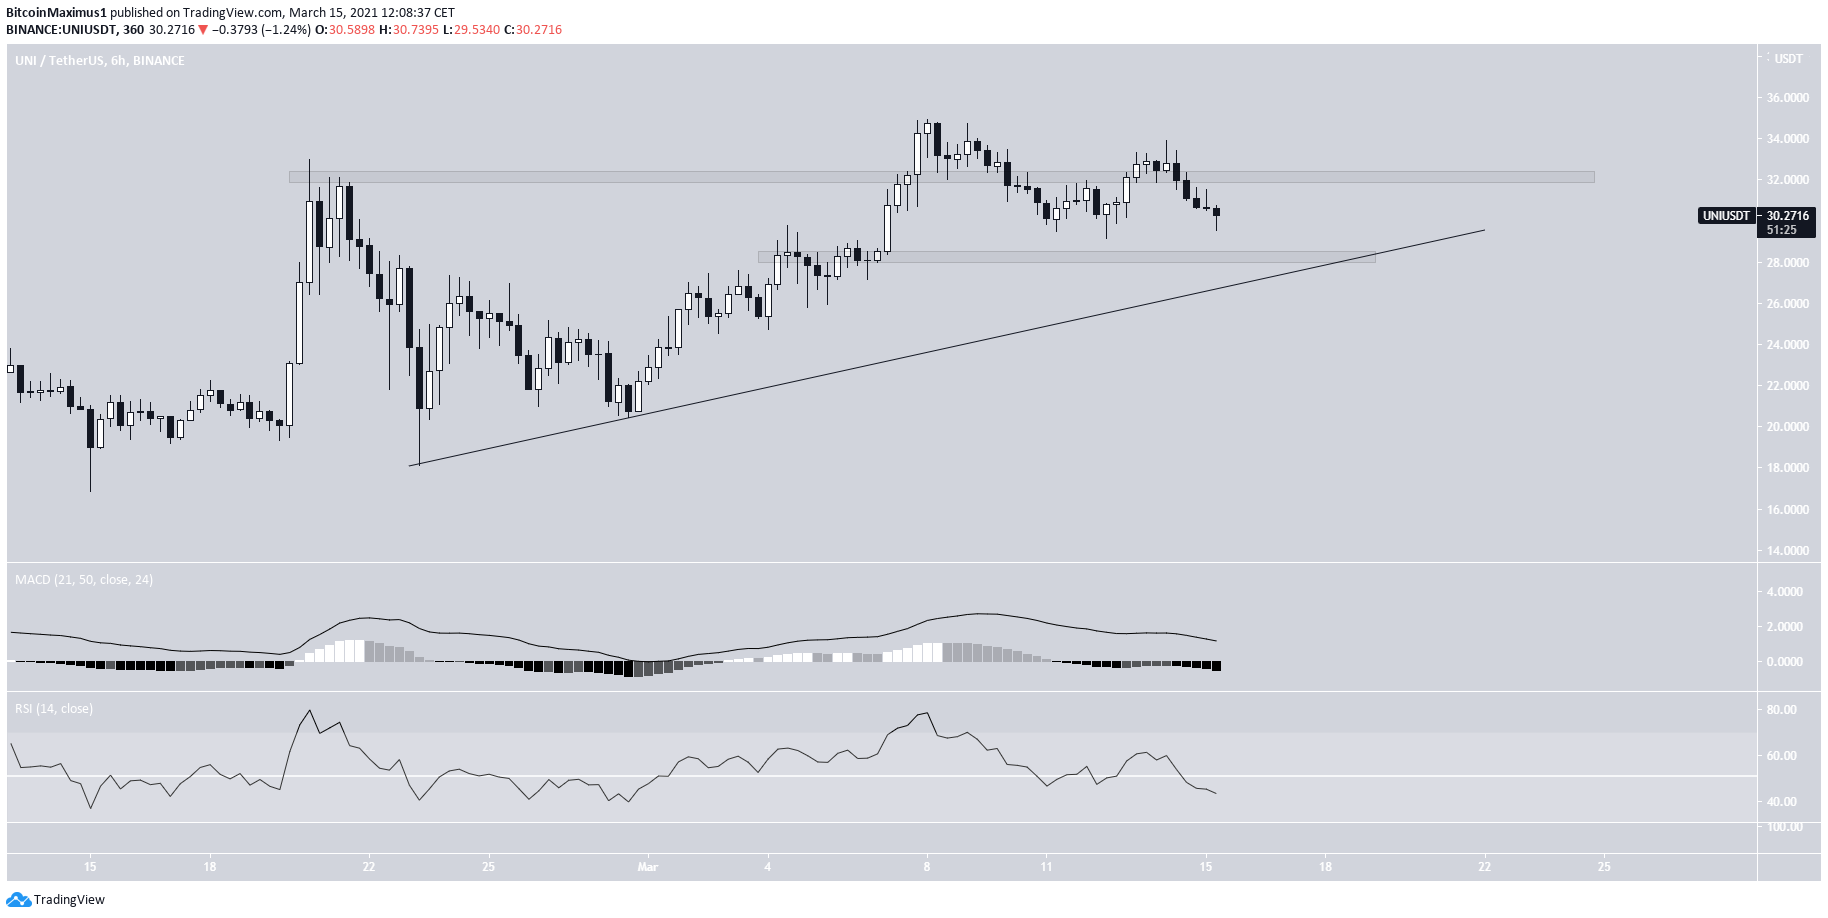
However, UNI has fallen below the retest levels since. Short-term indicators are bearish, so it’s possible that UNI will continue to decrease.
If so, the next closest support area is found at $28. This level also coincides with an ascending support line.
Afterwards, a breakout and new all-time high would be expected.
DOT Lags Behind
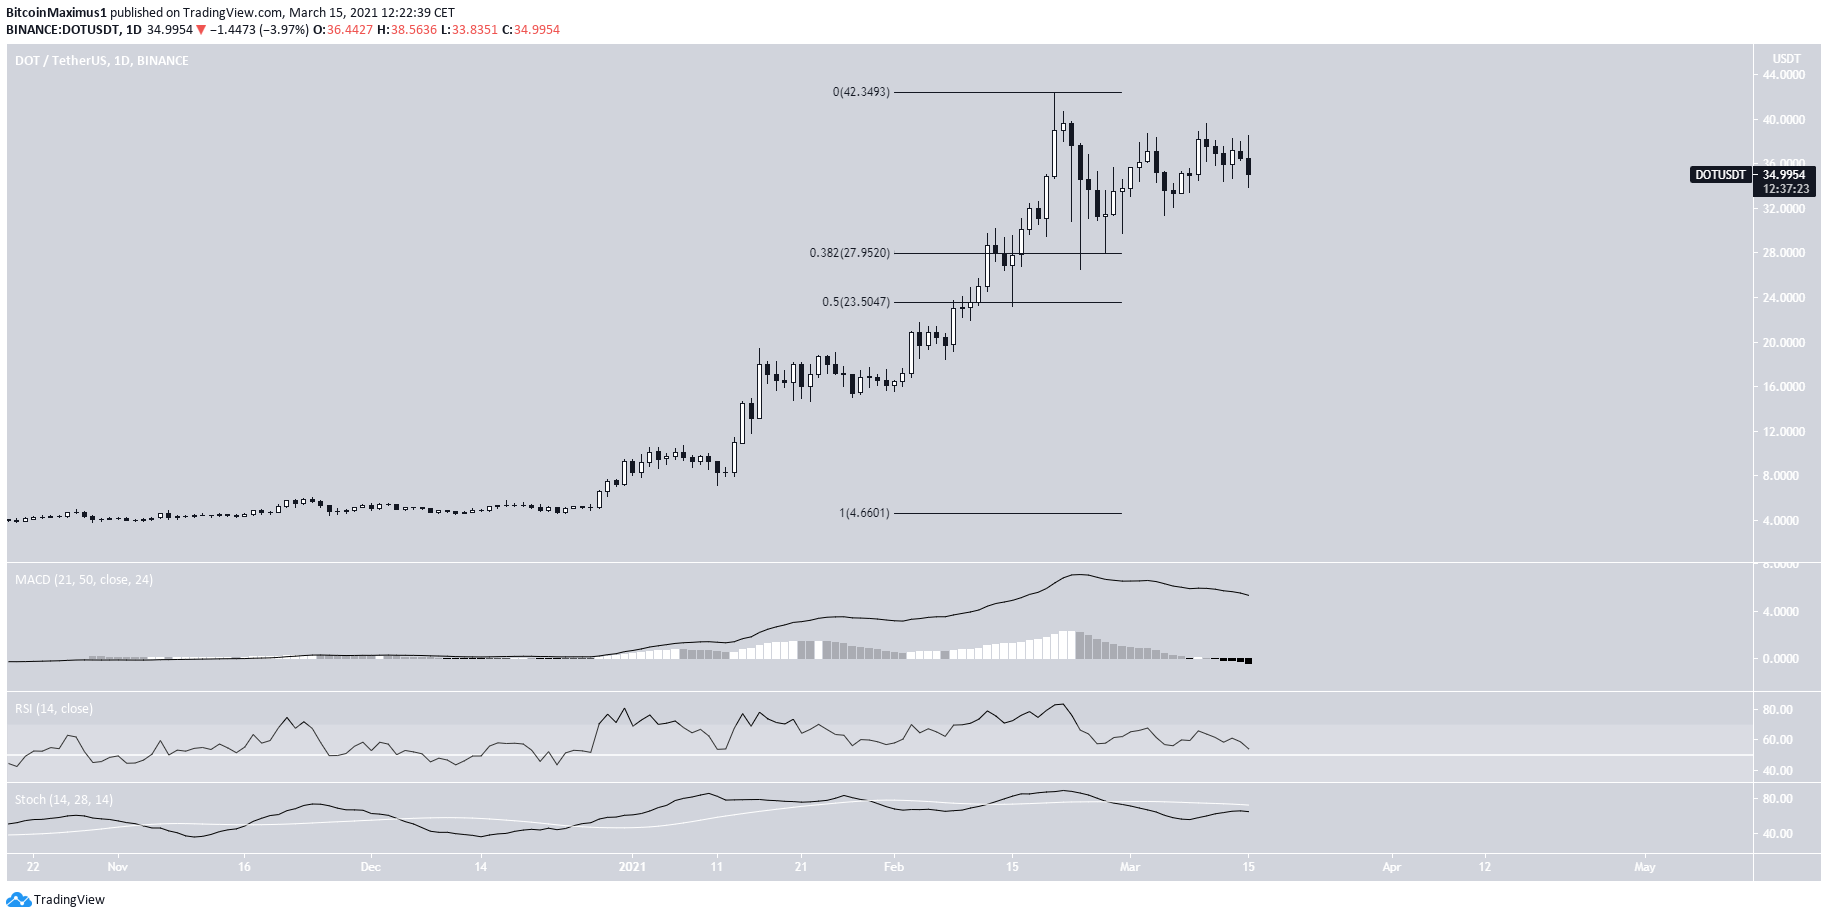
DOT has also been on a downward path since Feb. 20 when it reached a new all-time high of $48.20.
Unlike UNI, technical indicators in the daily time-frame are bearish.
If DOT were to keep falling, the closest support levels would be found at $27.95 and $23.50. These are the 0.382 and 0.5 Fib retracement levels of the previous upward movement.
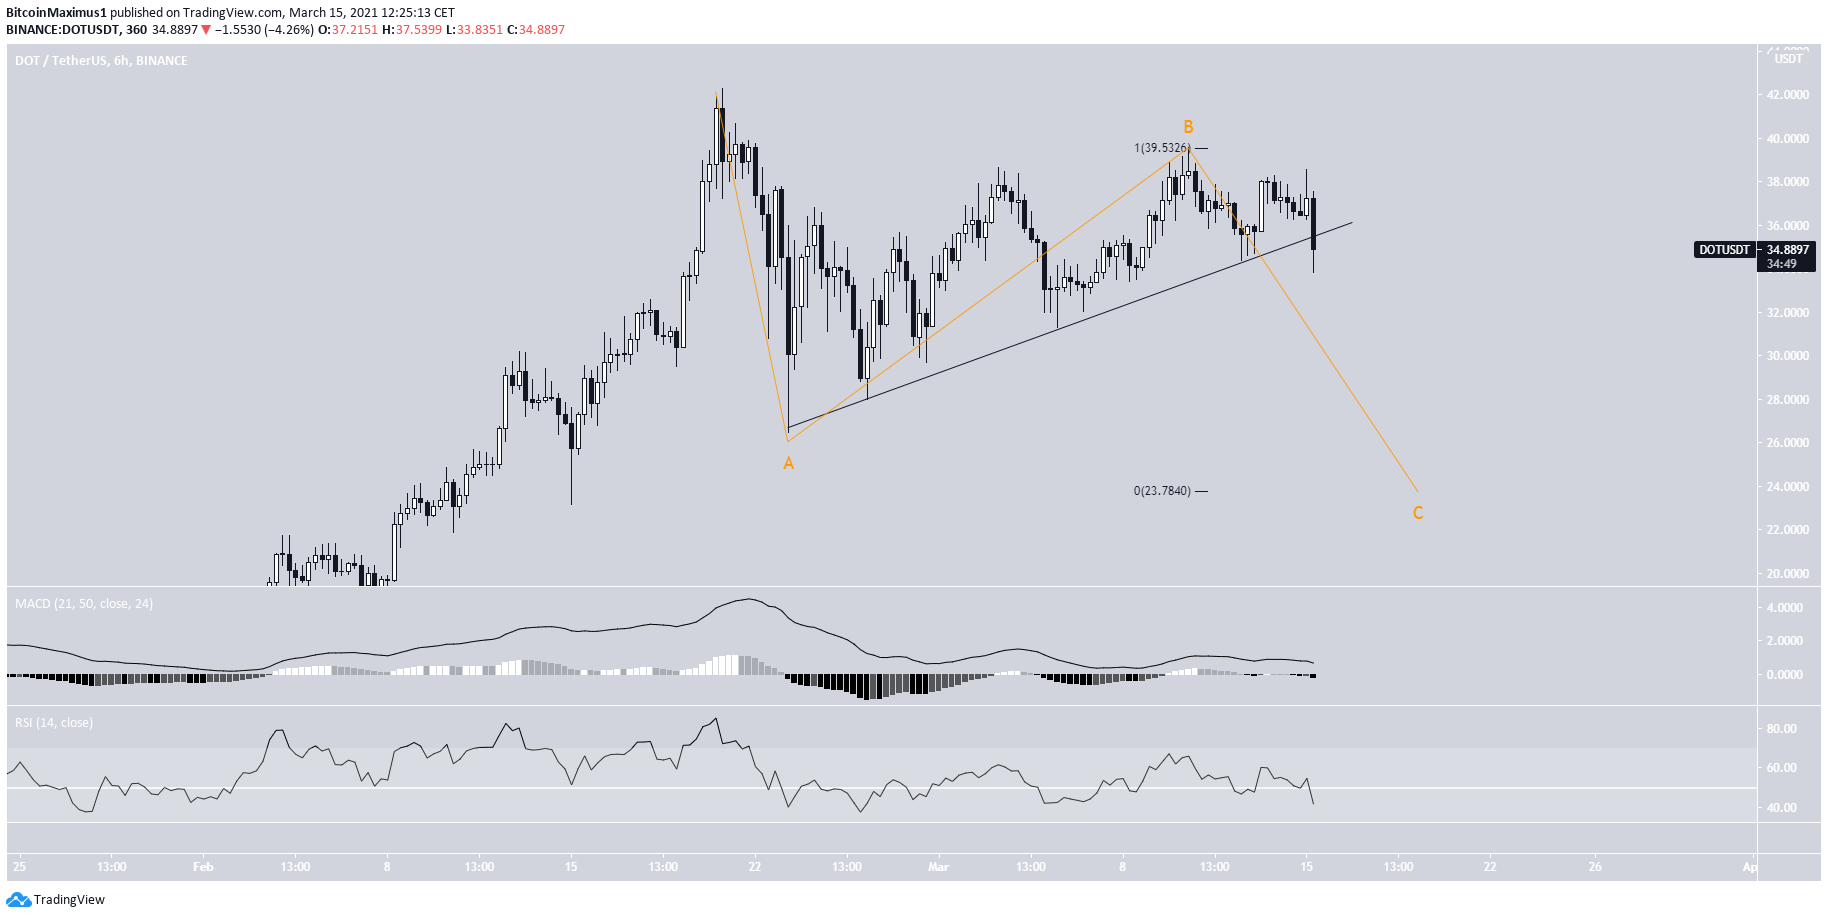
The six-hour chart shows a potential breakdown from an ascending support line.
If this is a zig-zag corrective structure, DOT could decrease all the way to $23.70.
This fits with the 0.5 Fib retracement level from the previous chart. In addition, it would give waves A:C a 1:1 ratio.
The MACD and RSI support this possibility.
Conclusion
While both UNI and DOT are expected to eventually reach new all-time highs, a short-term drop is expected first. The drop is likely to be sharper for DOT than it is for UNI.
For BeInCrypto’s latest Bitcoin (BTC) analysis, click here.


