The Maker (MKR) price has broken out from a descending resistance line and validated it as support afterward. The price should continue moving upwards towards the next resistance area at ₿0.095.
The pNetwork (PNT) price has reached an important support area, which should act as the bottom of the current corrective movement.
Maker (MKR)
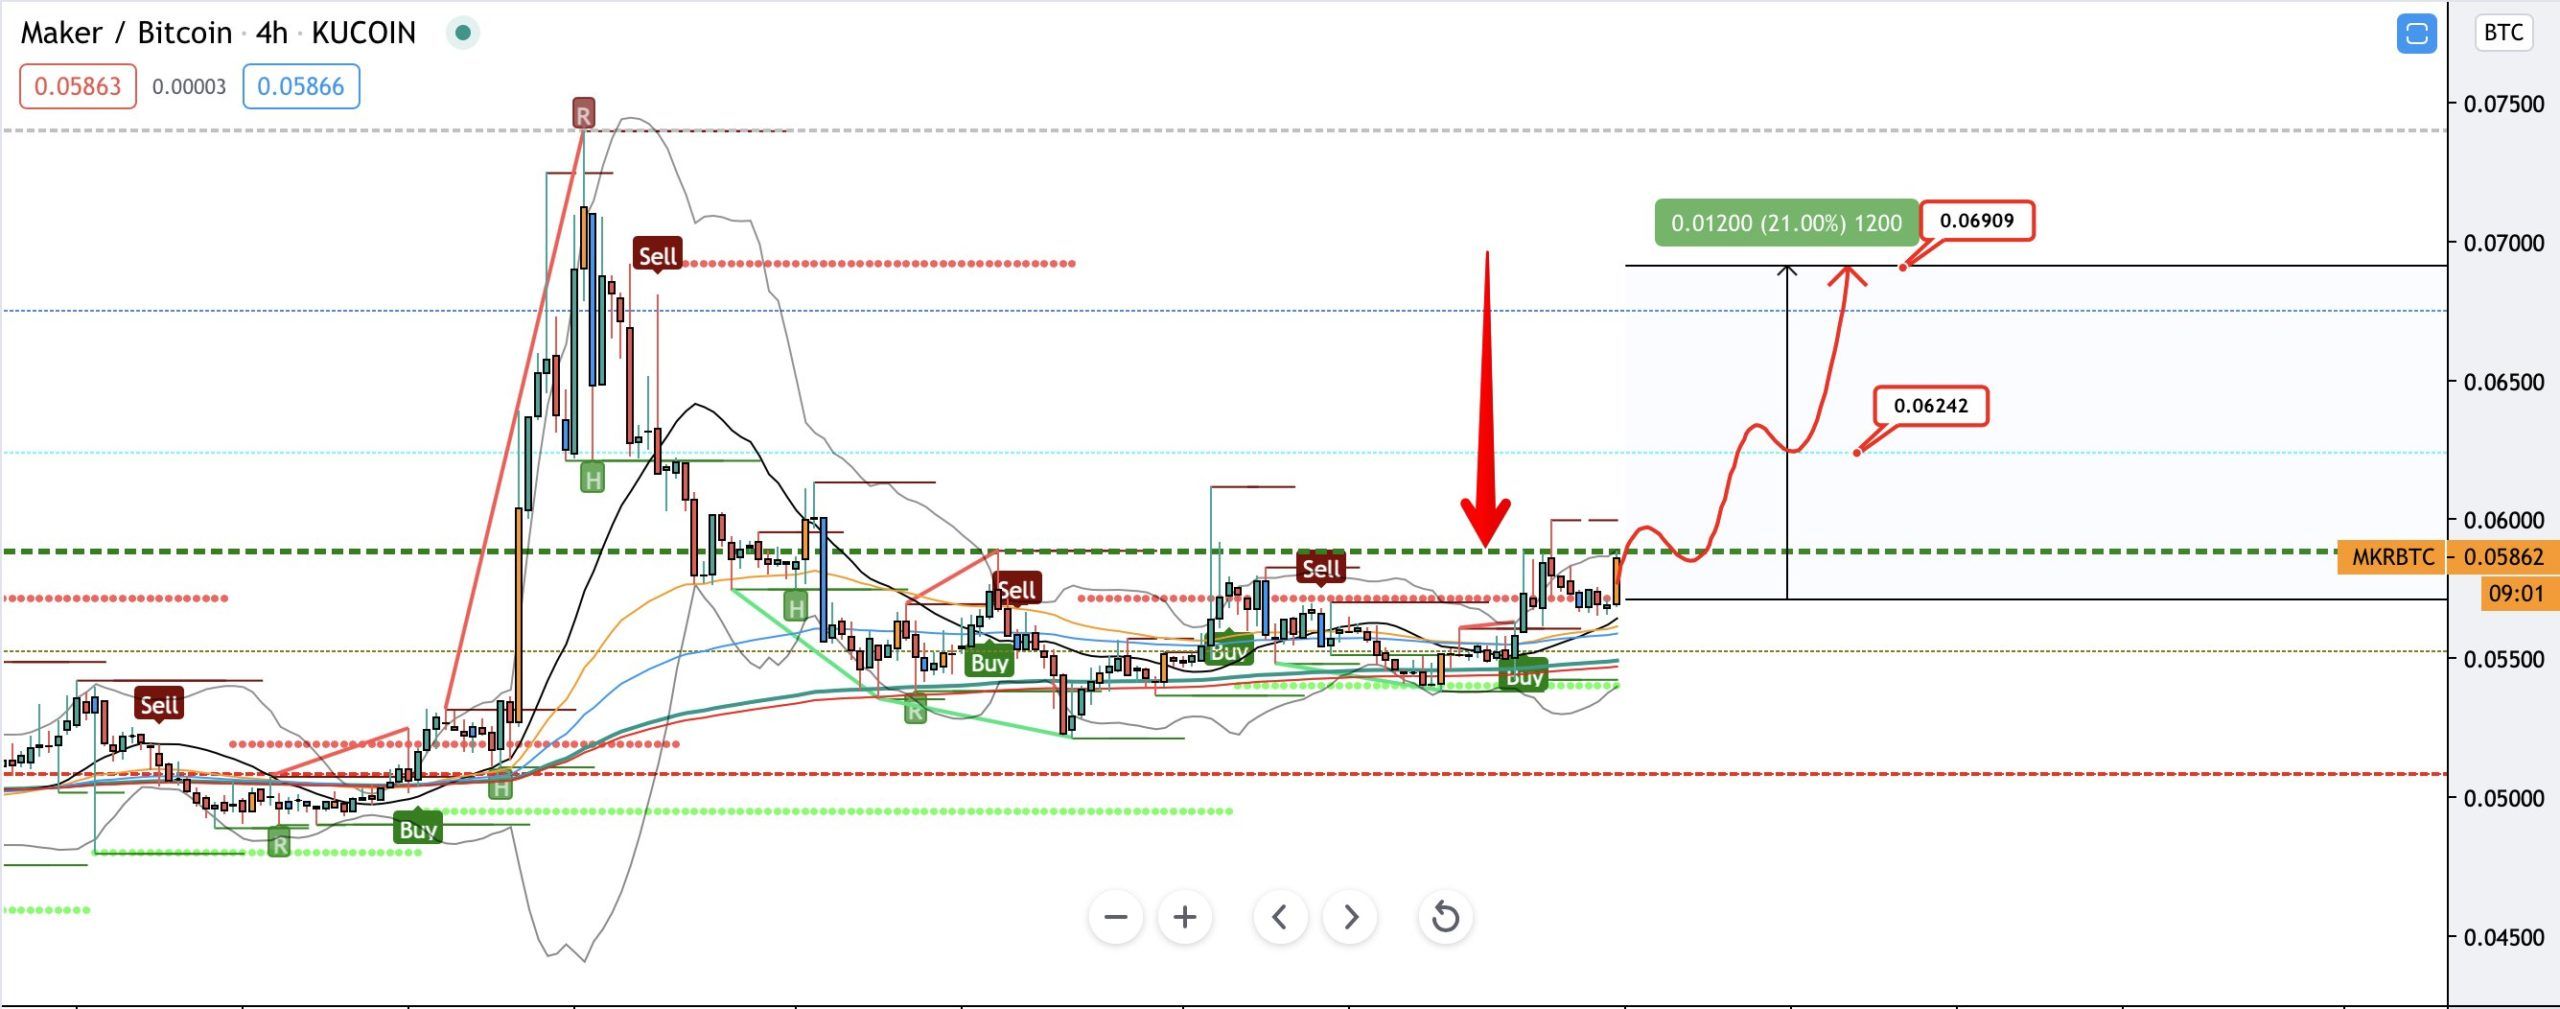
Cryptocurrency trader @CryptoNewton outlined a MKR chart, stating that the price is likely to continue moving upwards.
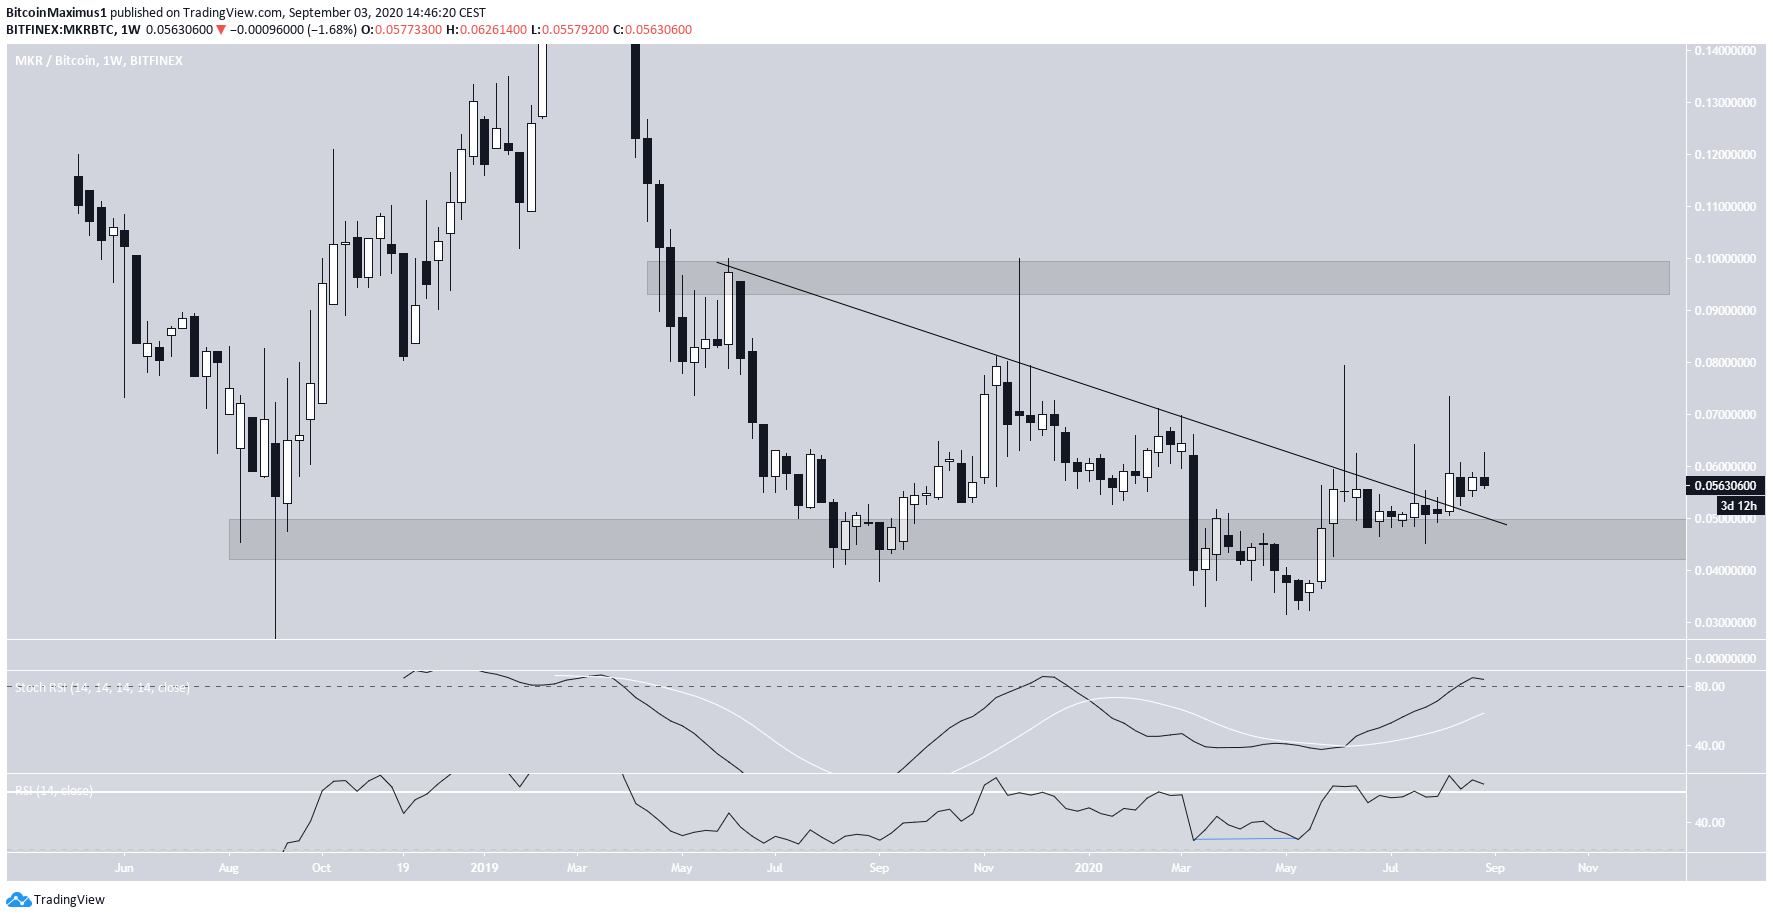
The MKR price had been following a descending resistance line since May 2019. The price successfully broke out at the beginning of August and has validated the line as support since.
Before doing so, MKR deviated below the all-time low of ₿0.045 but reclaimed the level shortly after, before breaking out. This move was combined with bullish divergence on the weekly RSI. While the stochastic RSI is oversold, it has made a bullish cross, and there is no bearish divergence yet.
As long as the price is trading above the ₿0.045 level, it should gradually decrease towards the next resistance area at ₿0.095, which is also the level from which the previous descending resistance line is drawn.
pNetwork (PNT)
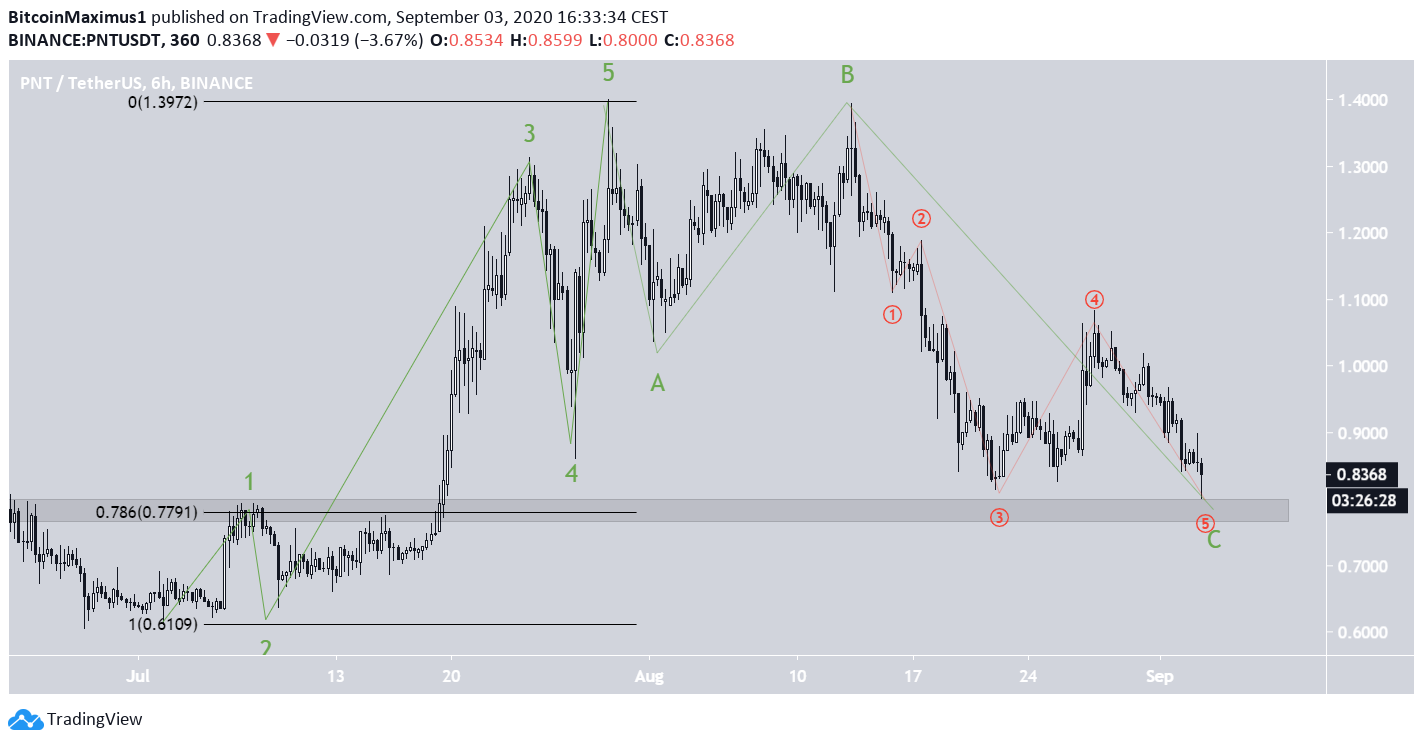
In the period from July 2 to July 29, the PNT price rallied from a low of $0.63 to a high of $1.40. The movement closely resembles a five-wave impulsive formation (shown in green), especially since the bottom of wave 4 came very close but did not breach the top of wave 1.
Since the high, the price has been correcting and has almost reached the $0.79 area, which is both the 0.786 Fib level of the entire fall and a previous resistance area, now likely to act as support.
Furthermore, the corrective wave count suggests that the price is likely to reach a bottom near this level and then resume its upward trend.
A decline below the July 2 bottom at $0.63 would invalidate this particular wave count.