
The DIA (DIA) price has reclaimed an important support level at $1.18 but has yet to show any bullish signs. Penta (PNT) has possibly completed a bearish impulse and has broken out from a descending resistance line.
DIA – Deviation Below the Range Low
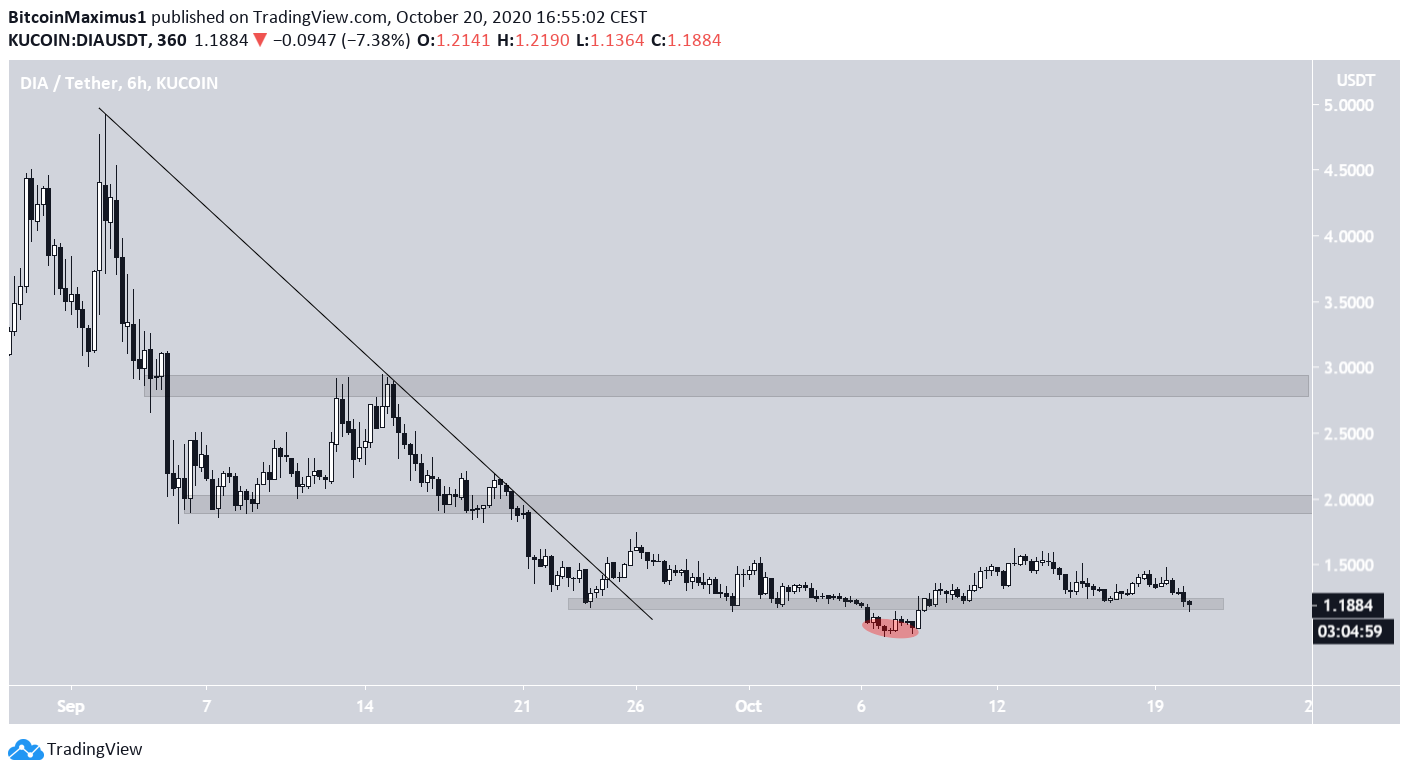
The DIA price had been following a descending resistance line since it reached a high of $4.92 on Sept 2. The price broke out from this line on Sept 25 but has failed to sustain the upward move.
Despite this, there is a bullish sign in the form of a deviation below the $1.18 support area, which was reclaimed shortly afterward. This suggests strength and a likely price move upwards.
If it does, the closest resistance levels are at $1.96 and $2.80, respectively.
Cryptocurrency trader @Cryptonewton outlined a DIA chart, which shows a possible head and shoulders pattern and a descending resistance line. A breakout from this could take the price all the way to $2.80.
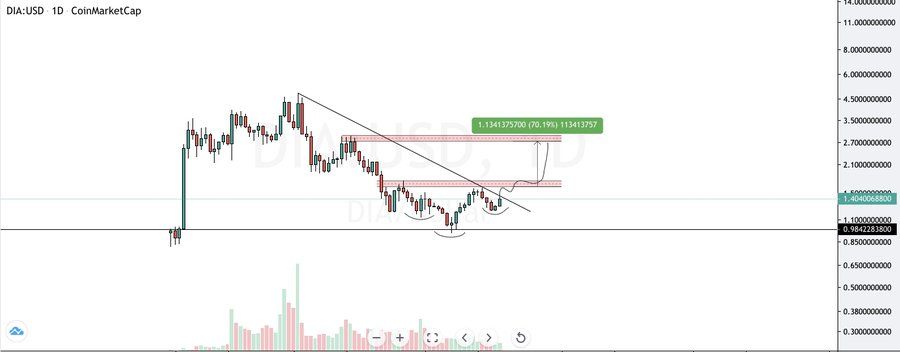
However, as seen in the chart above, it seems that the price has already broken out from the resistance line, and the presence of the inverse head and shoulders is not clear.
Nevertheless, the support area’s deviation suggests that the price will indeed break out, and the $2.80 area coincides with the second resistance area we have outlined.
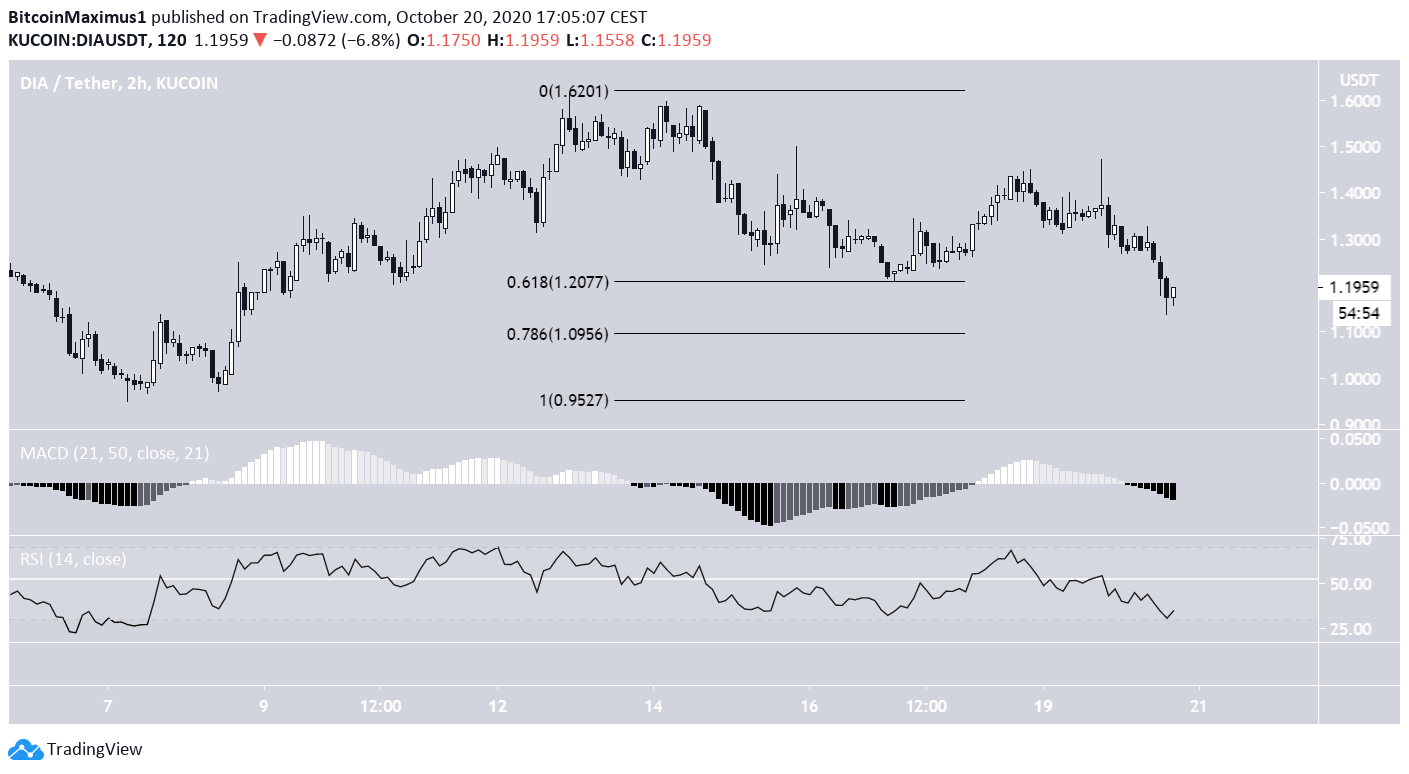
There are no bullish reversal signs yet. The price has yet to make a higher low and has, in fact, declined below the 0.618 Fib level of the upward move. Both the RSI and the MACD are falling, and neither has formed bullish divergence.
A fall below the $1.18 area would likely send the DIA back to new price discovery.
PNT – Bearish Impulse Completed?
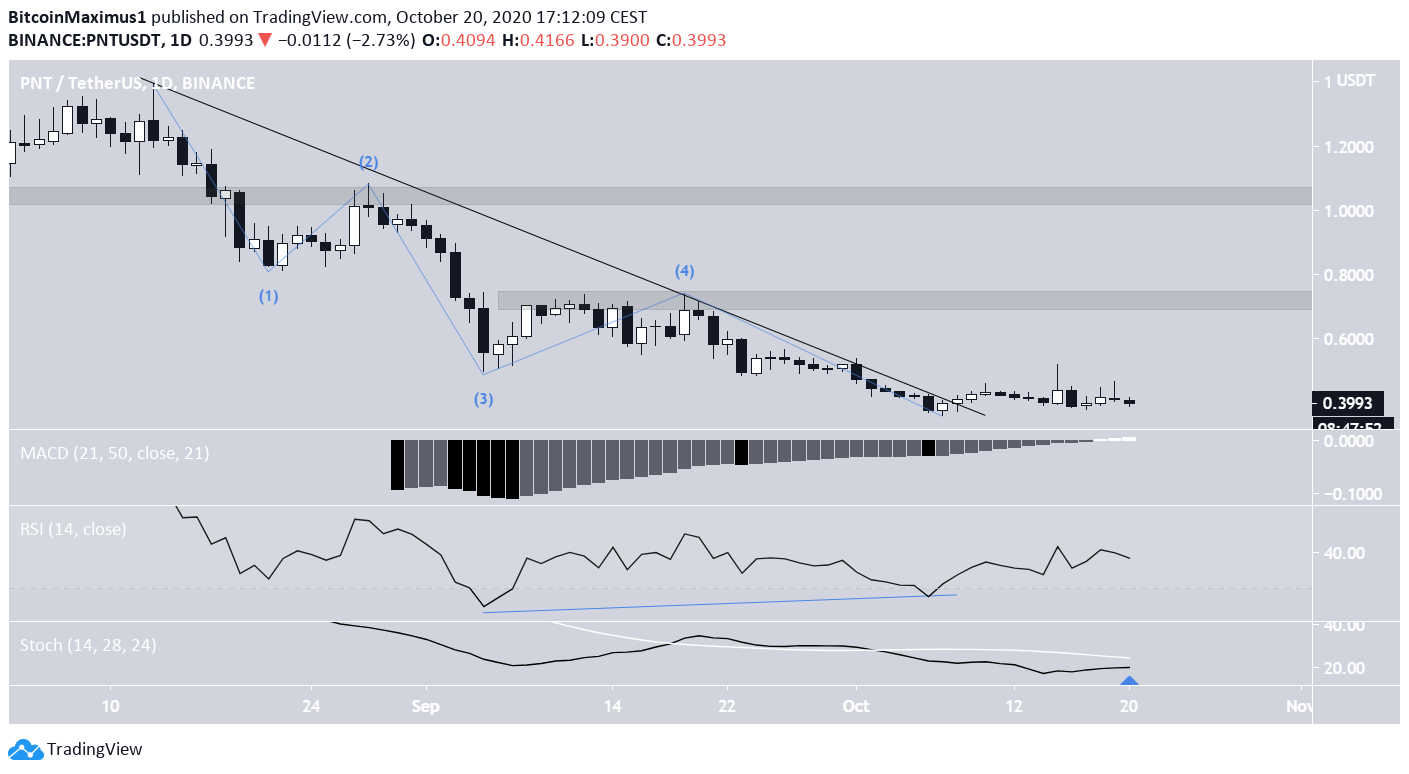
The PNT price had been following a descending resistance line since reaching a high of $1.39 on Aug 13. Throughout this resistance line, it’s possible that the price completed a bearish impulse (shown in blue below) with a low of $0.361, reached on Oct 7. The next day, the price broke out from the resistance line.
While the price has not moved upwards considerably since the breakout, both the RSI and the MACD have generated significant bullish divergence, the latter even having crossed into positive territory. Even though the Stochastic Oscillator has yet to make a bullish cross, it’s very close to doing so.
If the price begins moving upwards, the two closest resistance areas would be found at $0.70 and $1.05.
For BeInCrypto’s previous Bitcoin analysis, click here!
Disclaimer: Cryptocurrency trading carries a high level of risk and may not be suitable for all investors. The views expressed in this article do not reflect those of BeInCrypto.
