The prices of both Sushi (SUSHI) and Polkadot (DOT) have recently reached local bottoms.
While the former seems to have begun a new upward move, it’s possible that the latter is still correcting and has one more lower-low before it resumes its upward movement.
Sushi (SUSHI)
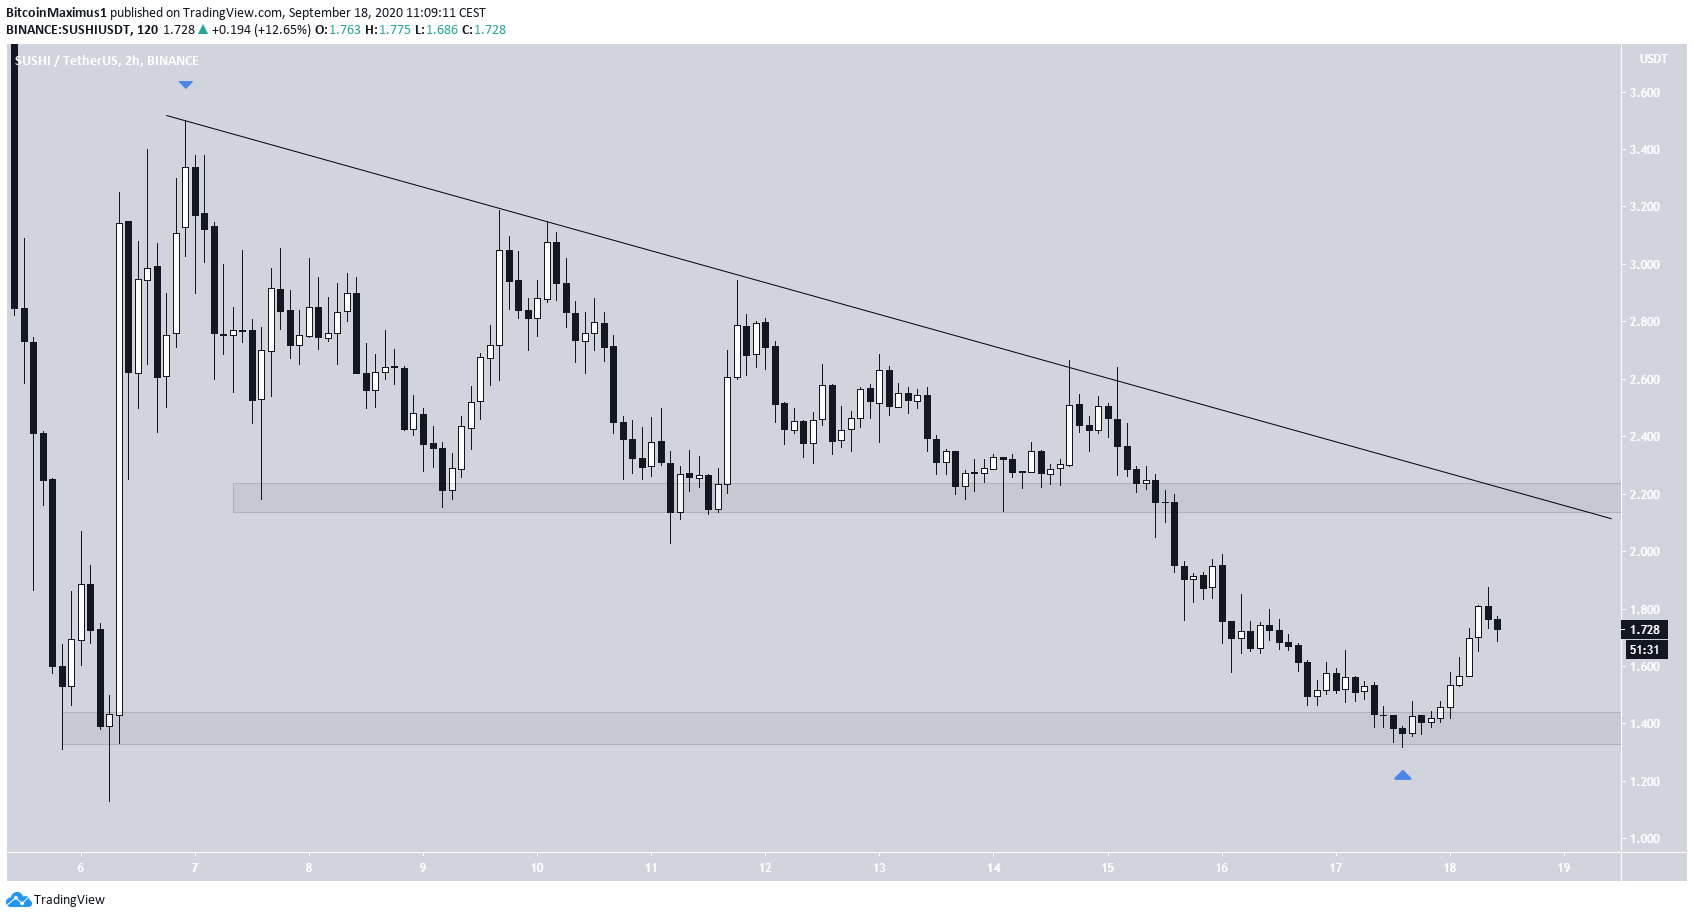
On Sept 6, the SUSHI price reached a high of $3.50. Afterward, it began a downward movement alongside a descending resistance line that is still ongoing.
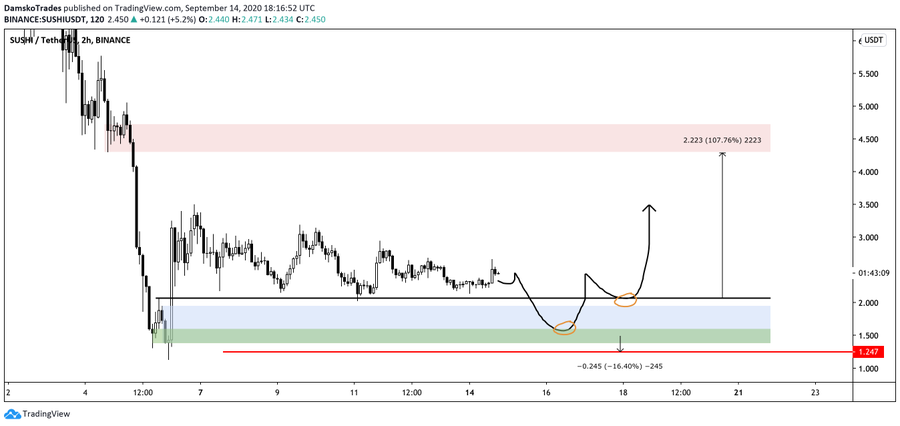
Cryptocurrency trader @damskotrades outlined a SUSHI chart, which suggests the price will reach a bottom near $1.24 before moving upwards once more, possibly targeting $4.50.
Since the tweet, the price has resumed its downward movement and reached a low of $1.319 on Sept 17 and bounced upwards. This validated the $1.40 area as support.
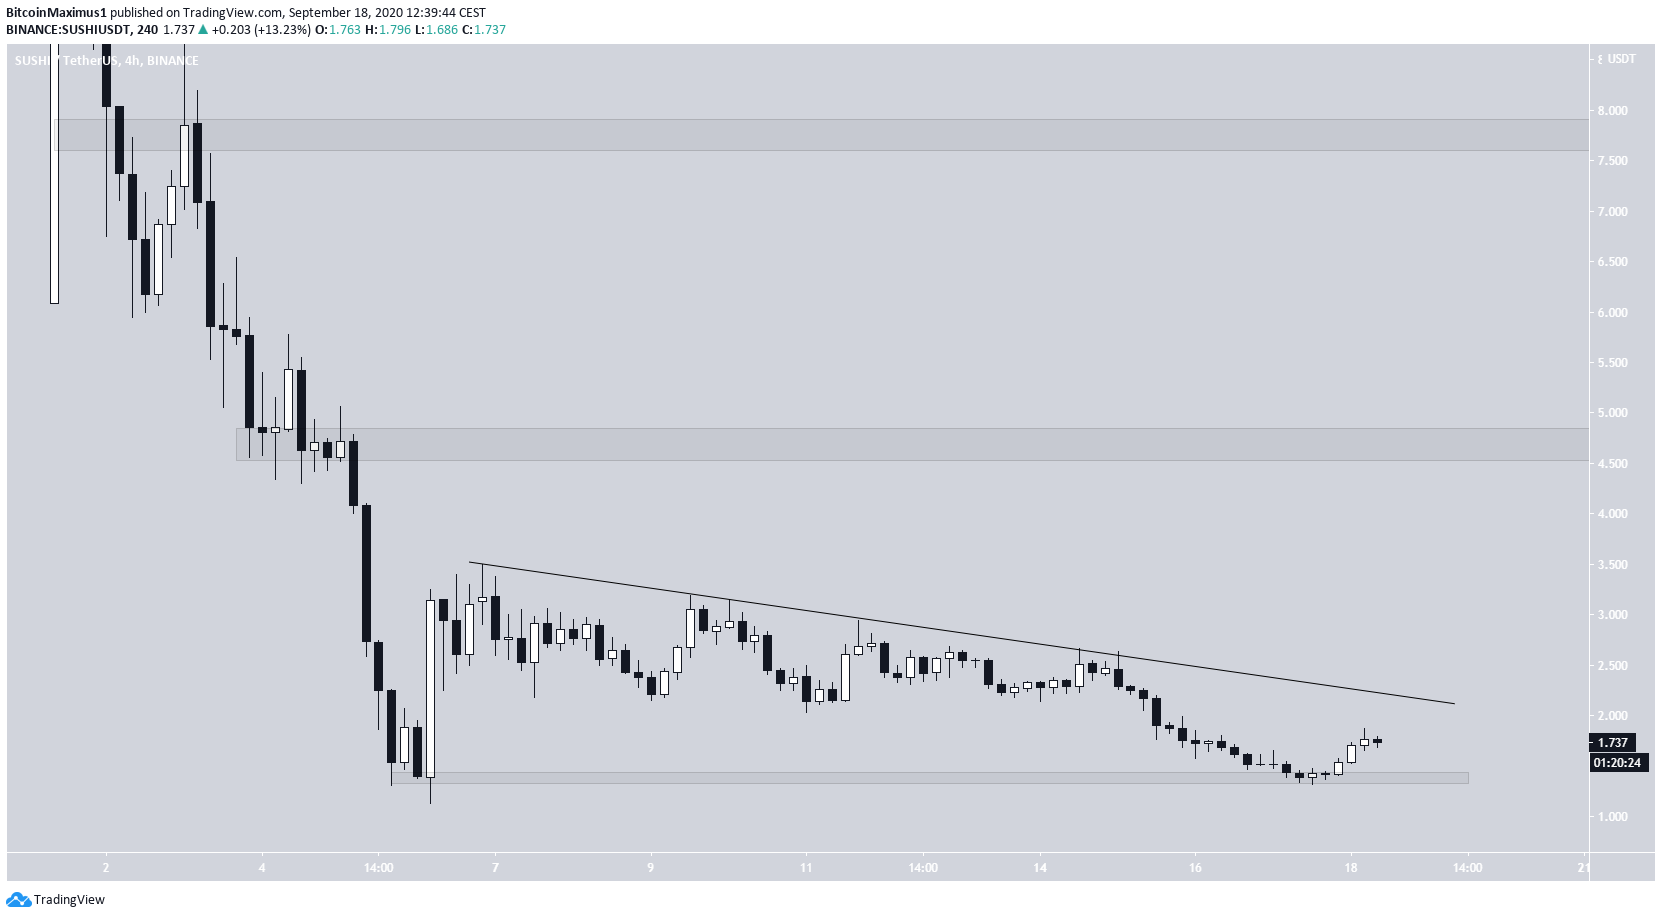
If the price continues moving upwards, the closest resistance area is found at $2.15, a previous support area that now also coincides with the aforementioned descending resistance line.
If the price continues moving upwards, the next resistance areas would likely be found at $4.60 and $7.60, respectively.
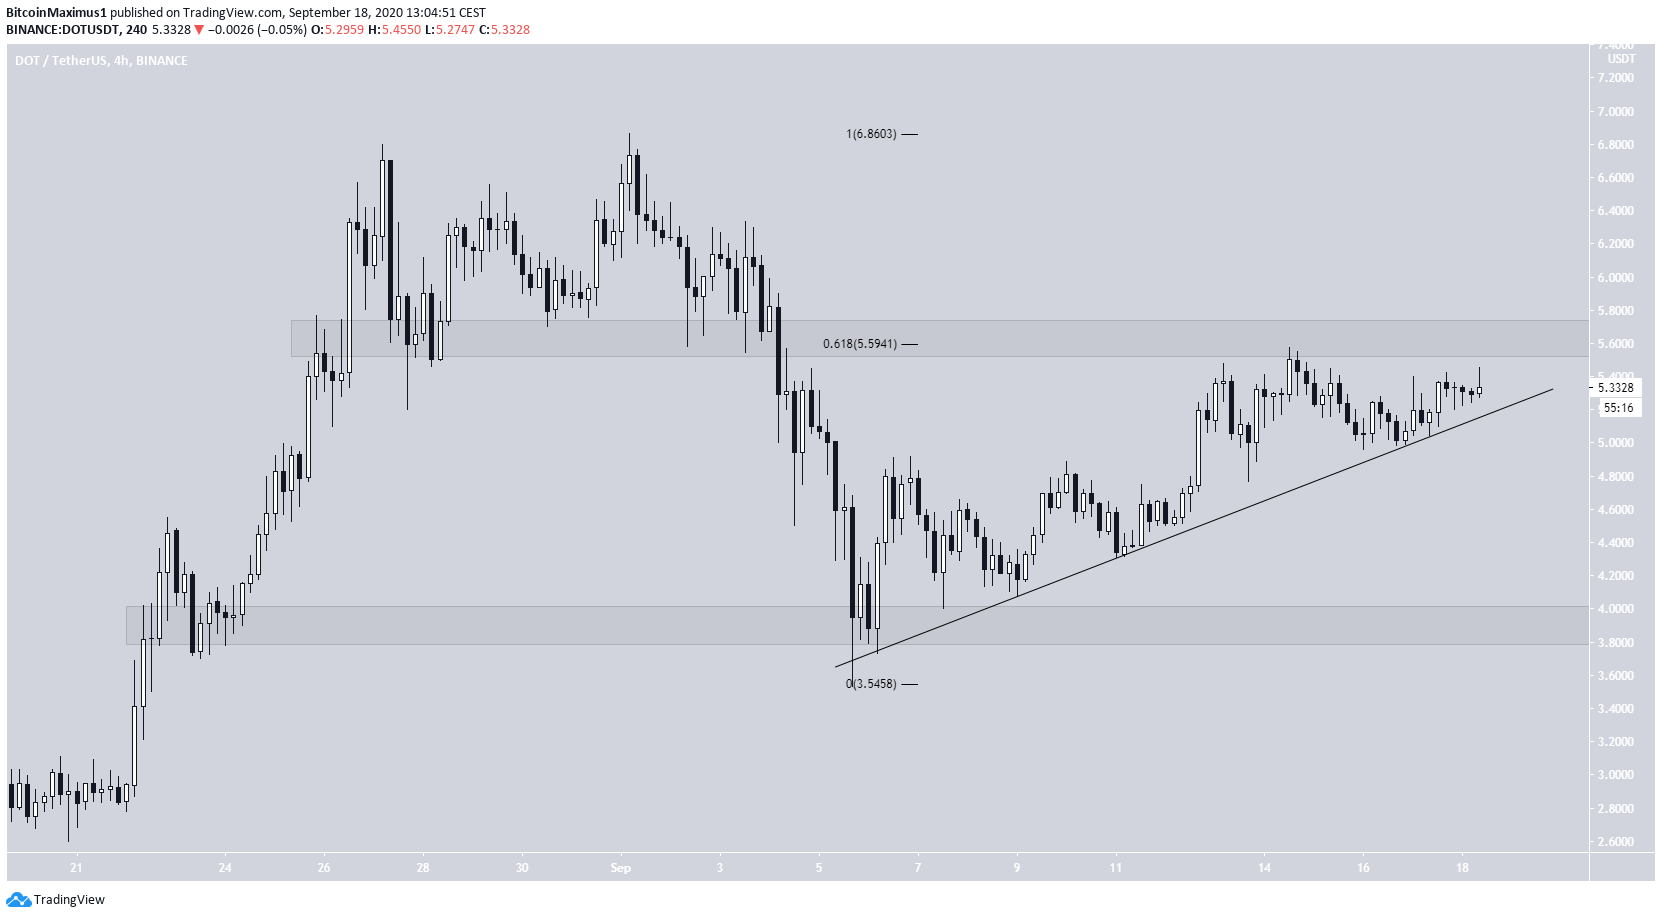
Polkadot (DOT)
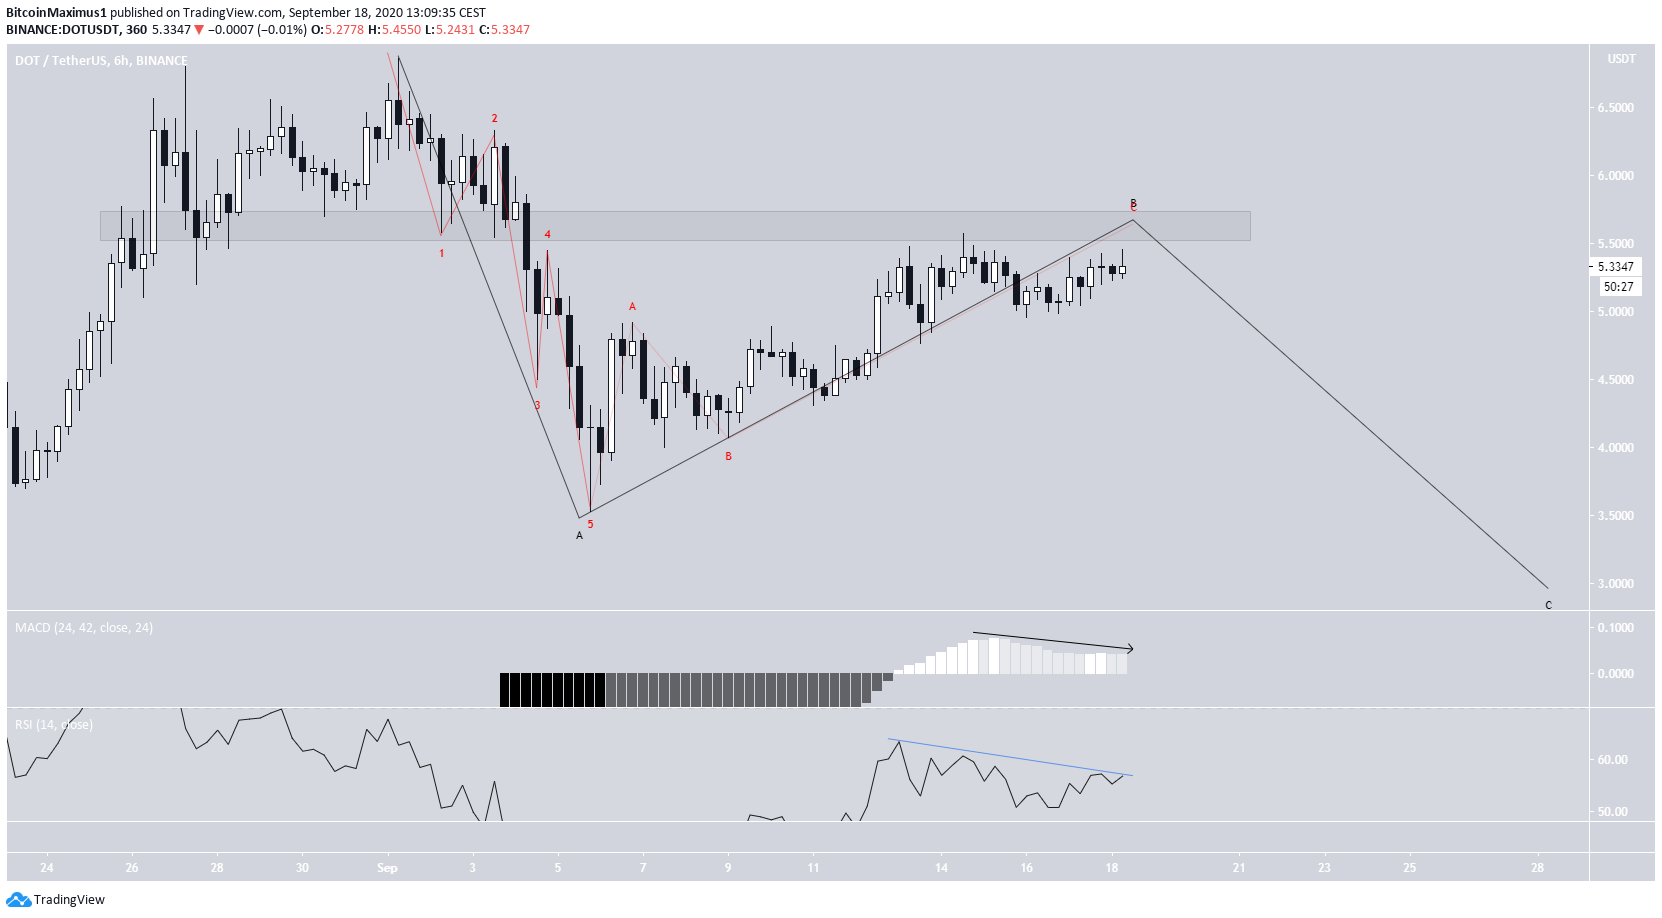
The DOT price has been increasing since it reached a low of $3.55 on Sept 5. Since then, the price has been following an ascending support line. At the time of press, the price was trading very close to the $5.65 resistance area, which is also the 0.618 Fib level of the entire downward move.
Therefore, support and resistance areas are found at $3.55 and $5.65. A breakout from the latter could take the price towards new highs, while a breakdown from the ascending support line would likely cause a fall towards the $3.55 support area.
The wave count indicates that it is more likely that the price is still correcting, completing a B wave inside the $5.65 resistance area. The bearish divergence in the MACD and RSI supports this possibility.
If correct, the price could eventually make another low below $3.14. A breakout above the current resistance area and its re-test as support would invalidate this particular wave count.