

The DIA price has broken out from a descending resistance line, possibly signifying the end of its correction.
Mantra Dao (OM) has formed considerable bullish divergence but has yet to flip a vital resistance area.
DIA
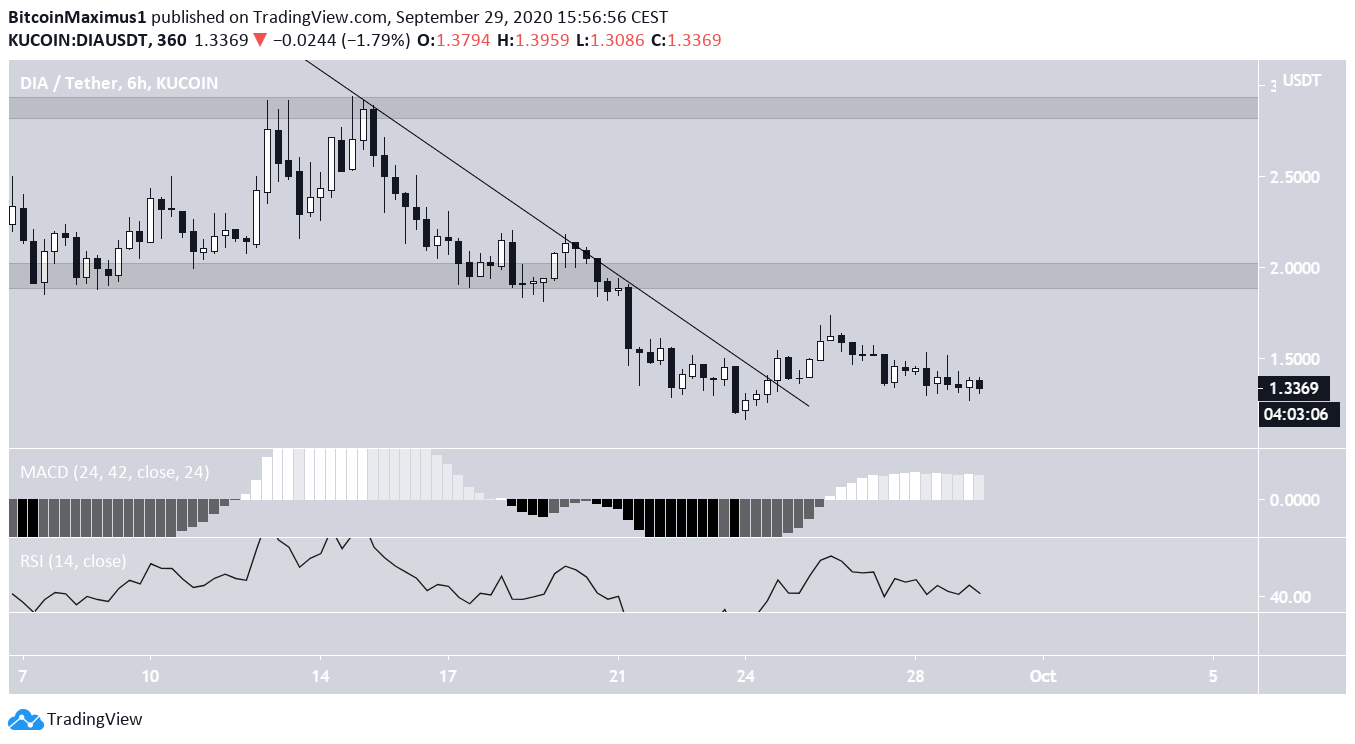
The DIA price has been declining since it reached a high of $4.92 on Sept 2. The fall is continuing, with a low of $1.17 reached on Sept 24. After the low, the price began a small upward move, which caused a breakout above a descending resistance line in place since the previous high. This could indicate that the correction has ended, and DIA will move upwards shortly. If so, the closest resistance areas would be found at $1.95 and $2.85, respectively. These levels created a range throughout Sept 7 – 21, from which the price eventually broke down. A reclaim of the $1.95 area would send the price back inside this range again. However, a fall below the Sept 24 low would take DIA to a new all-time low and bearish price discovery.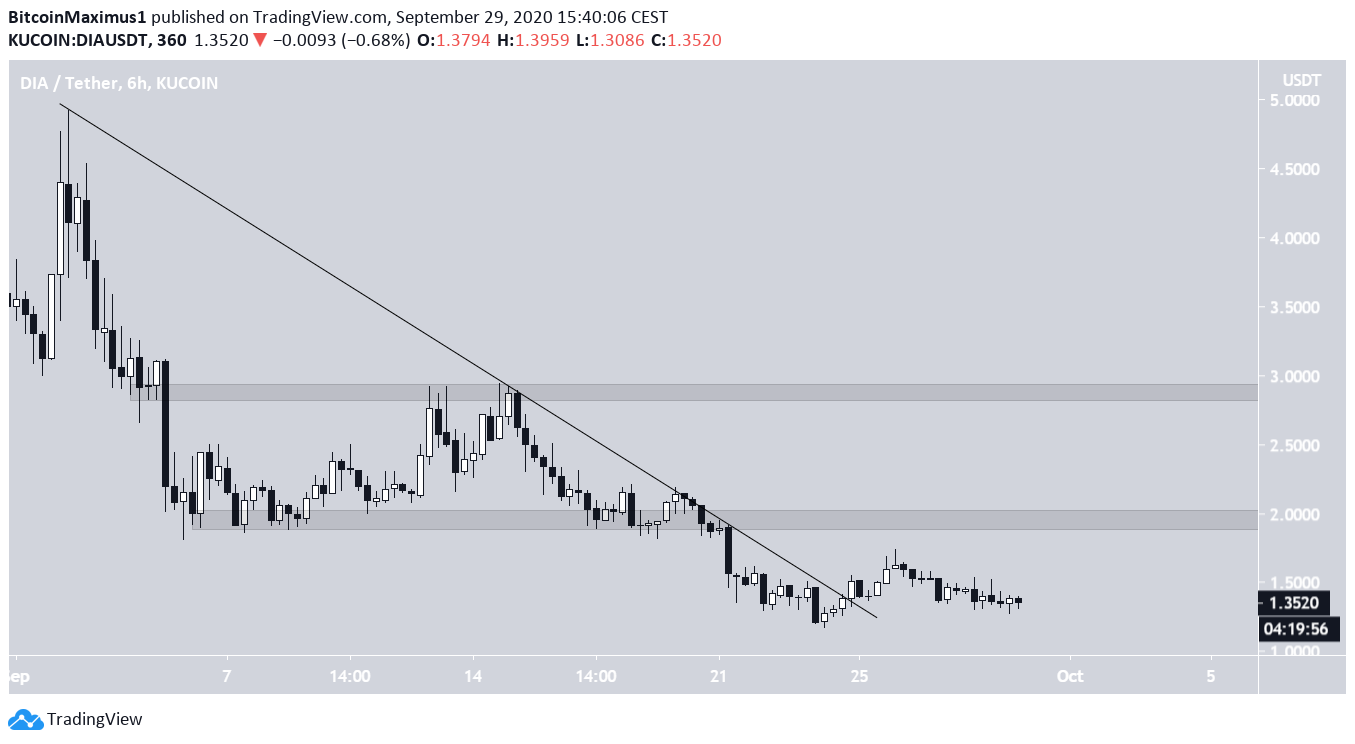
Mantra Dao (OM)
On Sept 15, OM broke down from the $0.26 area, which had previously been acting as support. This eventually took the price to a new all-time low of $0.164, reached on Sept 25. The RSI has generated considerable bullish divergence, and the MACD is moving upwards with strength, both signs that the price will begin an upward move. However, until the price successfully reclaims the $0.26 area, we cannot state with confidence that the trend is bullish.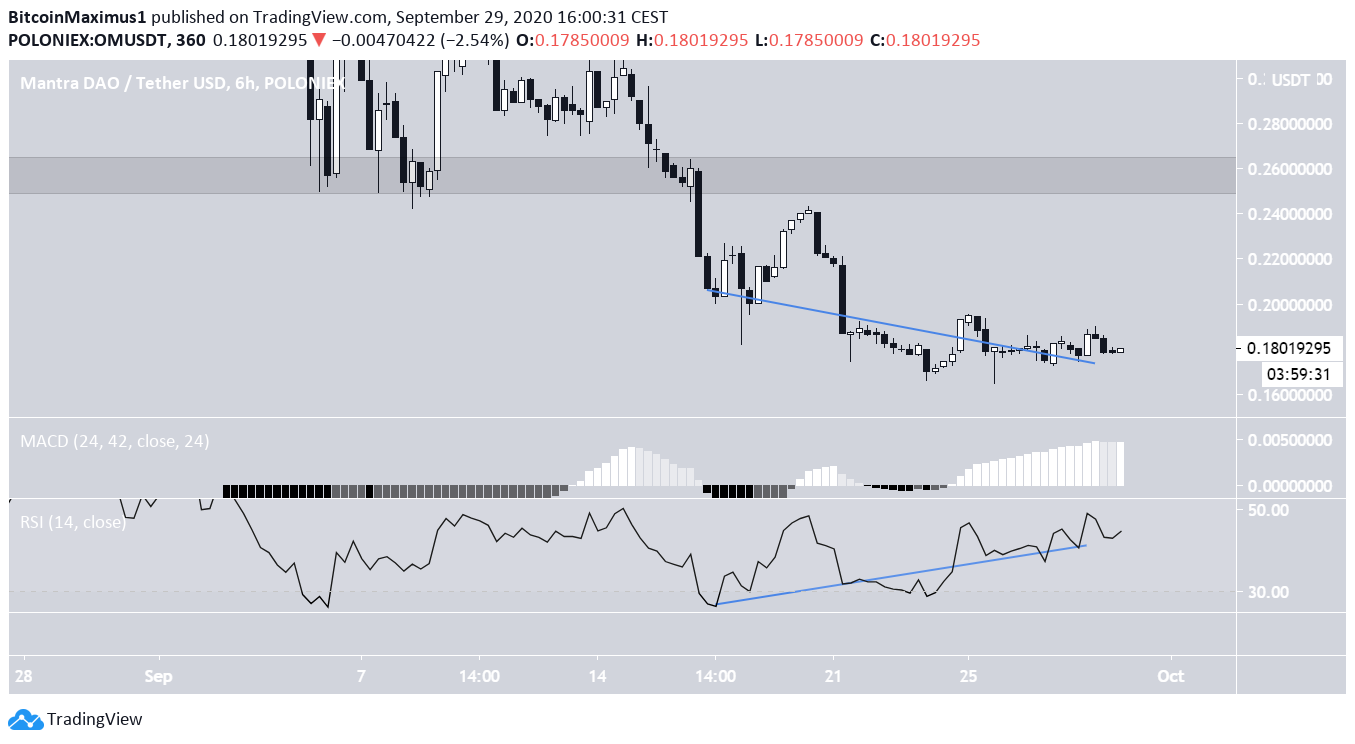
Disclaimer
In line with the Trust Project guidelines, this price analysis article is for informational purposes only and should not be considered financial or investment advice. BeInCrypto is committed to accurate, unbiased reporting, but market conditions are subject to change without notice. Always conduct your own research and consult with a professional before making any financial decisions. Please note that our Terms and Conditions, Privacy Policy, and Disclaimers have been updated.

Valdrin Tahiri
Valdrin discovered cryptocurrencies while he was getting his MSc in Financial Markets from the Barcelona School of Economics. Shortly after graduating, he began writing for several different cryptocurrency related websites as a freelancer before eventually taking on the role of BeInCrypto's Senior Analyst.
(I do not have a discord and will not contact you first there. Beware of scammers)
READ FULL BIO
Sponsored
Sponsored