


The prices of both ICON (ICX) and Hedera Hashgraph (HBAR) have been correcting over the past two months. While both have halted their decline, ICX is showing stronger signs of reversal.
ICON (ICX)
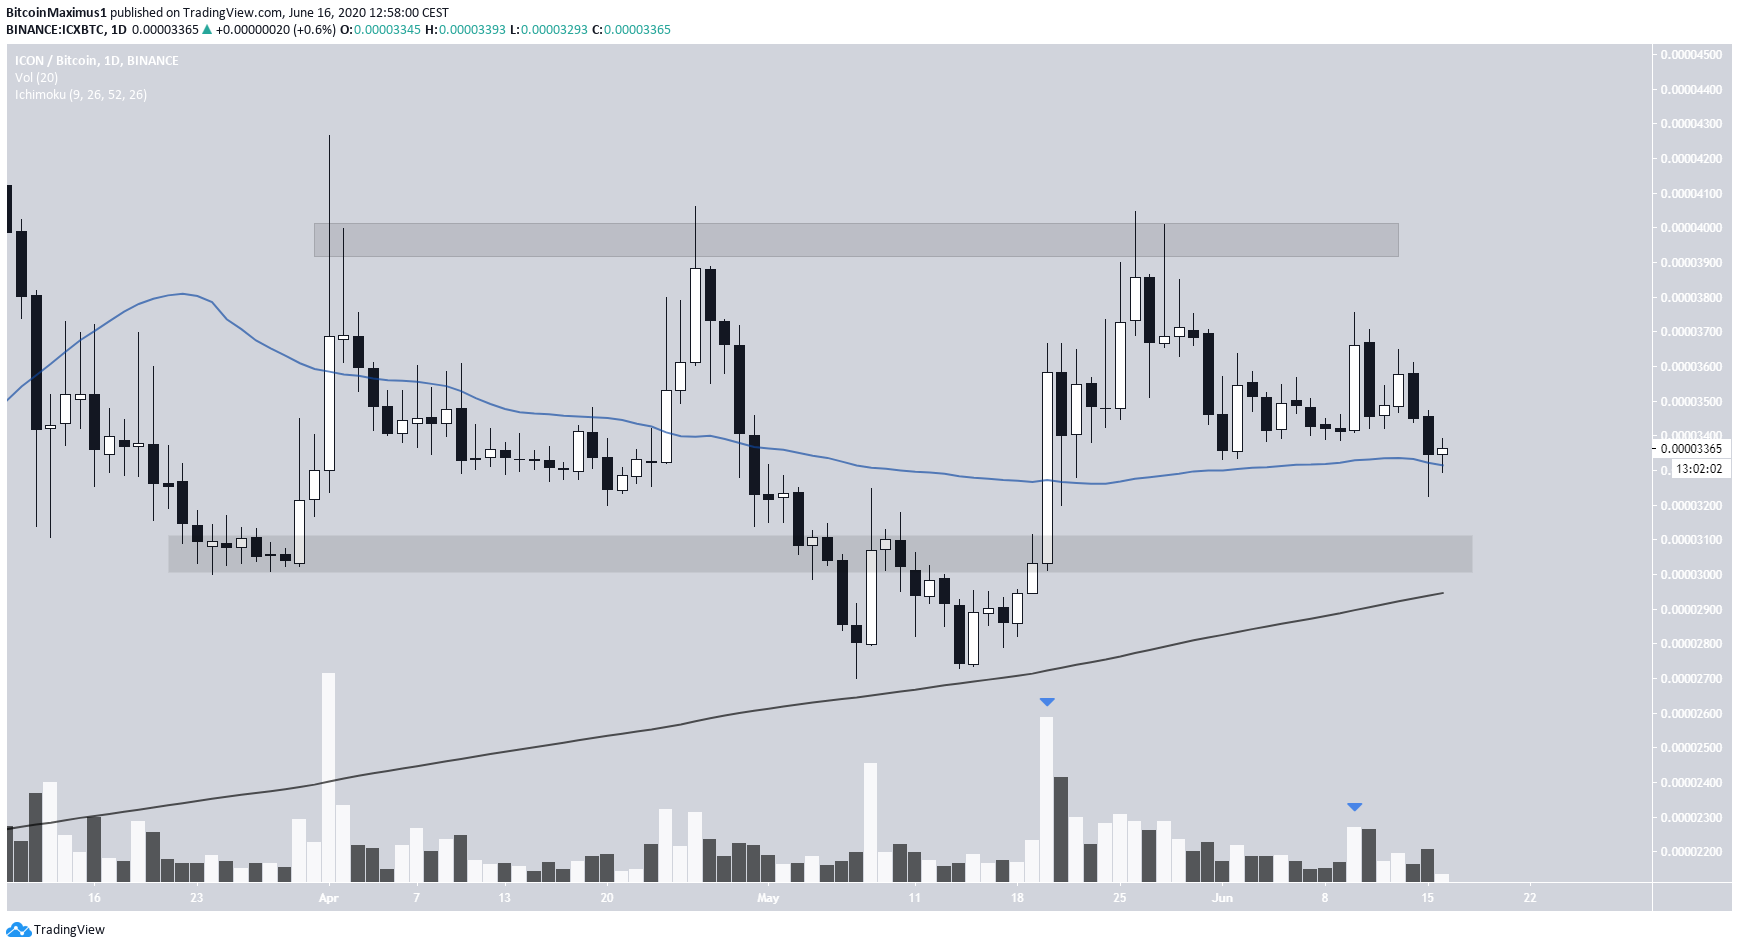
The ICX price has been declining since April 1, when it reached a high of 4265 satoshis. The decline continued until May 14, when the price bounced on the 200-day moving average (MA).
Since then, ICX has been trading in a range with resistance and support at 4000 and 3050 satoshis, respectively. At the time of writing, the price has found support above the 50-day MA and is only slightly above the 3050 satoshi support area.
While volume has been slightly higher on the weekly candlestick, price action remains uninteresting. Therefore, the outlook is neutral, slightly leaning on bullish, since the price is trading above both MAs.
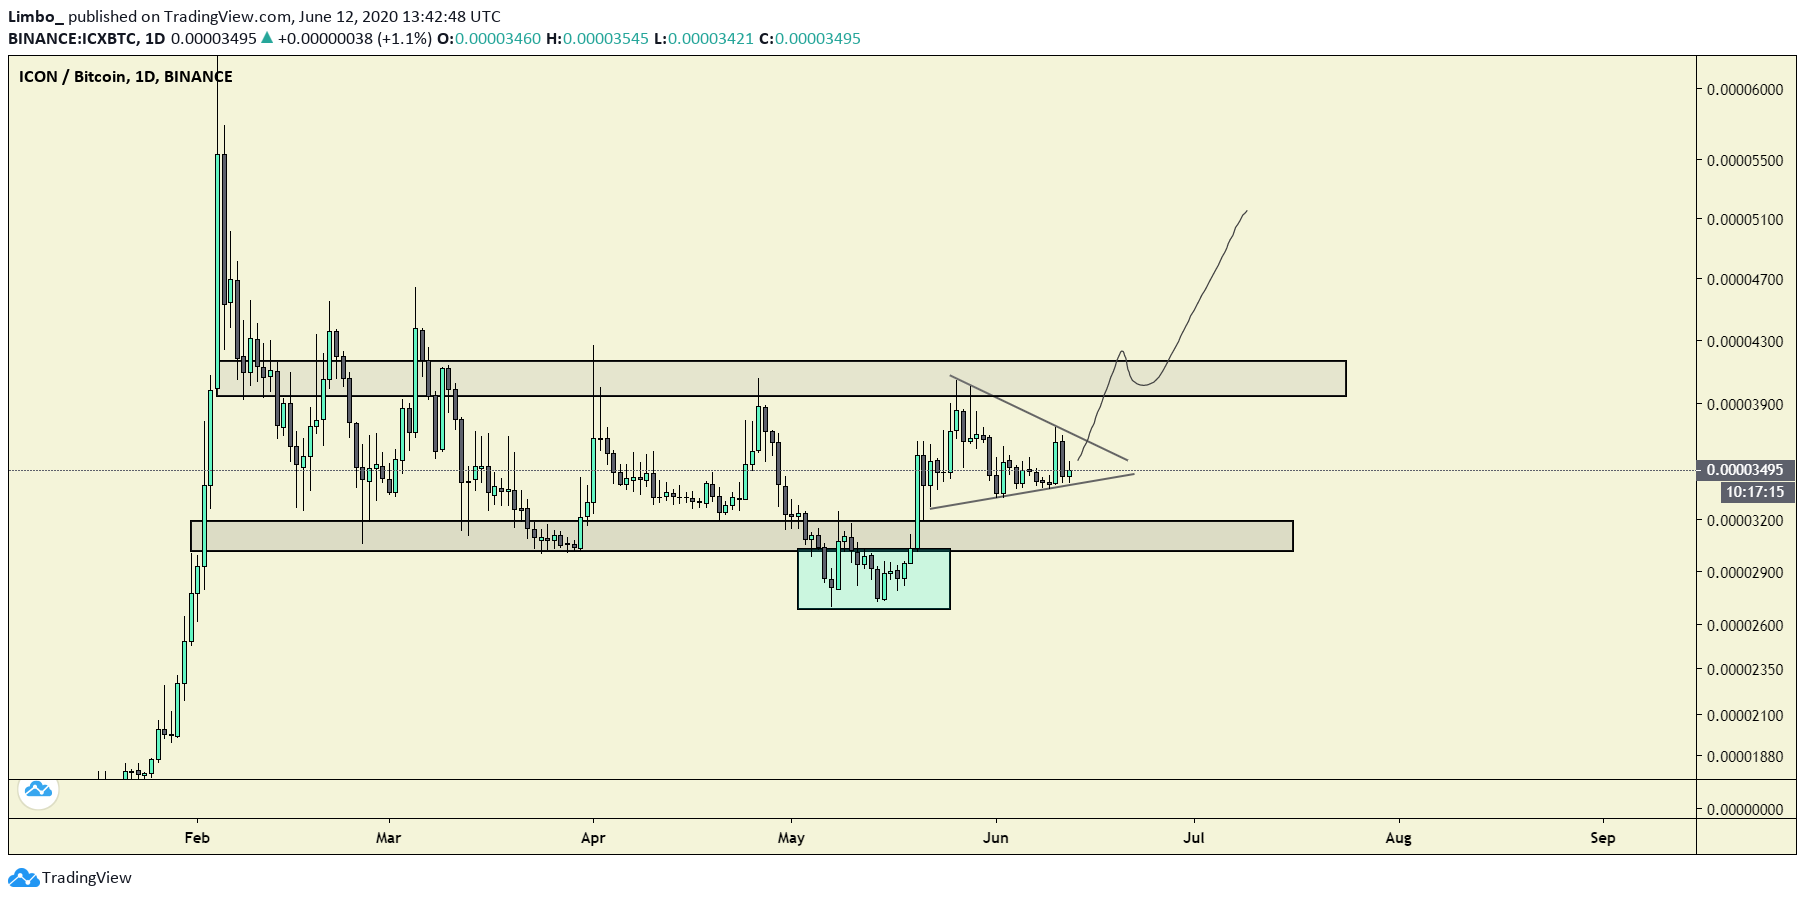
Cryptocurrency trader @CryptoLimbo_ outlined the same resistance and support levels and explained that he believes the price will break out above this resistance area:
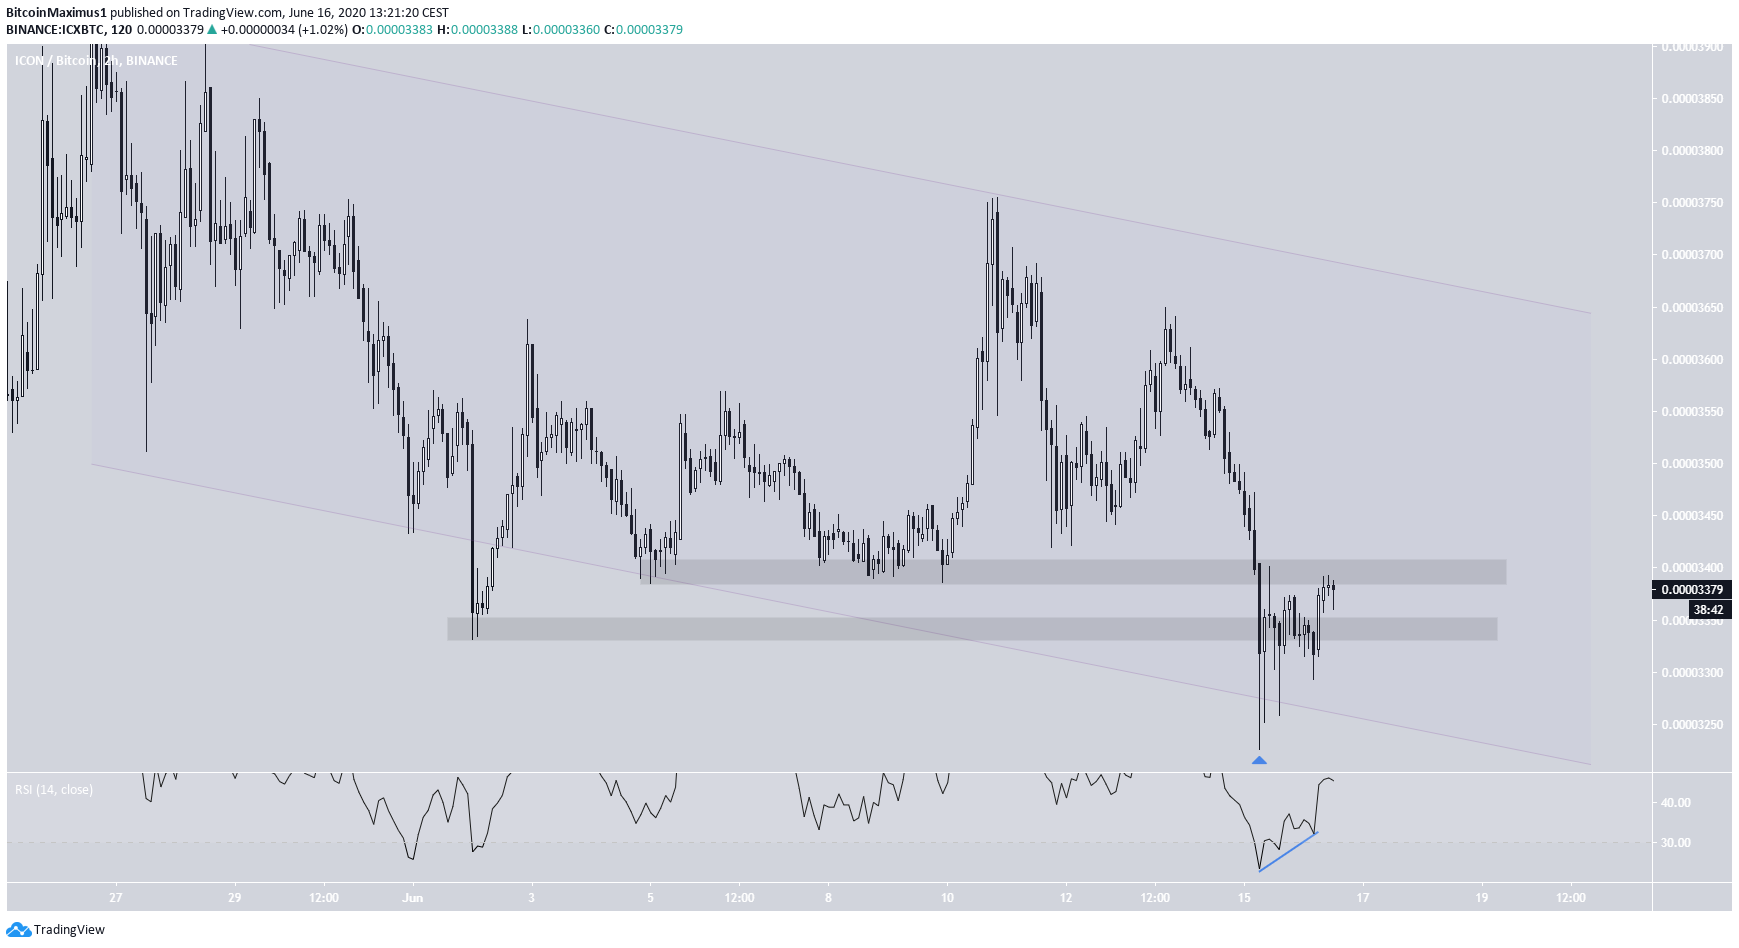
In the short-term, the price seems to be trading inside a parallel, descending channel. There are two significant price levels here, at 3340 and 3400 satoshis.
The price fell above the former, only to create a long lower wick, forming bullish divergence and reclaiming the area as support. If the price holds the 3400 satoshi area, it is likely to continue moving upwards towards the resistance line of the channel, and eventually, the 4000 satoshi resistance area.
Hedera Hashgraph (HBAR)
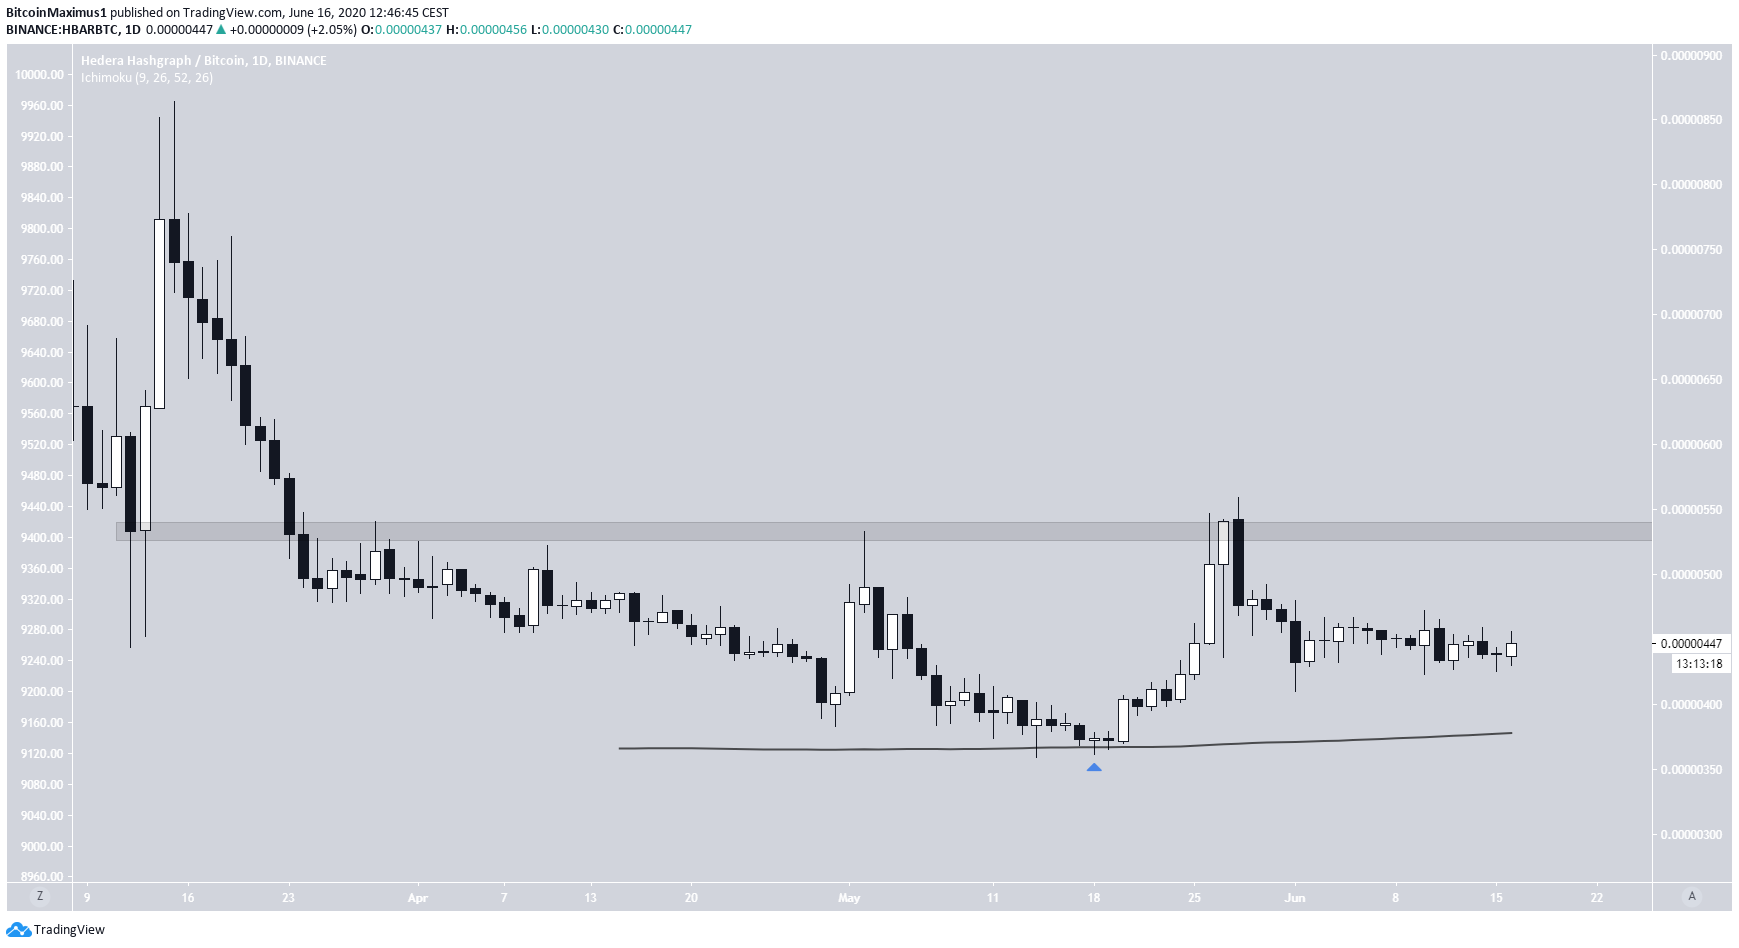
The price of HBAR has been declining since reaching a high of 864 satoshis on March 16. Since then, it has made several attempts to bounce but has been rejected three times by the 540 satoshi resistance area.
Since there are no resistance lines, a breakout from here would indicate that the correction has ended, and the price will likely move towards the 864 satoshi high.
The short-term chart shows that volume has been minimal since the final rejection at the 540 area on May 29. In addition, the price seems to be trading inside a descending parallel channel.
A breakout above this channel would indicate that the price is moving upwards. While the price has reclaimed the 200-hour MA as support, there are no other signs that suggest a breakout will occur.
Therefore, the price may continue trading inside this channel in the near future before eventually breaking out.


