Siacoin (SC) has been increasing rapidly over the past three weeks, and has reached a crucial resistance area at 44 satoshis. A breakout above this would be a sign that the price has begun a long-term bullish trend.
Lisk (LSK), on the other hand, has broken out from both a long and a short-term descending resistance line.
Siacoin (SC)
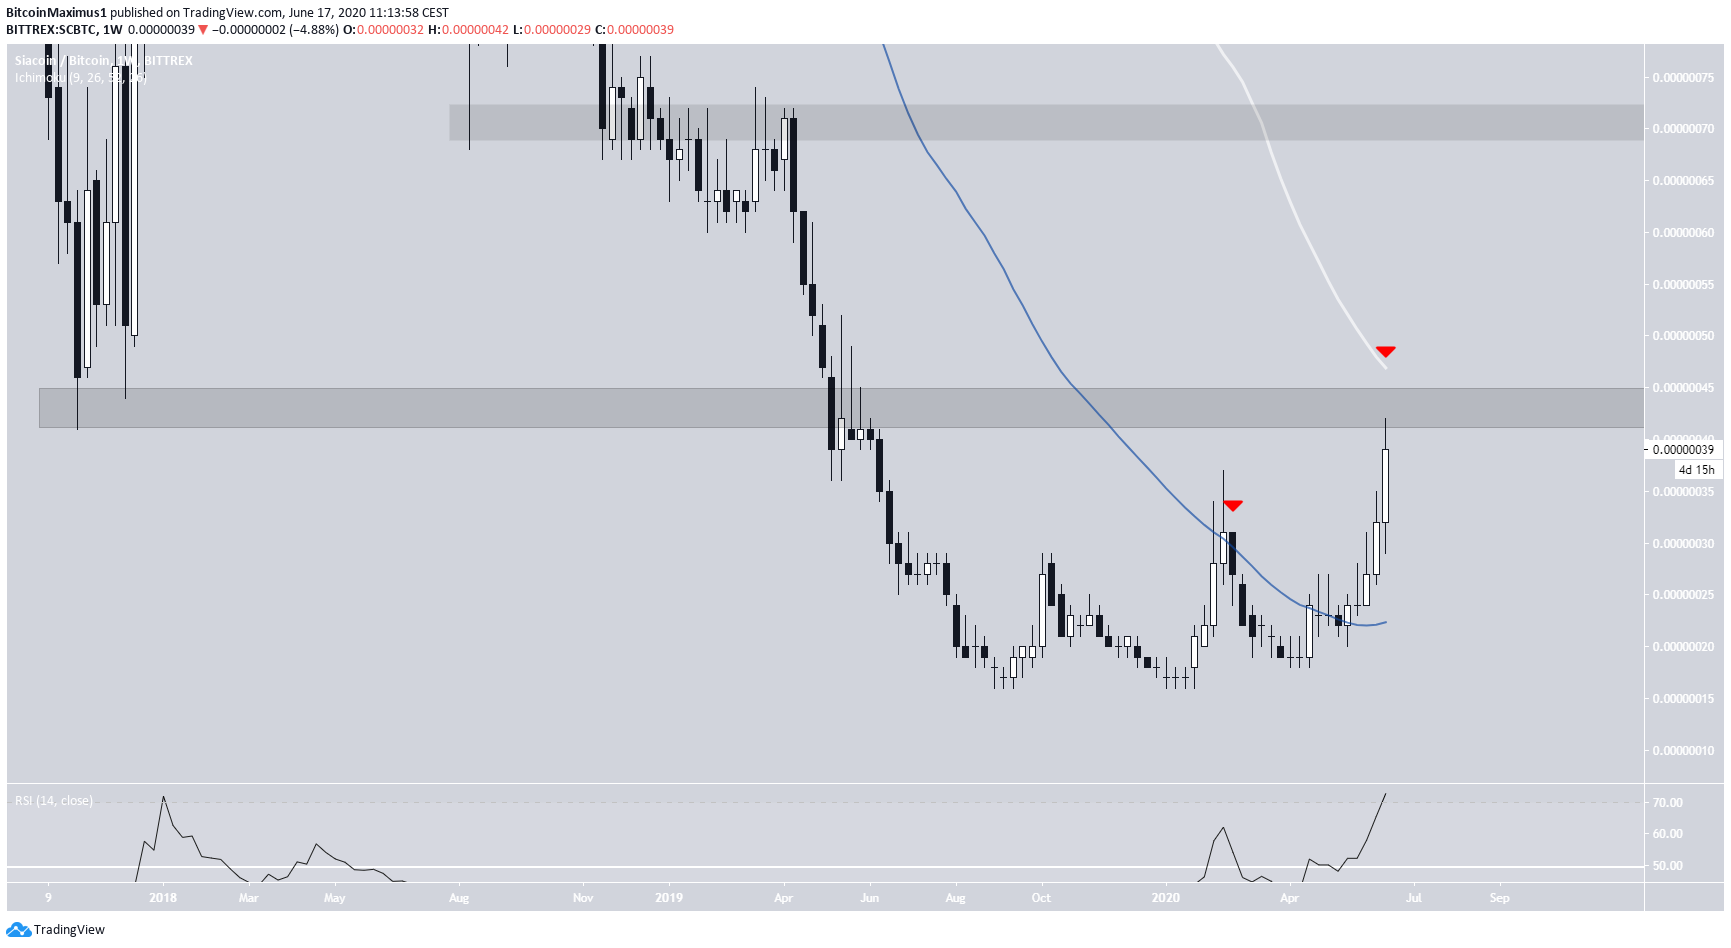
The weekly chart shows that SC has likely begun a long-term upward trend. This was confirmed in the beginning of May, when the price moved above its 50-week moving average (MA) and the weekly RSI moved above 50.
However, the price has reached a crucial resistance area at 44 satoshis, which is strengthened by the 100-week MA. A breakout above would likely trigger a rapid upward move that takes the price all the way to 70 satoshis.
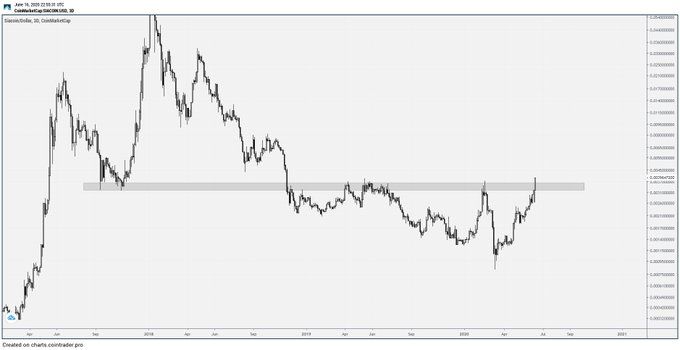
Cryptocurrency trader @DTCCryptotrading outlined the importance of this resistance area, stating that a breakout above could initiate a rapid rise for the SC price.
Sorry for the SC spam but, SC looks like it’s about to close above the most important zone in the history of SC. Not alot of resistance above, this looks like it’s going higher
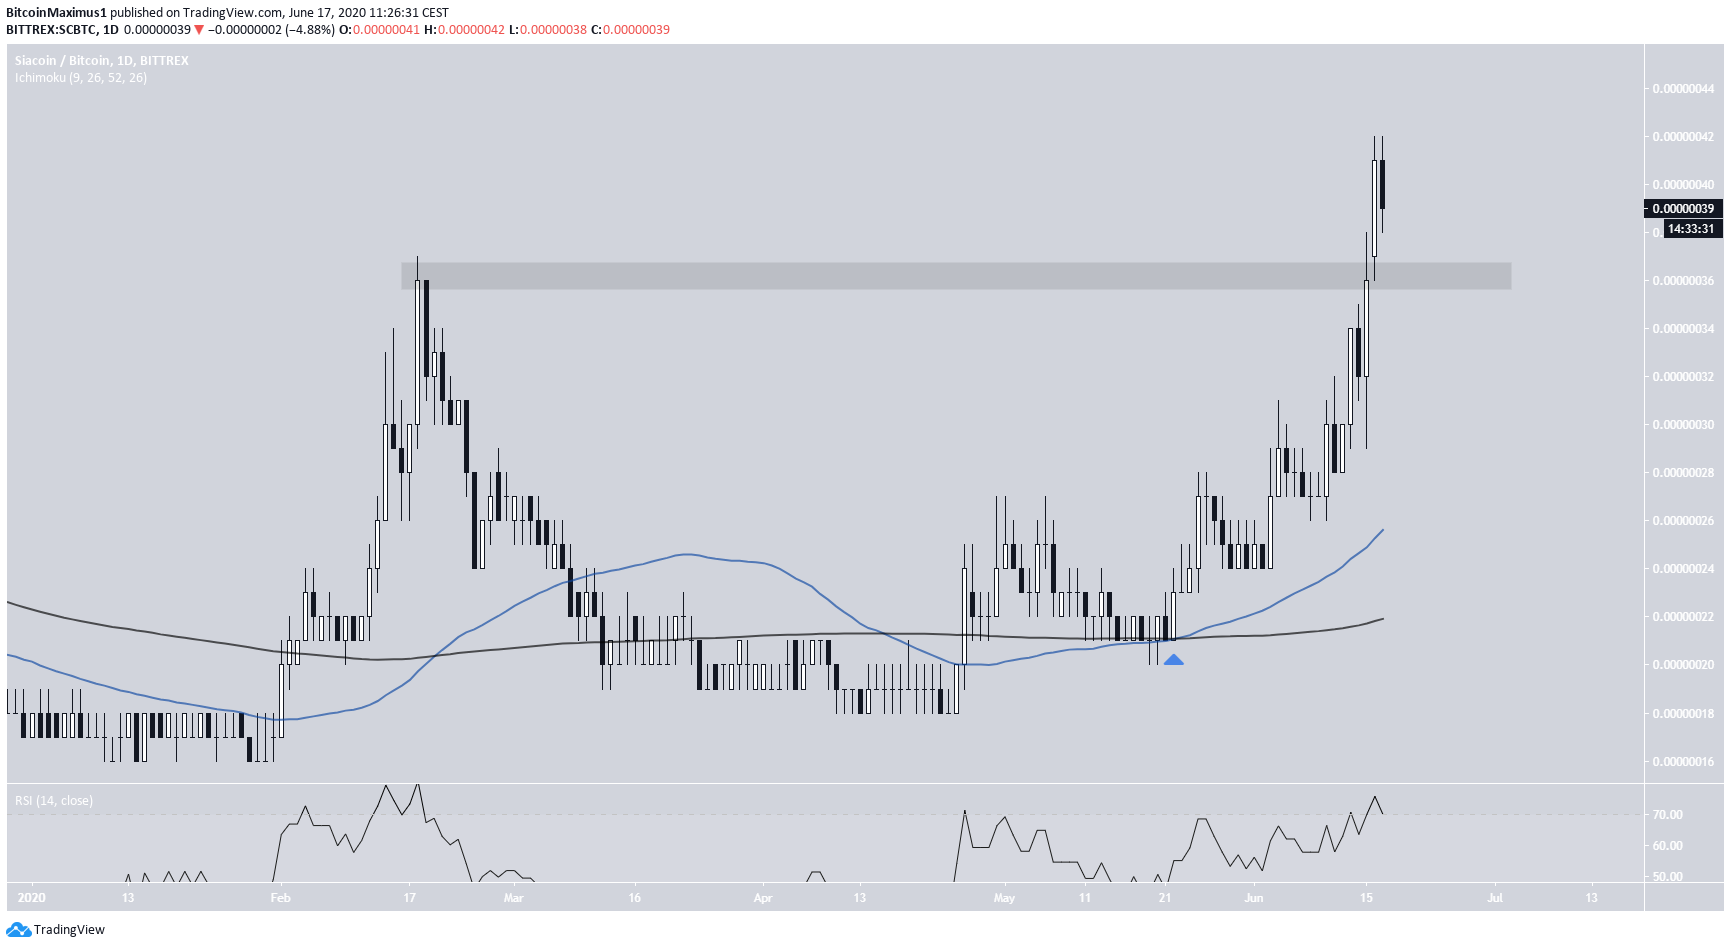
On the daily chart, we can see that the price has already moved above the February high at 36 satoshis. In addition, a golden cross has taken place on the daily time-frame, and there is no bearish divergence on the RSI.
Therefore, there is no reason to believe that SC will not break out above the long-term resistance area at 44 satoshis.
Lisk (LSK)
LSK had been following a descending resistance line since February 10. However, the price broke out from it on July 4. It has been retracing ever since, but has seemingly found support above its 200-day MA and begun yet another upward move.
The closest resistance areas are found at 14,000 and 16,600 satoshis, respectively.
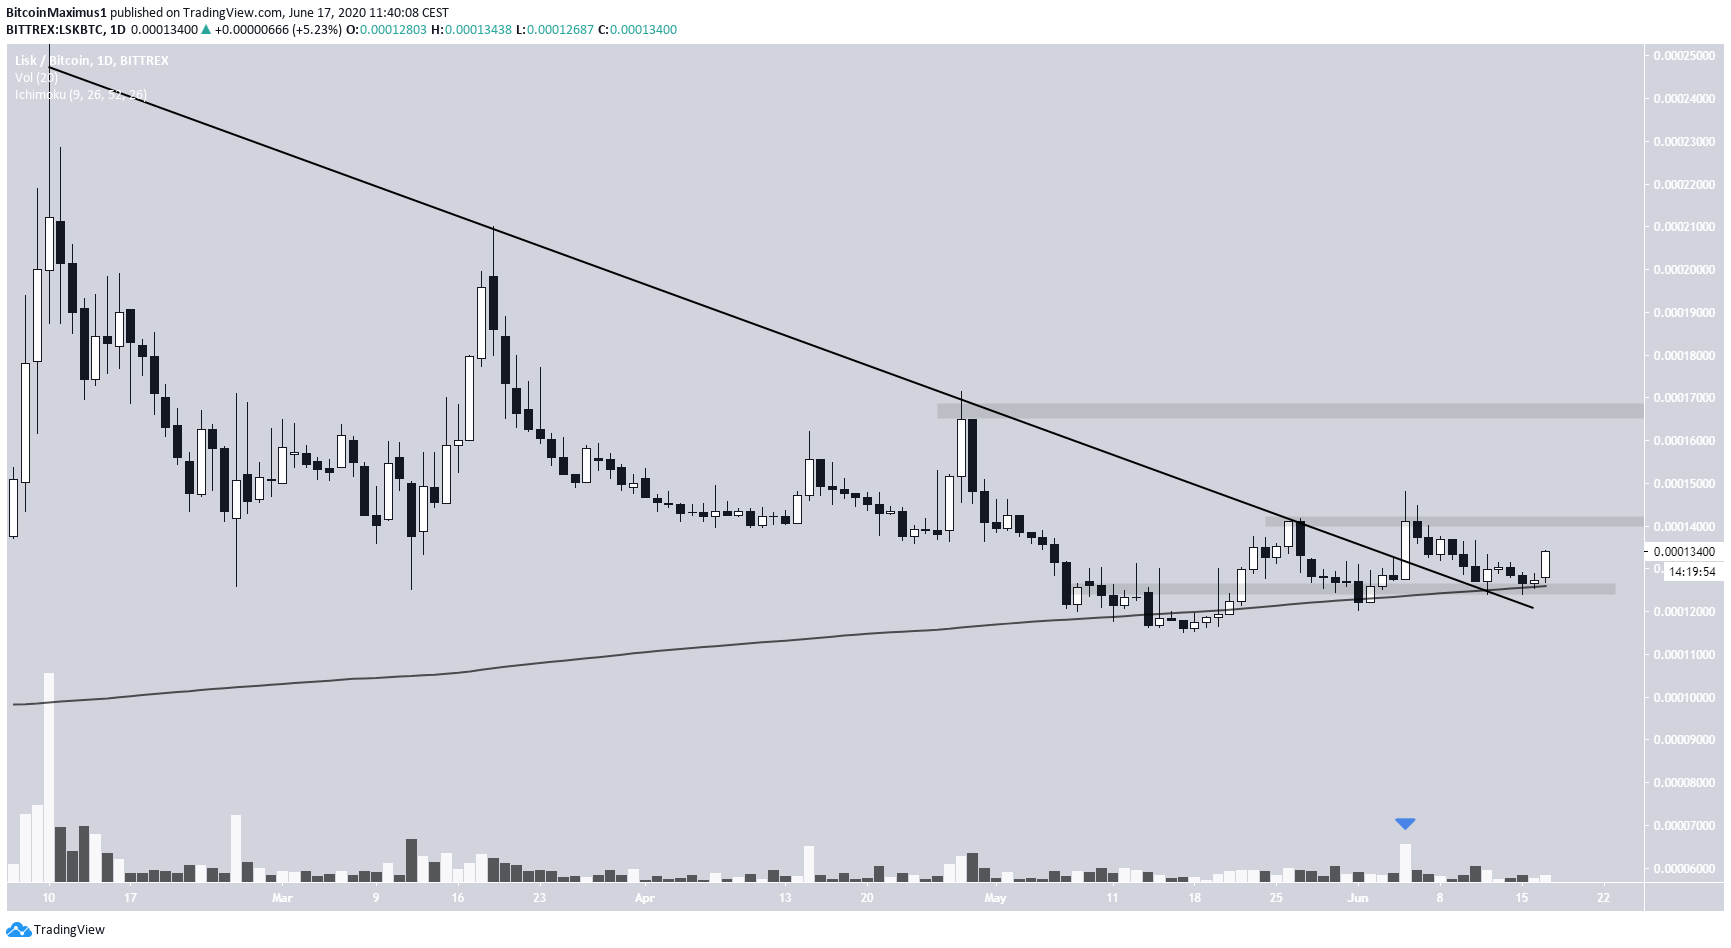
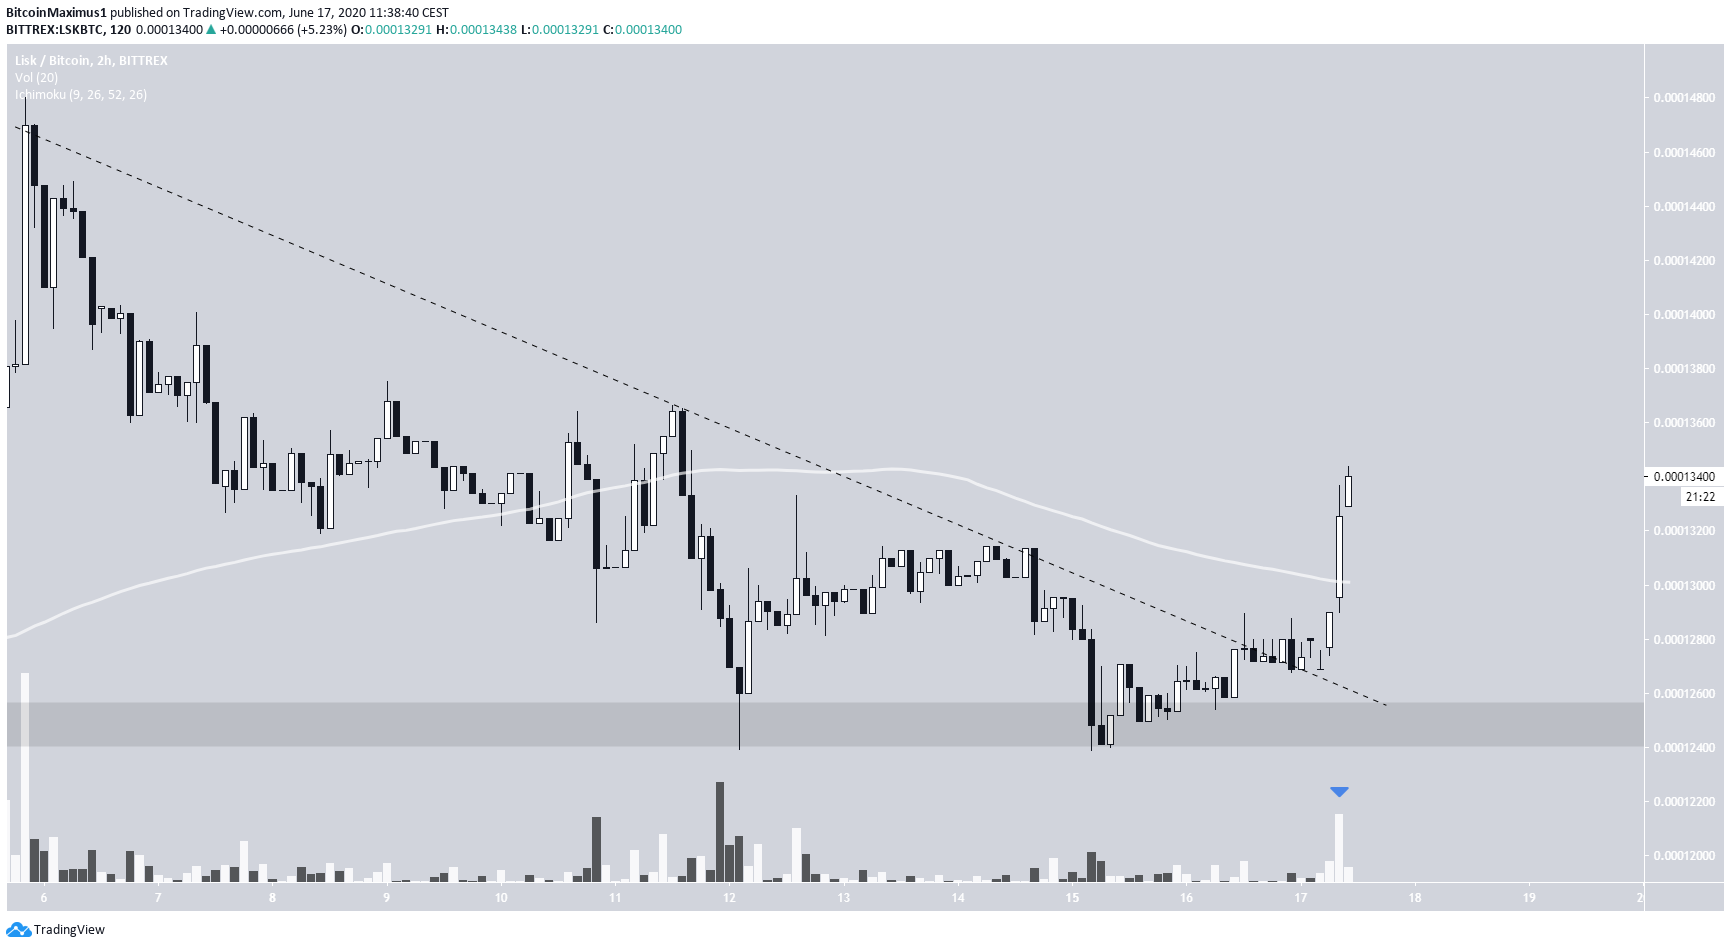
The hourly chart reveals that LSK has also broken out from a shorter-term descending resistance line with considerable volume. This suggests the price is likely to continue moving upwards towards the resistance areas previously outlined.
In addition, there is a support area at 12,500 satoshis. As long as the price stays above it, the move can be considered bullish.