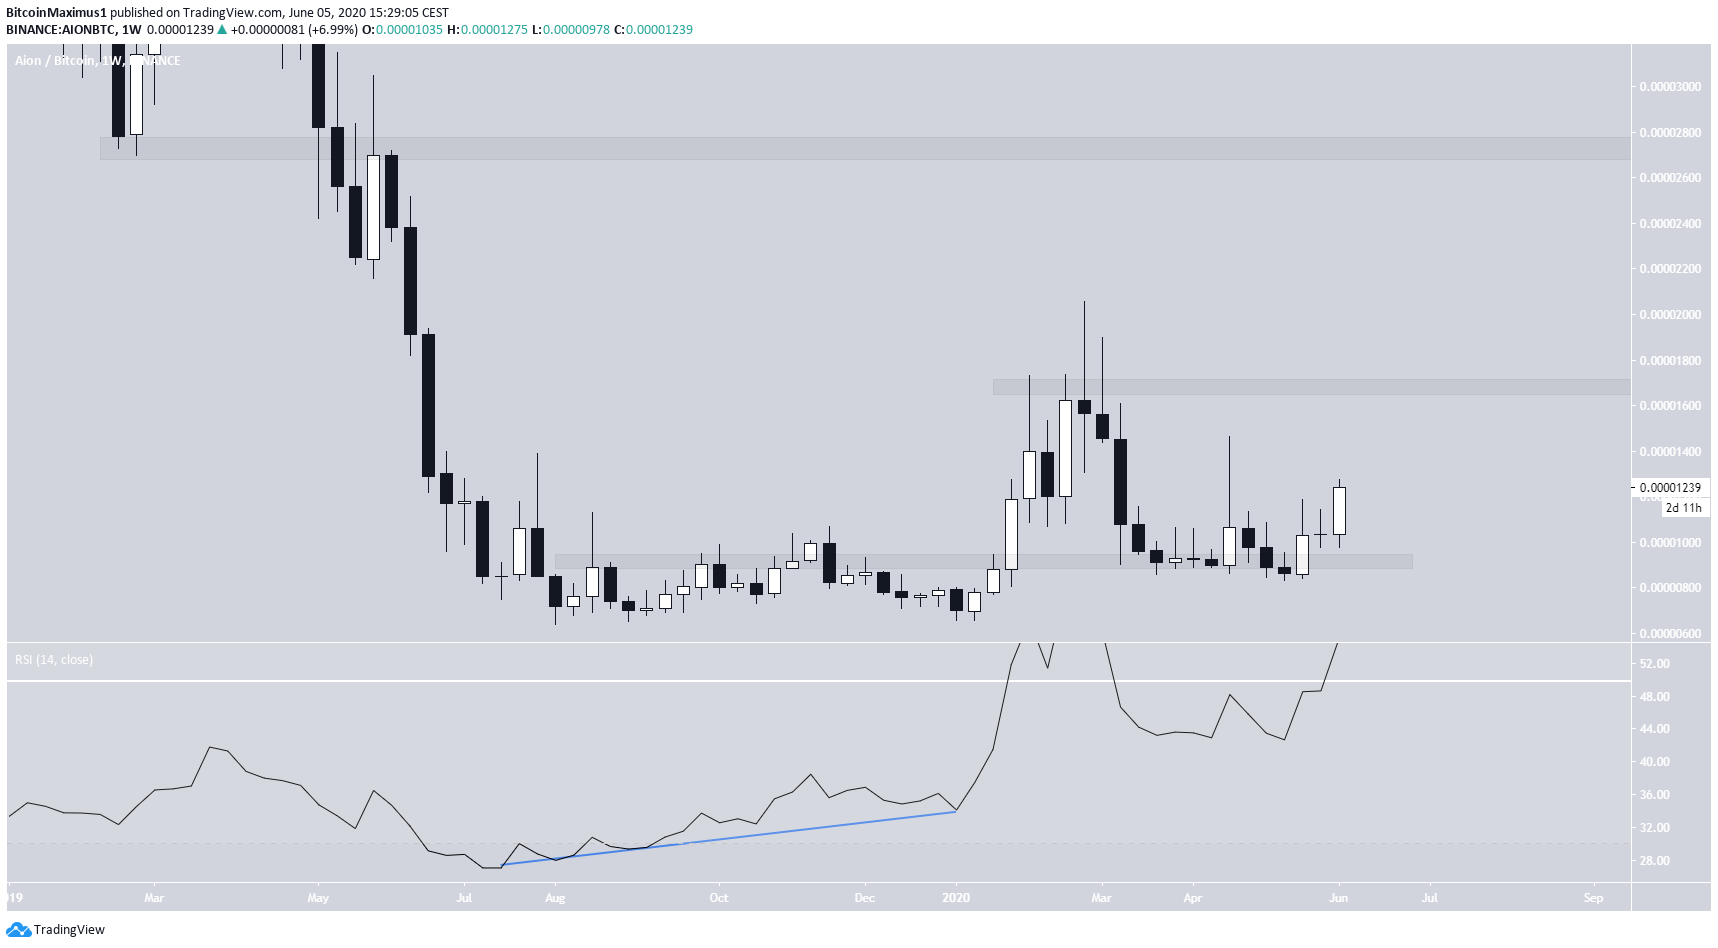
Aion (AION)
In the period from July – December 2019, the AION price was trading at an all-time low near 700 satoshis. However, the price created a double bottom alongside bullish divergence on the weekly RSI.
This preceded a rapid recovery that eventually took the price to a high of 2055 satoshis on February 22. The price has since fallen.
However, the price bounced at the previous resistance area of 900 satoshis, validating it as immediate support. Furthermore, the weekly RSI crossed above 50, a sign that the price is in a bullish trend.
On the daily chart, AION has broken out from a descending resistance line, in place since February 21. In addition, the 50 and 200-day moving averages (MA) have made bullish crosses, another confirmation that the upward trend has begun.
If the price continues to move upwards, which is looking likely, the closest resistance levels are found at 1550 and 1700 satoshis, respectively.
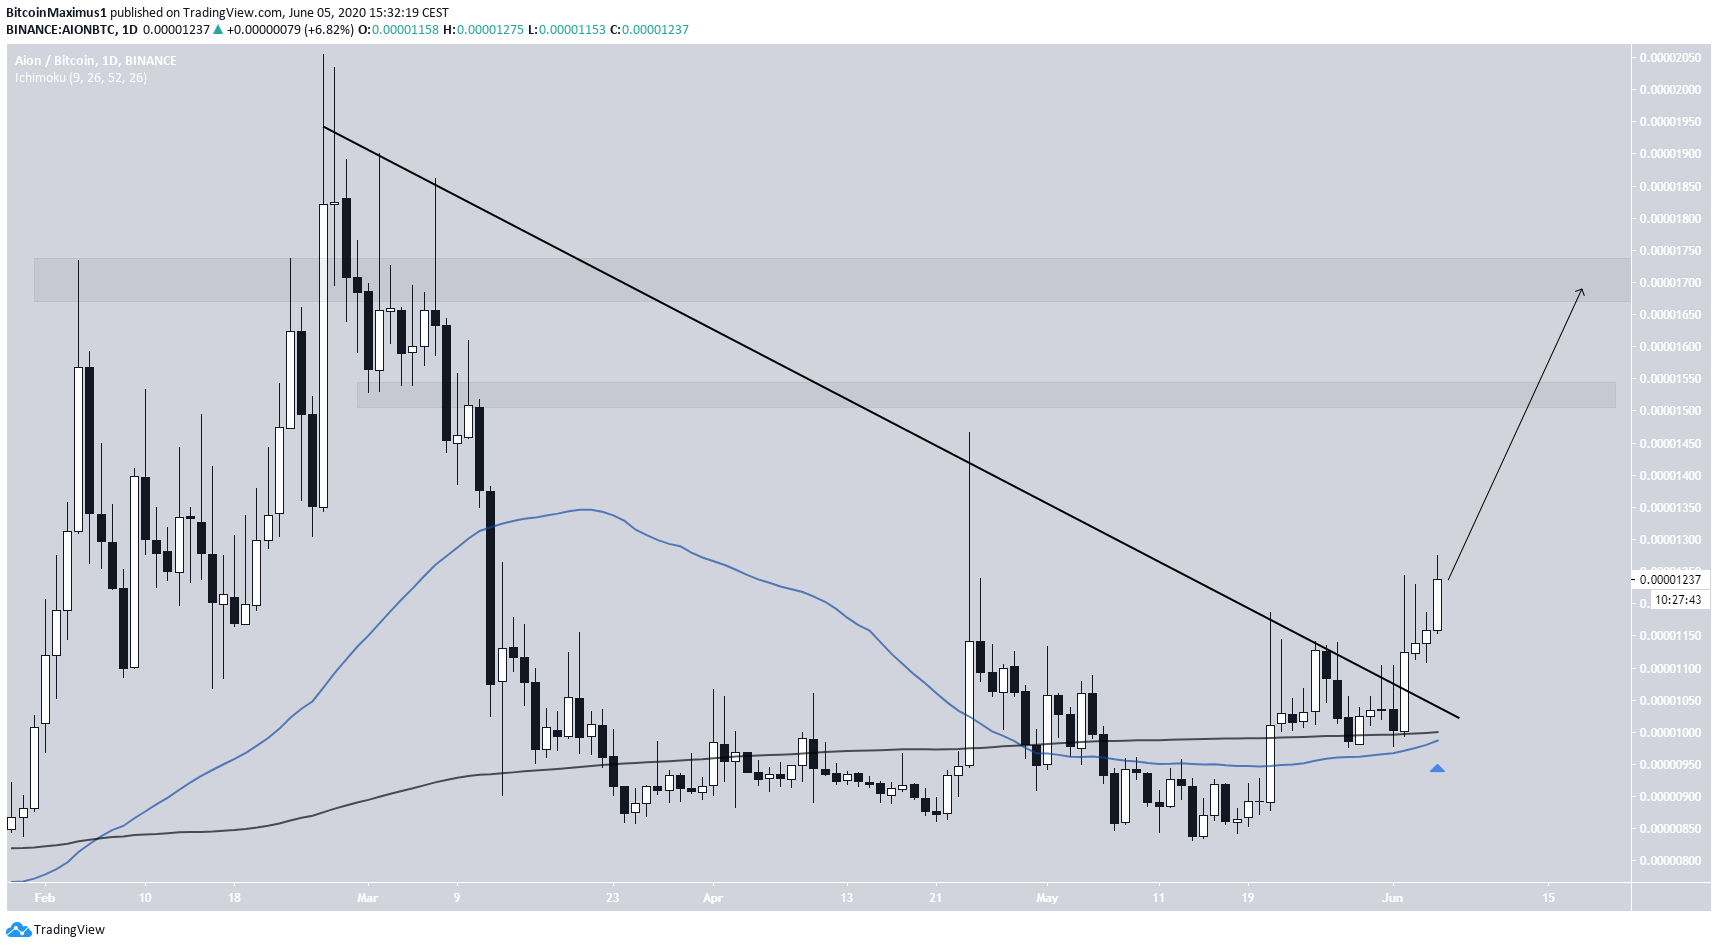
Technical analyst @Pentosh1 outlined a similar chart and gave a target of 1550 satoshis for the potential move, fitting with our analysis.
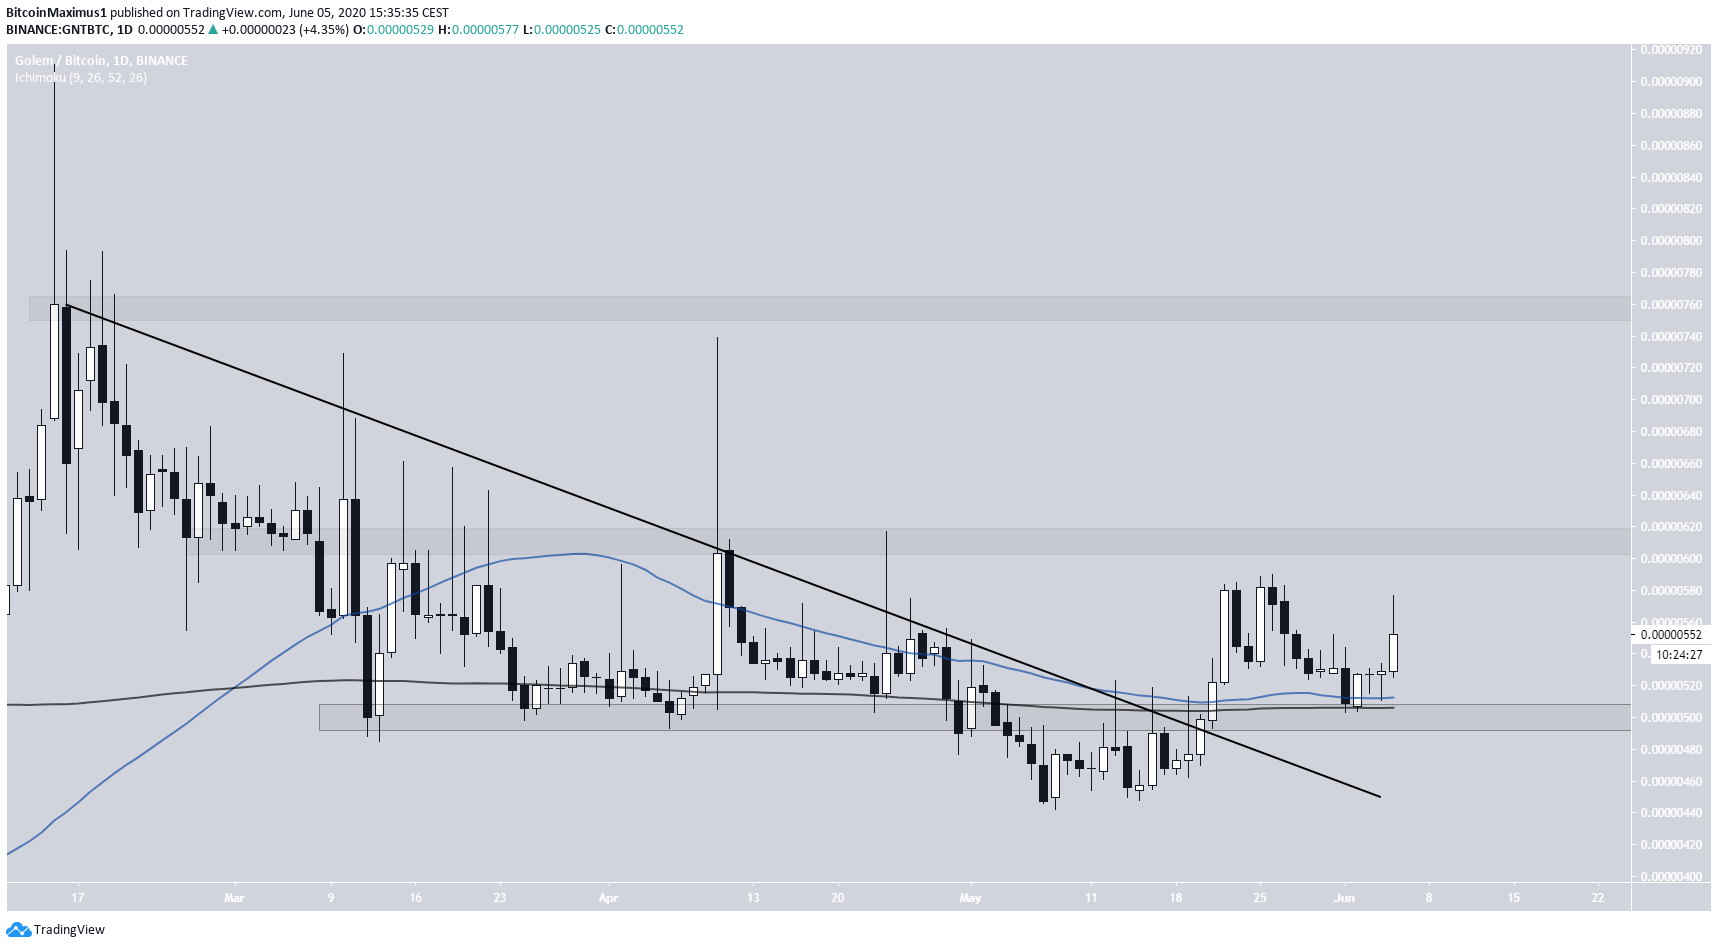
Golem (GNT)
Another coin that shows similar movement is GNT. It reached an all-time low of 328 satoshis on January 2020, combined with a bullish divergence on the weekly RSI.
Subsequently, the price began a rapid move upwards on large volume that took it to a high of 911 satoshis. The price has been decreasing since but found support above 450 satoshis, the previous resistance area.
Also, the weekly RSI is in the process of moving above 50, which would confirm the bullish trend.
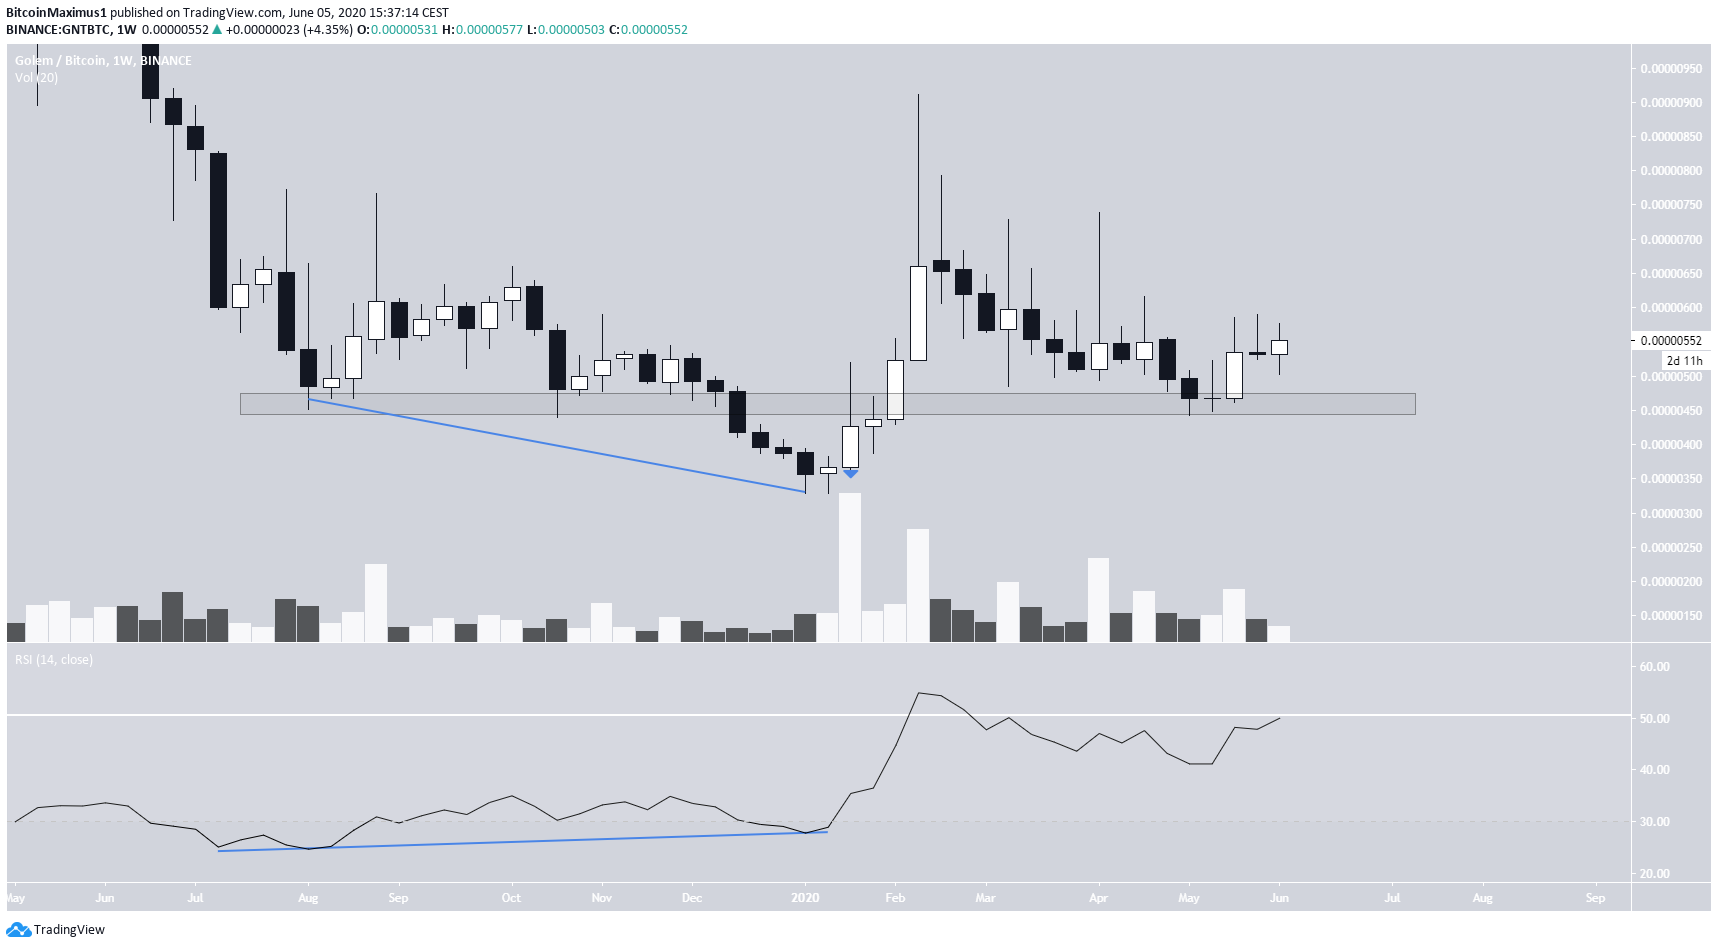
Similar to AION, GNT broke out from a long-term descending trend line on May 22. Shortly after that, the price validated the 50 and 200-day moving averages (MA) as support before continuing its upward momentum.
If the price continues to rally, which seems likely, the closest resistance areas are found at 600 and 750 satoshis, respectively.