


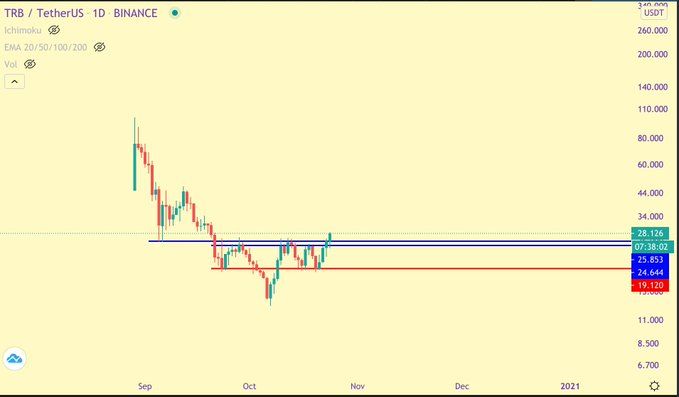
The Tellor (TRB) price has broken out above an important resistance level at $27, paving the way for a rally that could take it all the way to $47.
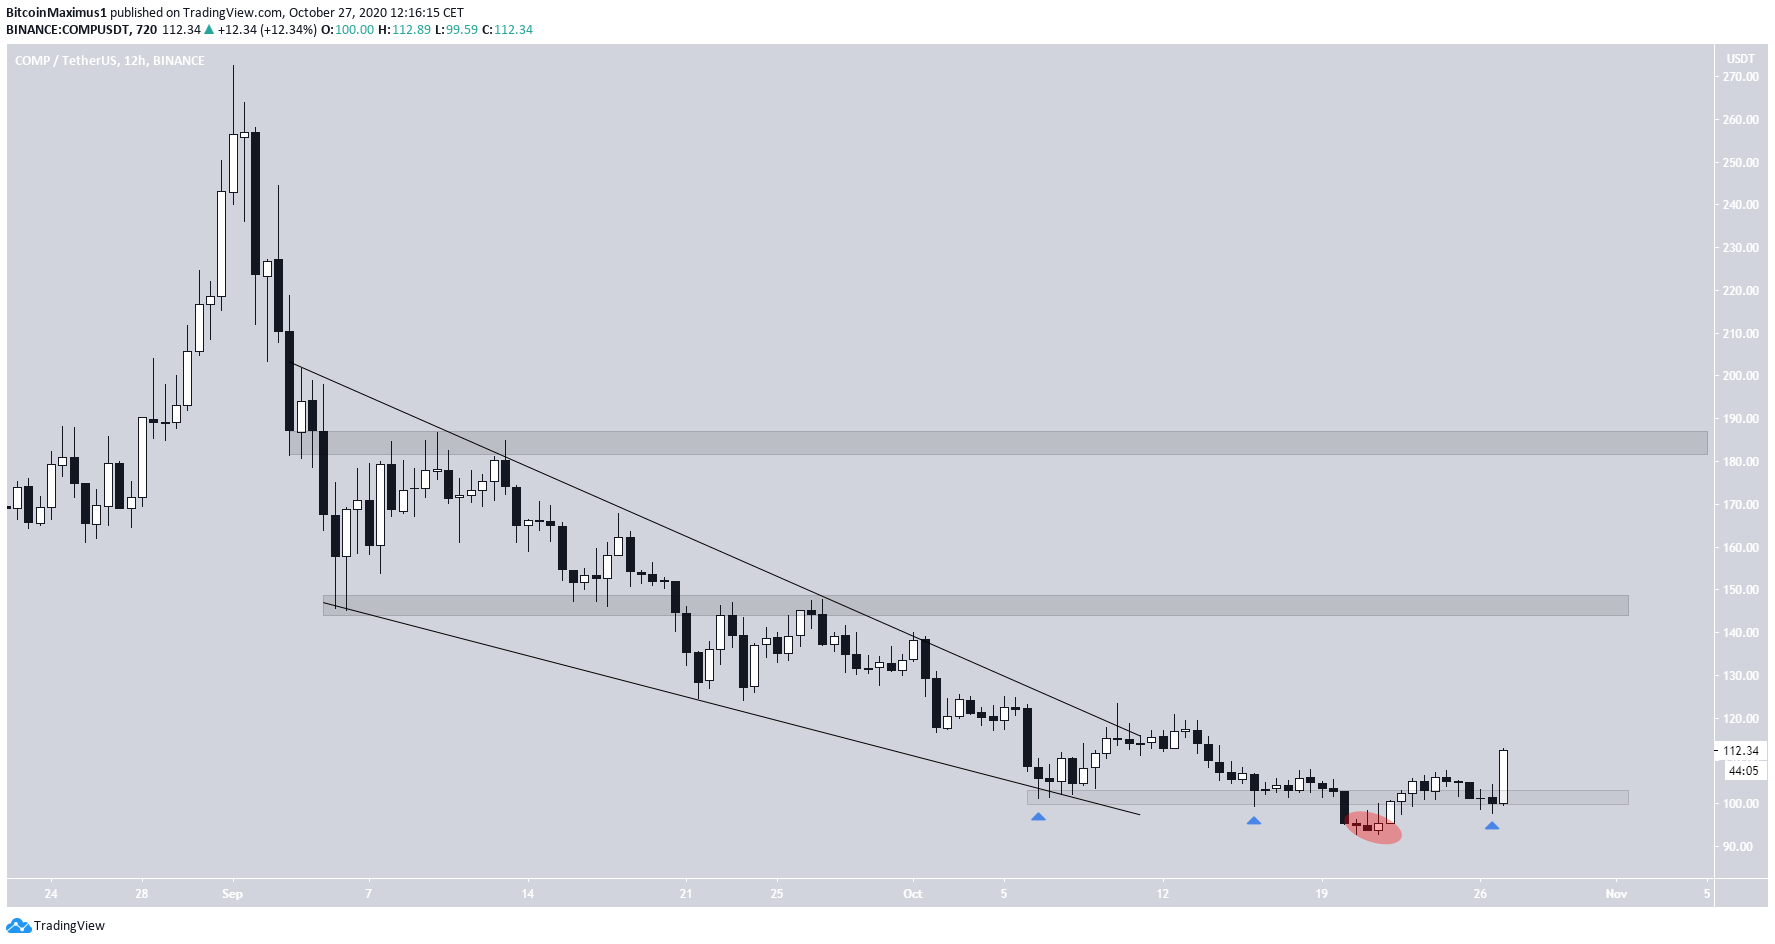
The Compound (COMP) price has broken out from a descending wedge and reclaimed the $102 support area.
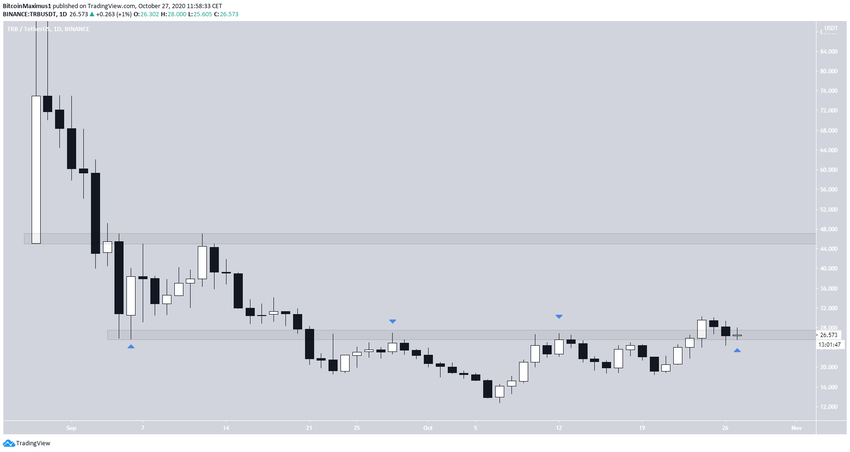
TRB – Breakout Above Resistance
On Sept 21, the TRB price fell below the $26 area and proceeded to reach a low of $12.78 on Oct 7. The $26 area then turned to resistance, rejecting the price twice.
However, on Oct 25, the price finally moved above this level and is currently validating it as support.
If it does so successfully, it could move upwards towards the next resistance area, which is found at $47.
Cryptocurrency trader @TheEWguy outlined a TRB chart, stating that the price has moved above an important resistance level at $25, indicating that the upward move’s continuation is now likely due to a lack of overhead resistance.
If the price continues upwards, as expected, the closest resistance area is previously outlined at $47.
COMP – Reclaim of Lost Support
The COMP price has been falling since it reached a high of $272.61 on Sept 1. The decline took the shape of a descending wedge, from which the price broke out on Oct 10. Despite the breakout, COMP failed to initiate a sustained upward move and resumed its decline until a low of $92.72 was reached.
However, the price has reclaimed the $102 area, which previously acted as support, making the previously mentioned low a deviation below the support area.
This occurrence often leads to a significant move in the other direction. If so, COMP could rally towards the closest resistance levels, which are found at $147 and $186.
For BeInCrypto’s previous Bitcoin analysis, click here!
Disclaimer: Cryptocurrency trading carries a high level of risk and may not be suitable for all investors. The views expressed in this article do not reflect those of BeInCrypto.


