Both Kyber Network (KNC) and Tomochain (TOMO) have broken out from long-term resistance areas. After a possible decline that first validates these areas as support, both should continue moving upwards.
Kyber Network (KNC)
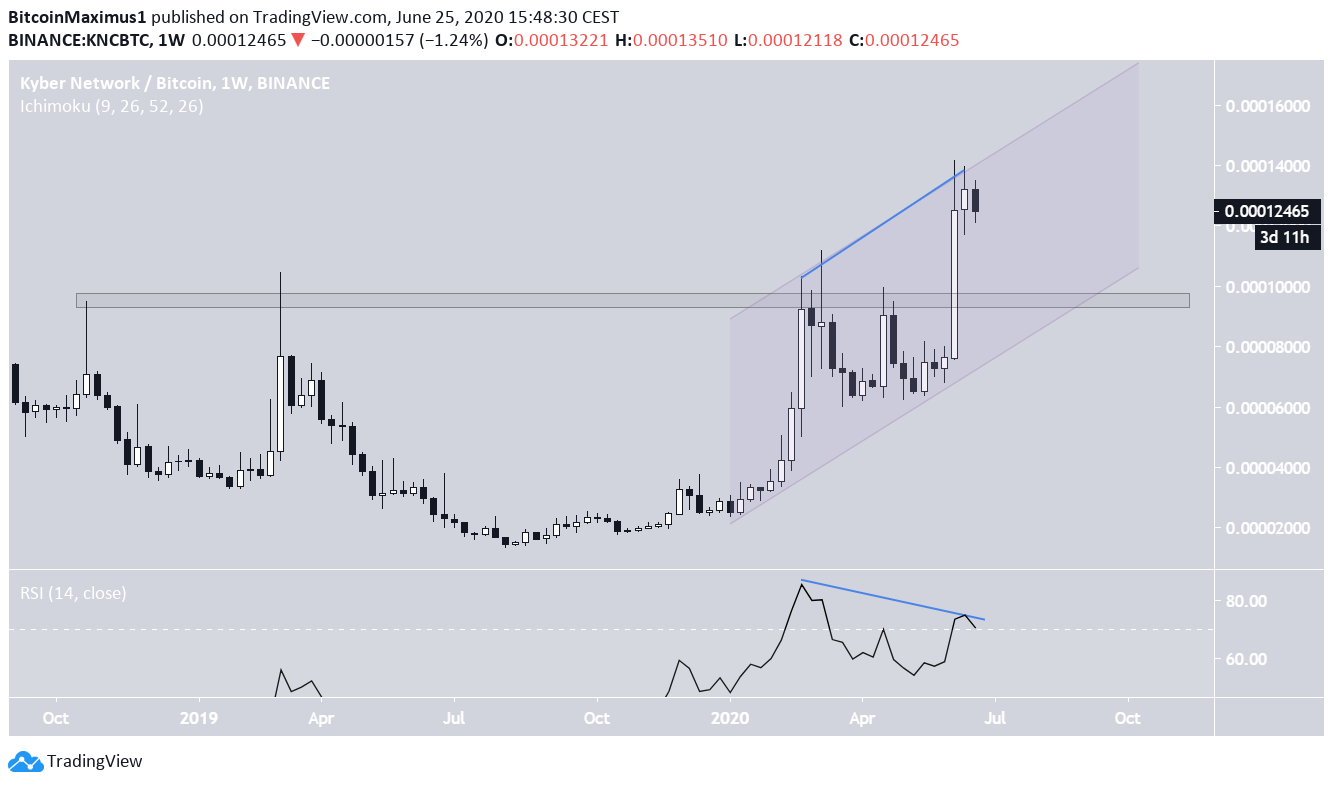
The KNC price has been declining since August 12, 2019, when it reached a low of 1410 satoshis. However, the rate of increase later accelerated, and at the beginning of 2020, KNC has been moving upwards at this accelerated pace.
At the beginning of June, the price broke out from the 9500 satoshi area, reaching a high of 14,198 satoshis. It has been trading near that level since.
However, there is considerable bearish divergence developing on the weekly RSI, a sign that the price is likely to move downwards.
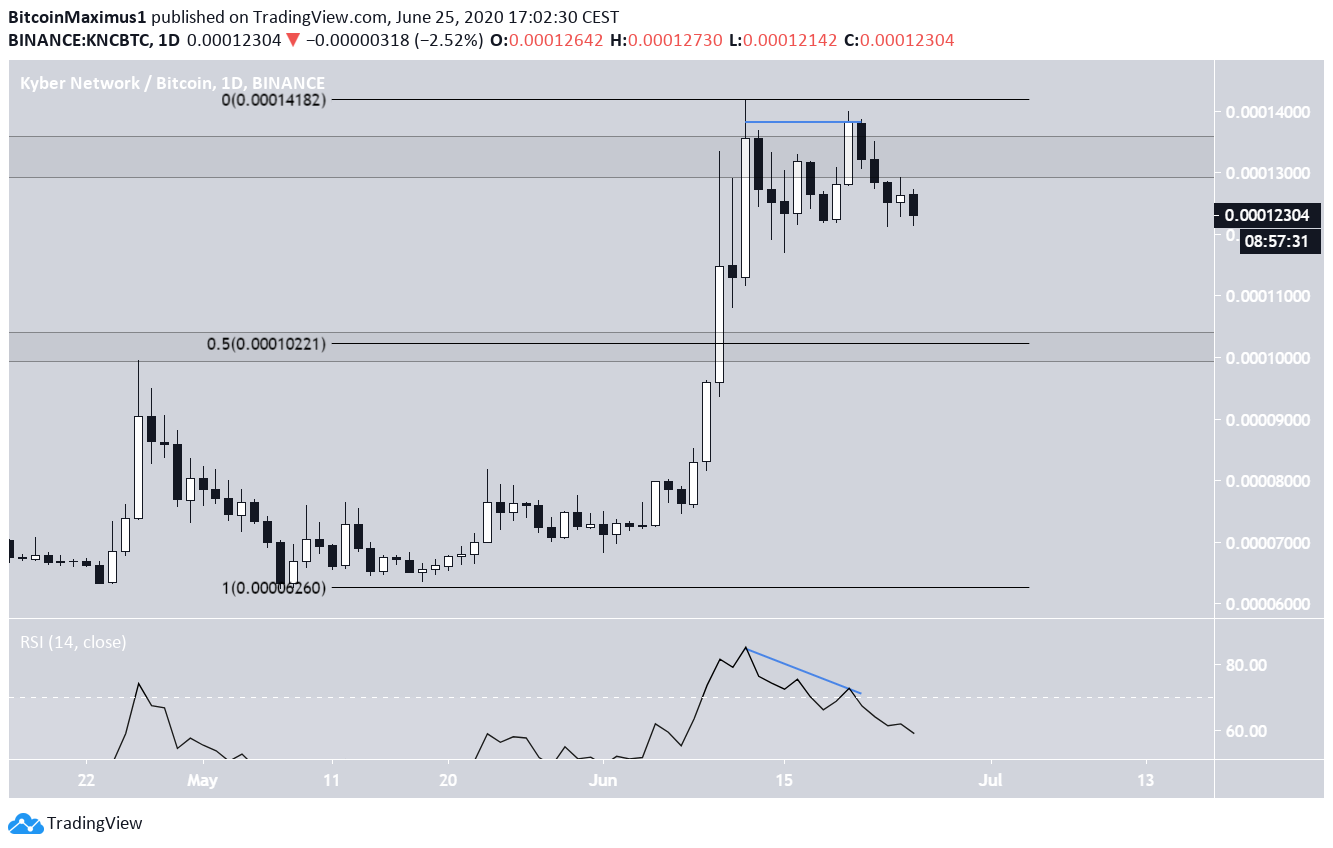
The daily chart supports this possibility since KNC has already created a double top pattern, which is also supported by bearish divergence on the RSI.
Furthermore, the previously mentioned support area is also the 0.5 Fib level of the entire upward move, making it a very likely reversal level.
Well-known trader @rookieXBT said that the next two coins that are likely to move upwards are indeed KNC and TOMO:
Keep an eye on… $KNC before it’s Katalyst upgrade (stake KNC to make ETH). $TOMO looking to break out of huge area tbh af.
Therefore, we’ll take a look at TOMO in the next section.
Tomochain (TOMO)
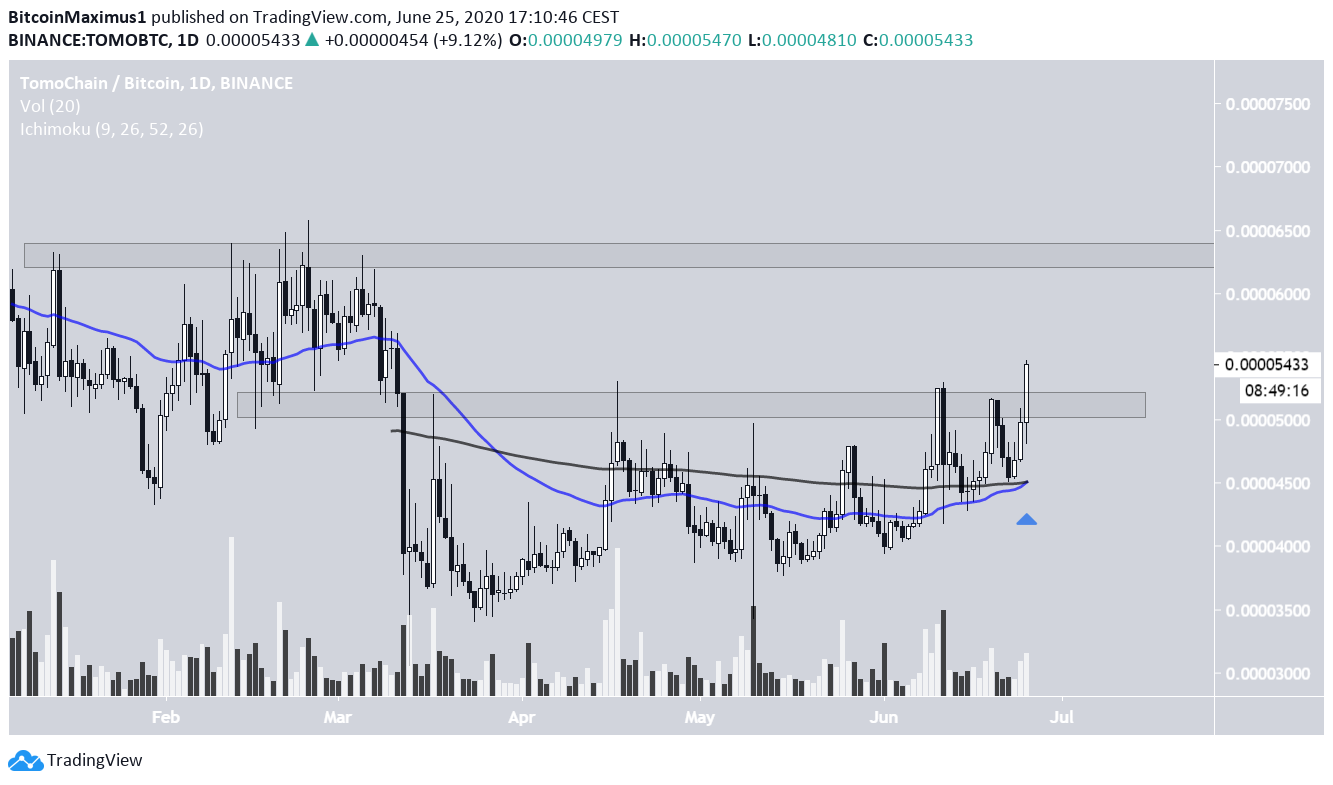
The TOMO price is in the process of breaking out from a long-term resistance area found at 5200 satoshis. This resistance has been in place since the beginning of February.
At the time of writing, TOMO was in the process of creating a bullish engulfing candlestick above this resistance level. If the price were to reach a close above it and then validate that as support, it would pave the way for an increase that could take the price all the way to the next resistance area at 6300 satoshis.
The possibility of the rally is strengthened by the 50 and 200-day moving averages (MA), which have just made a bullish cross and are offering support to the price.