
The Komodo (KMD) price is trading near its all-time lows. Technical indicators suggest an eventual upward move is expected.
While TROY (TROY) has broken out from a long-term resistance area, it has failed to sustain the higher price and has decreased back below it. Until the price reclaims this level, the price movement is considered bearish.
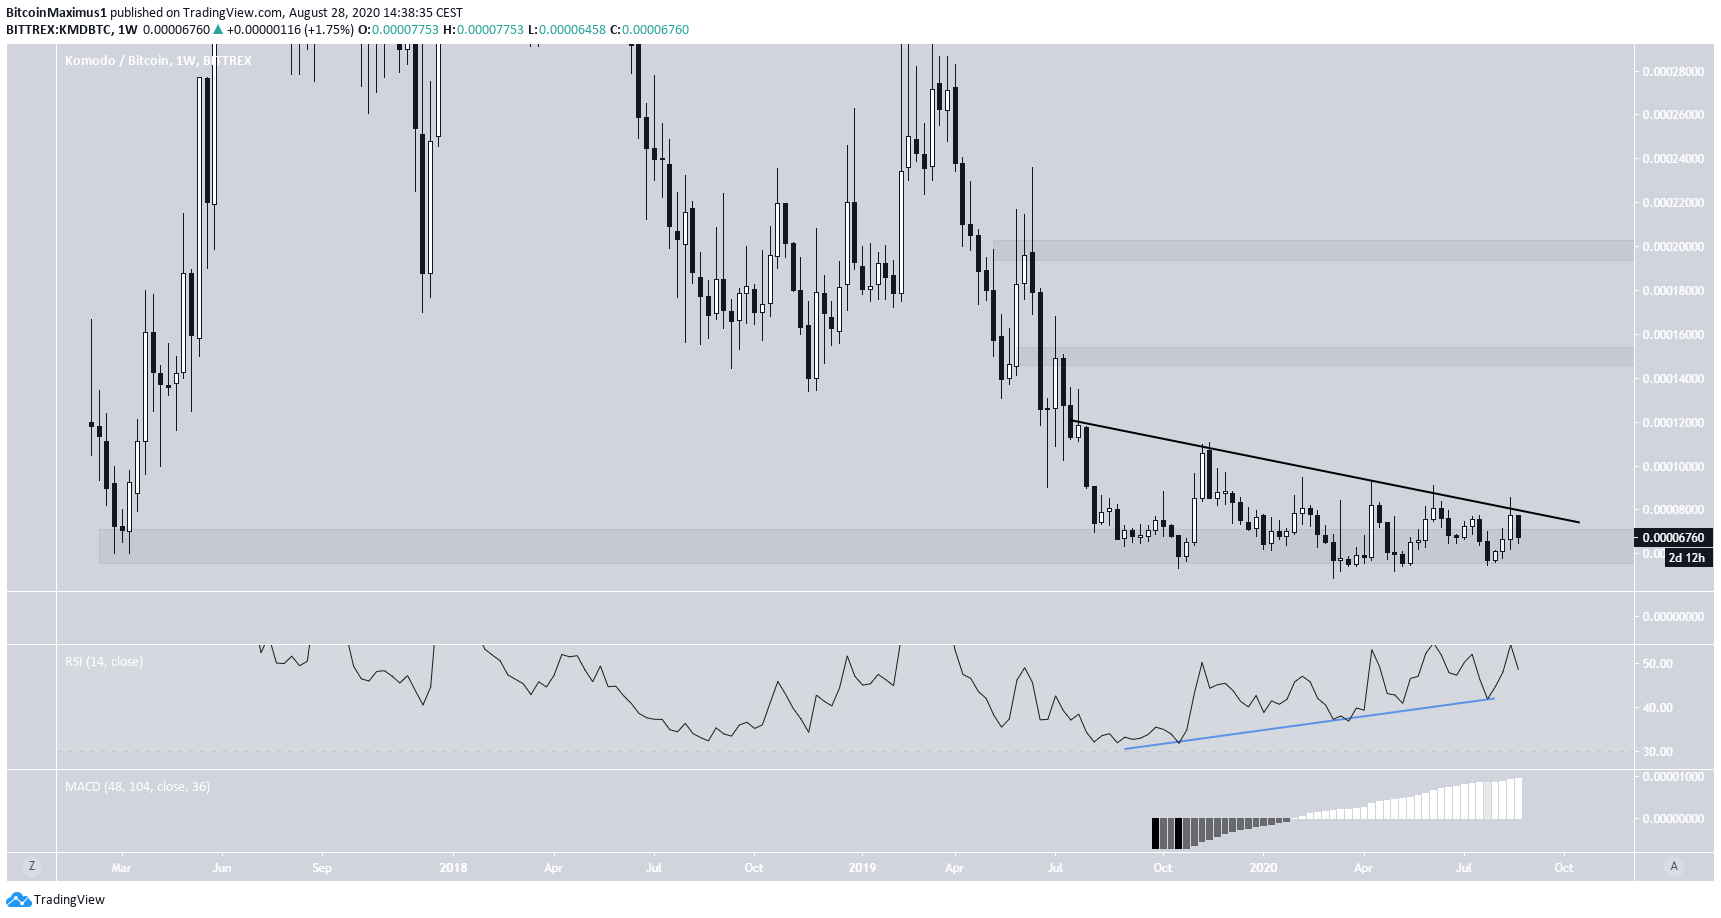
Komodo (KMD)
The KMD price is trading near its all-time lows at 6,500 satoshis and has been doing so since July 2019. Throughout this time, the price has been following a descending resistance line, generating successive lower highs.
However, technical indicators are bullish. There is bullish divergence in the RSI, which has just crossed above 50. The MACD is increasing and has not shown any loss of momentum yet.
If the price breaks out from the descending resistance line as expected, the closest resistance areas would be found at 15,000 and 20,000 satoshis.
TROY (TROY)
Cryptocurrency trader @PostyXBT outlined a long-term symmetrical triangle for TROY, stating that the price is expected to break out soon.
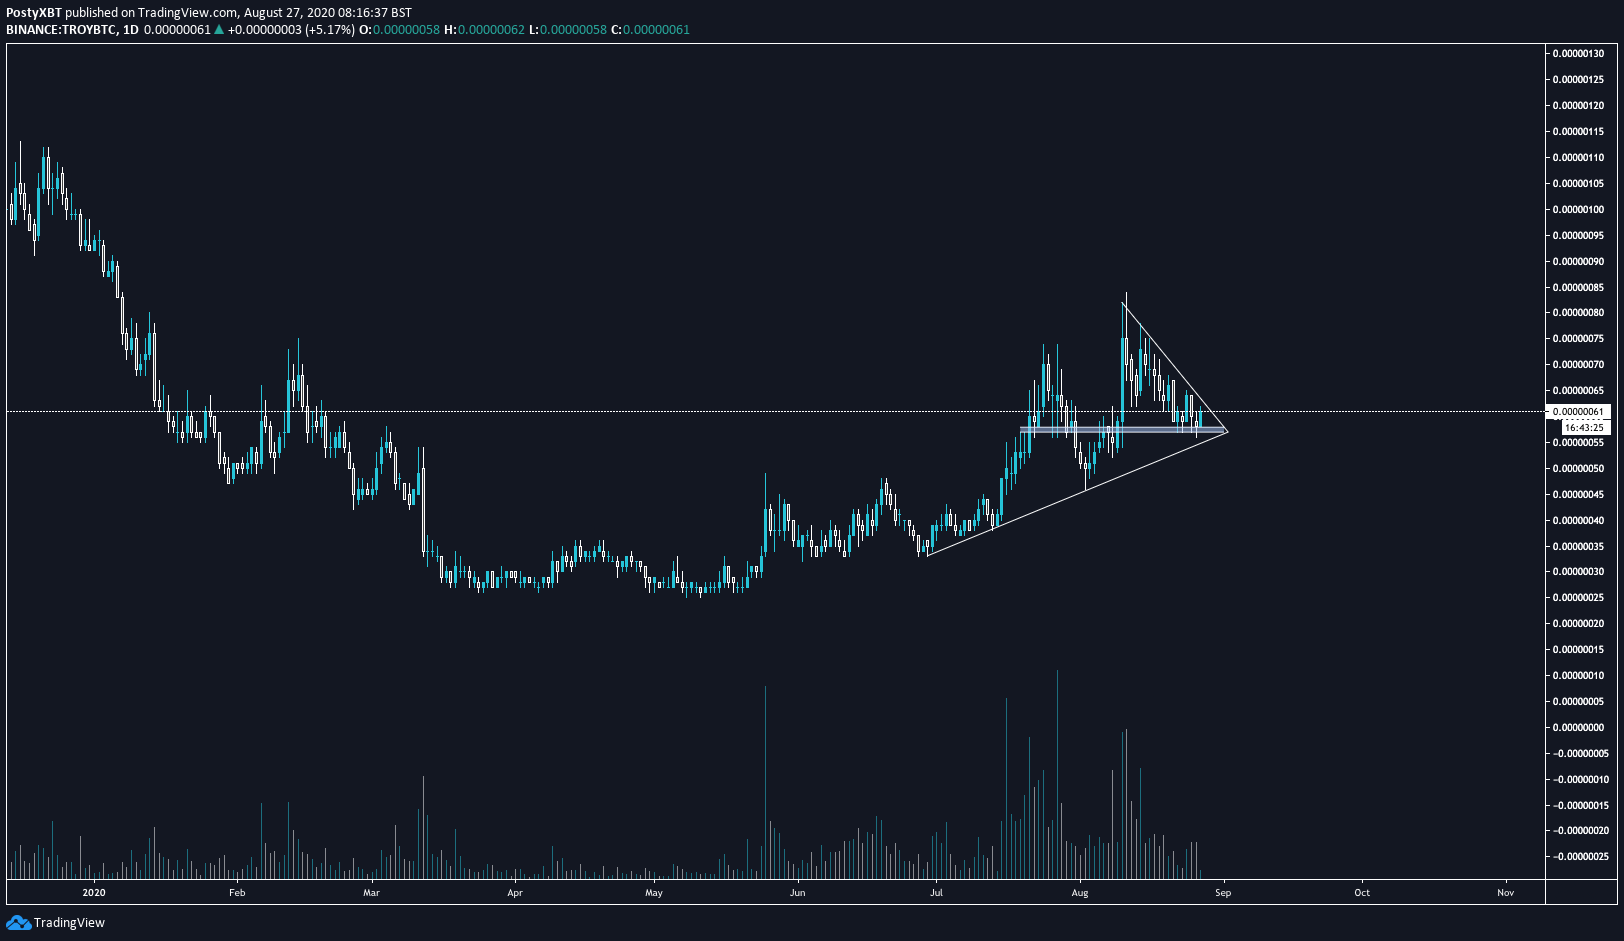
The TROY price has been increasing alongside an ascending support line since the beginning of June. At the time of writing, it was trading right at this support line.
There is an important resistance area at 70 satoshis. While the price initially moved above it, it has fallen back below, making the previous breakout a deviation above the resistance.
Technical indicators are neutral, leaning on bullish. The RSI is right at 50 and has not generated bullish nor bearish divergence. However, this is a likely place for a bounce. In addition, the price has found support at the 50- and 200-day moving averages (MA), which have already made a bullish cross.
If the price continues trading above this support line, it is expected to break out above 70 satoshis and eventually reach the next resistance area at 110 satoshis. If the price breaks down, instead, the closest support area would be found at 48 satoshis.
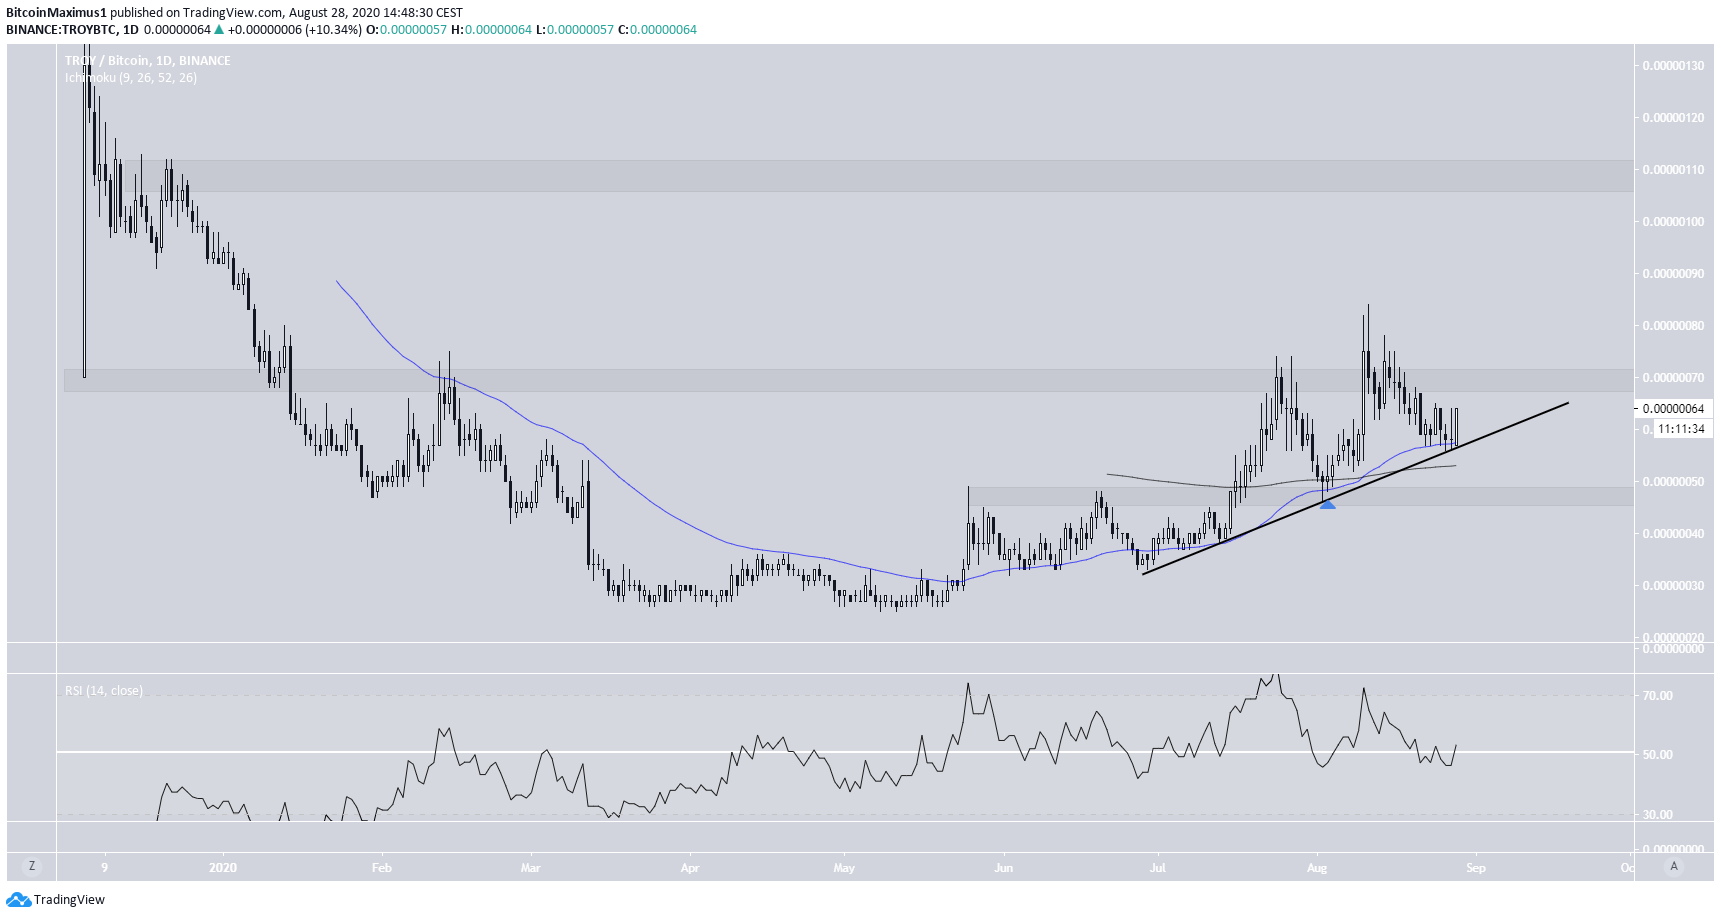
At the time of writing, a breakout seems more likely.
