The Vechain (VET) price is in the process of reclaiming yet another resistance area and moving towards 100 satoshis. ZRX has broken out from a short-term bullish pattern and is in the process of moving towards the closest resistance area.
VeChain (VET)
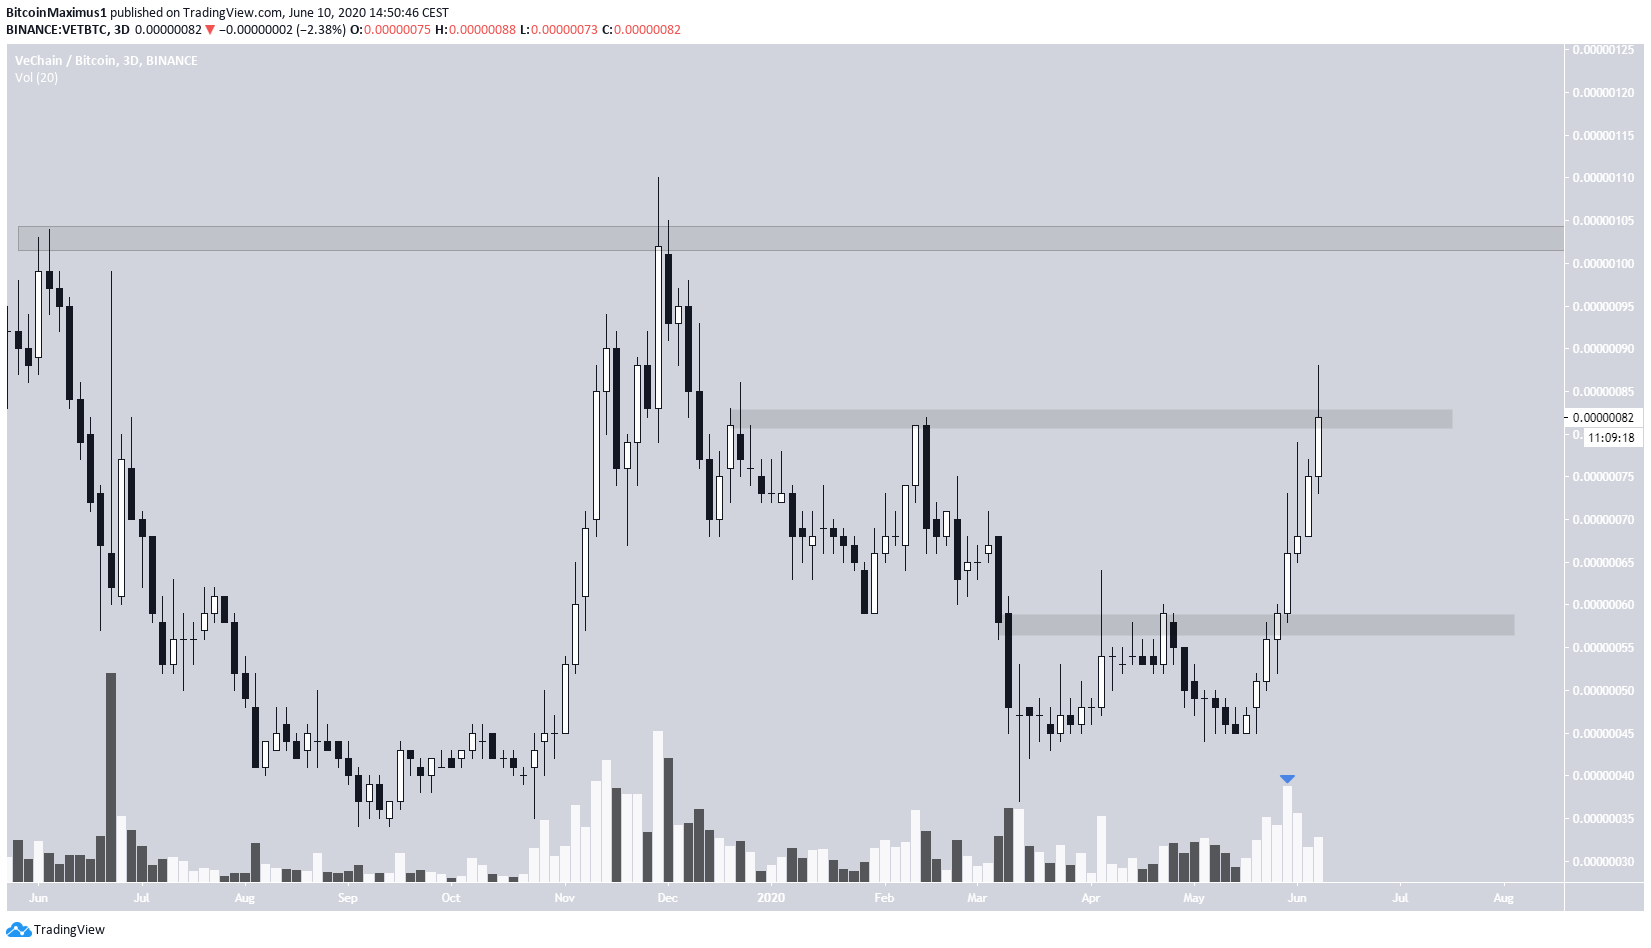
The VET price has been increasing since May 18. If the current candlestick closes bullish, which is all but confirmed, it would be the eighth successive bullish 3-day candlestick. In addition, volume has picked up considerably during this upward move, increasing the validity of the trend.
At the time of writing, the price was trading right at the 82 satoshi resistance area. If it’s successful in reclaiming that as support, the next resistance area is found at 102 satoshis.
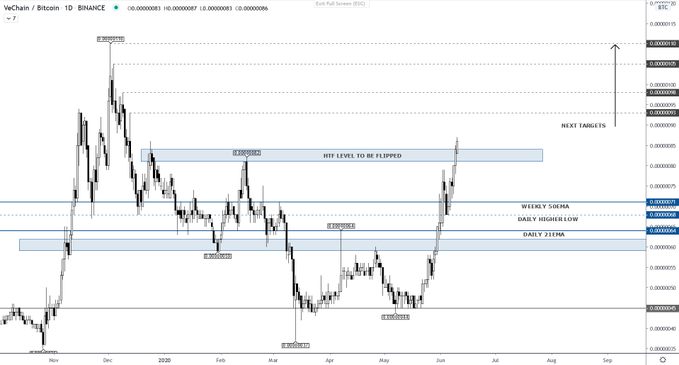
Well-known trader @TradingTank agrees with this assessment, giving three targets between 93-110 satoshis and suggesting that the price will move towards them.
$VET Has no chill. Might just carry right on to the next targets. A bit of sideways consolidation here above resistance would set things up nicely.
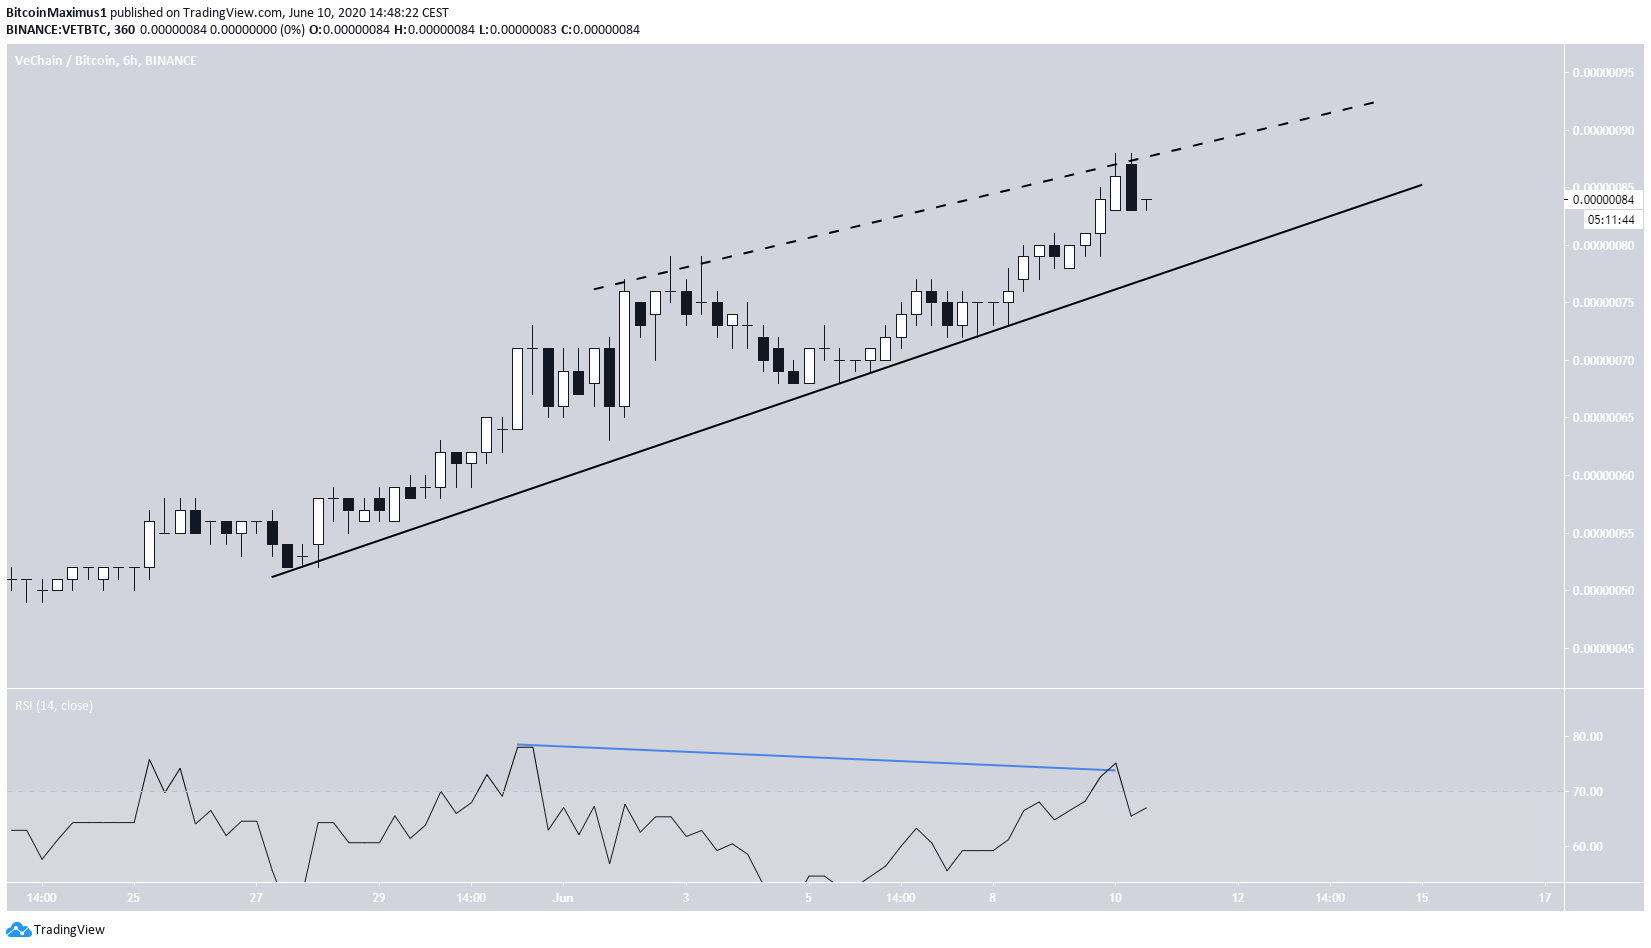
However, the first signs of weakness are visible when looking at the six-hour chart. The price is possibly trading inside an ascending wedge, which is considered a bearish reversal pattern. However, while support is still holding, the slope of the resistance line has not yet been confirmed.
However, there is considerable bearish divergence developing on the RSI. This allows for the possibility that the VET price will increase inside the confines of this wedge until it reaches the resistance area of 102 satoshis and then break down.
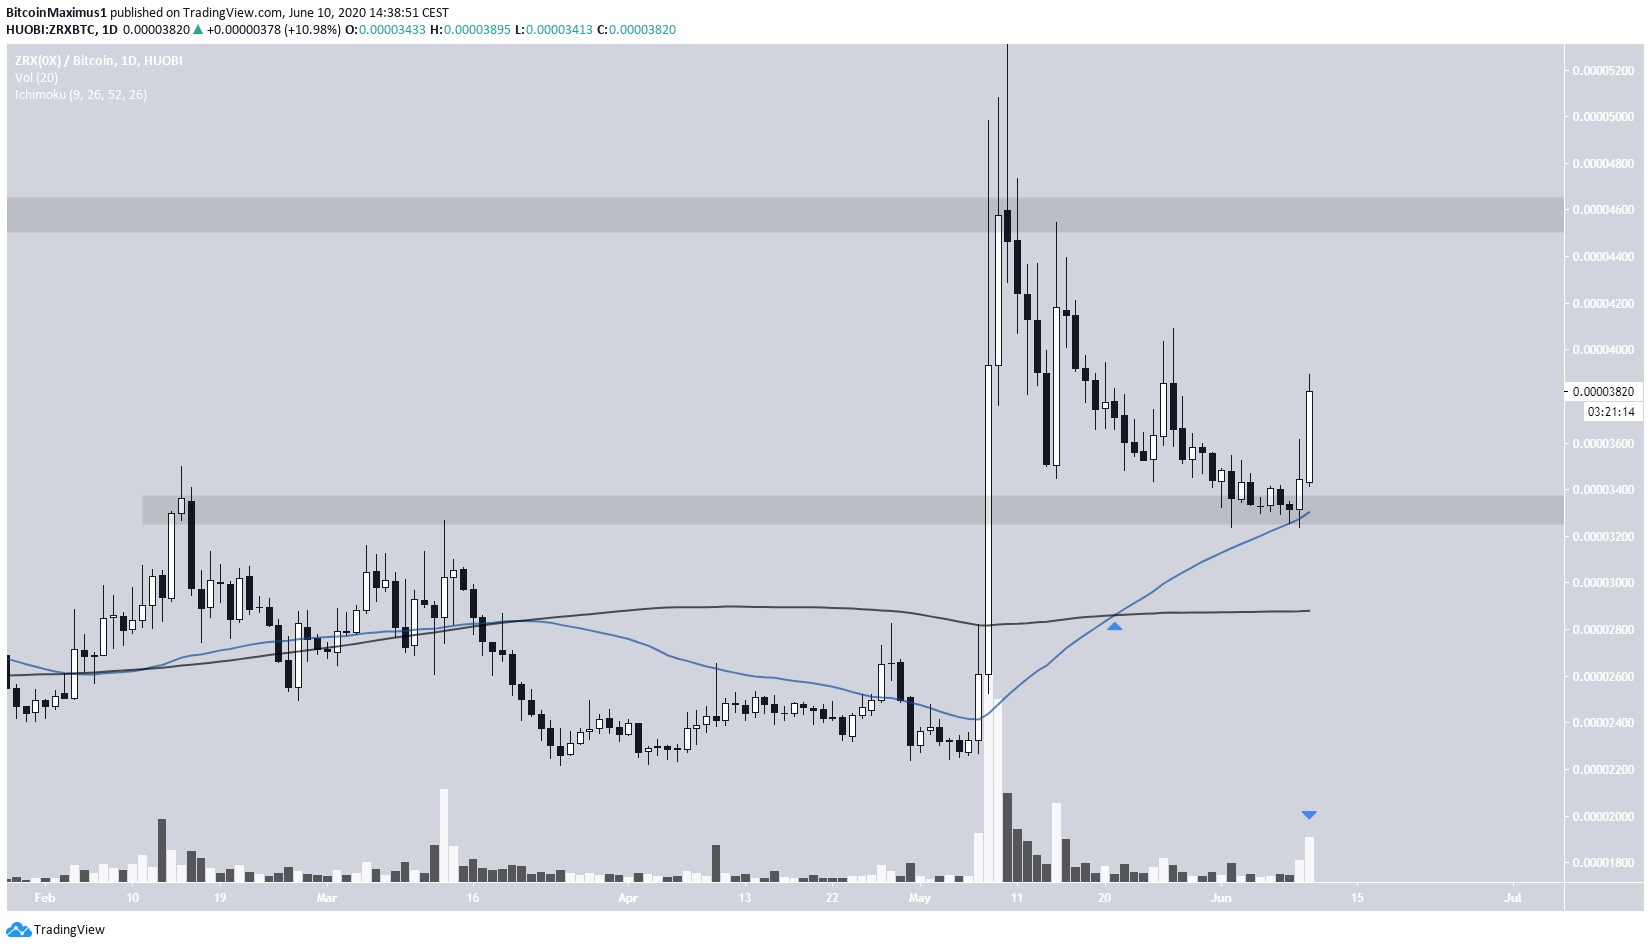
0x (ZRX)
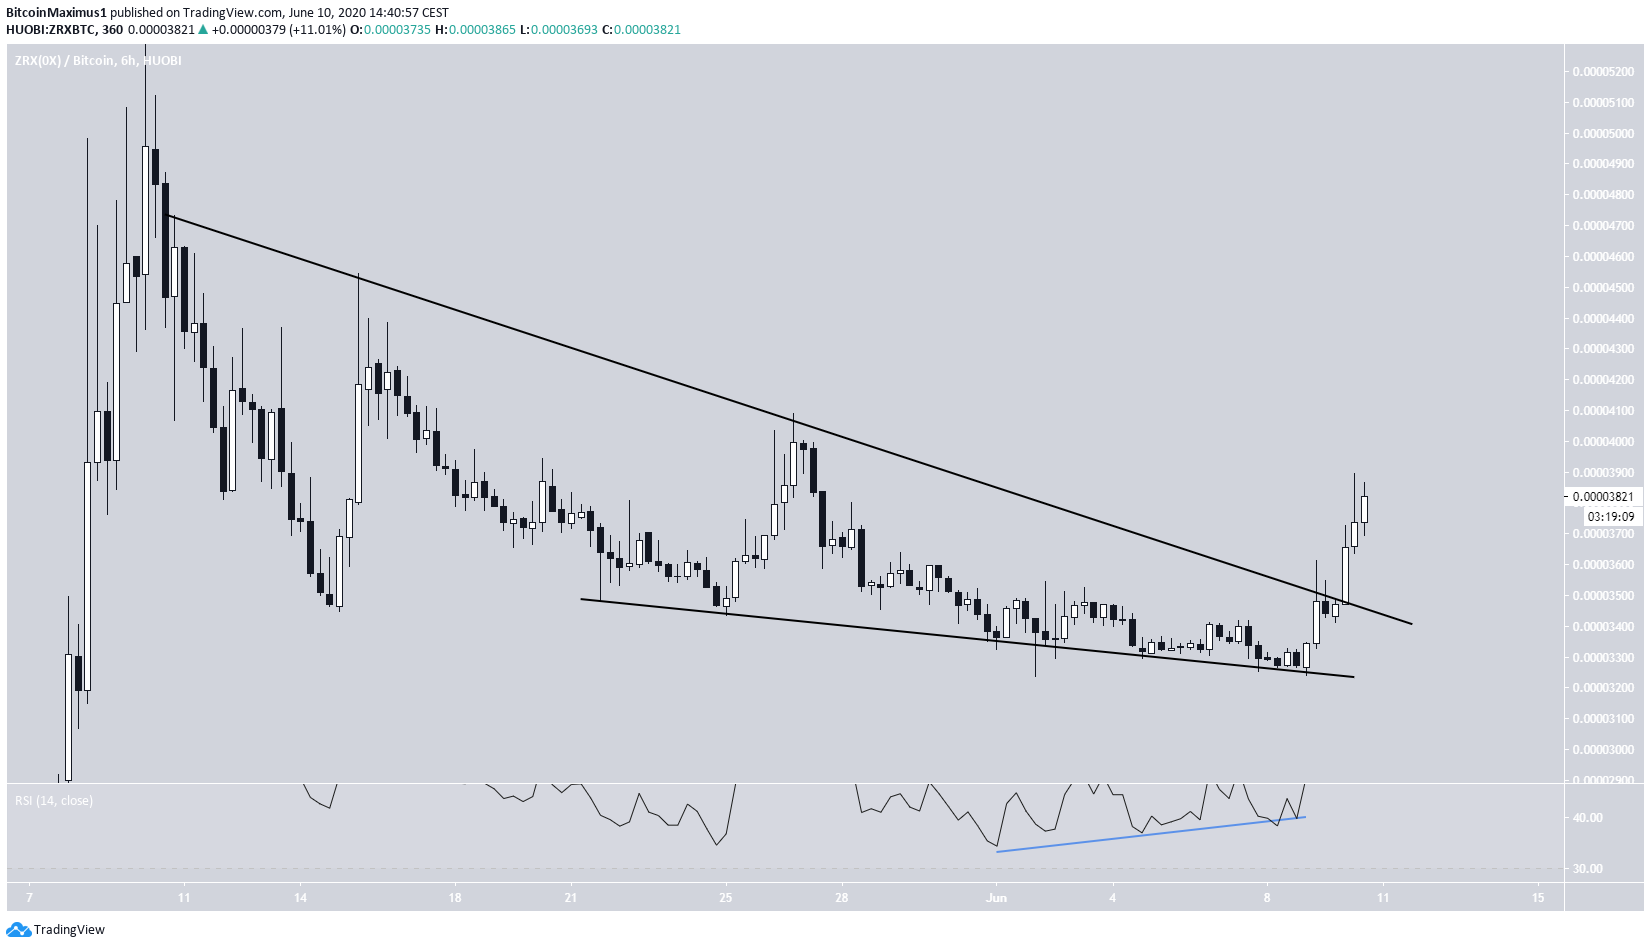
On May 7, ZRX began an upward move, and it reached a high of 5372 satoshis three days later. The price has been decreasing ever since.
After retracing, the price found support above the 3350 satoshi support area and the 50-day MA, which previously made a bullish cross with the 200-day indicator.
At the time of writing, it was in the process of creating a bullish engulfing candlestick on considerable volume. If the price continues rallying, the next closest resistance area would be found at 4600 satoshis.
The shorter-term chart reveals that the price broke out from a descending wedge after forming bullish divergence. This increases the legitimacy of the breakout and indicates that ZRX is likely to increase towards the previously mentioned 4600 satoshi resistance area.