
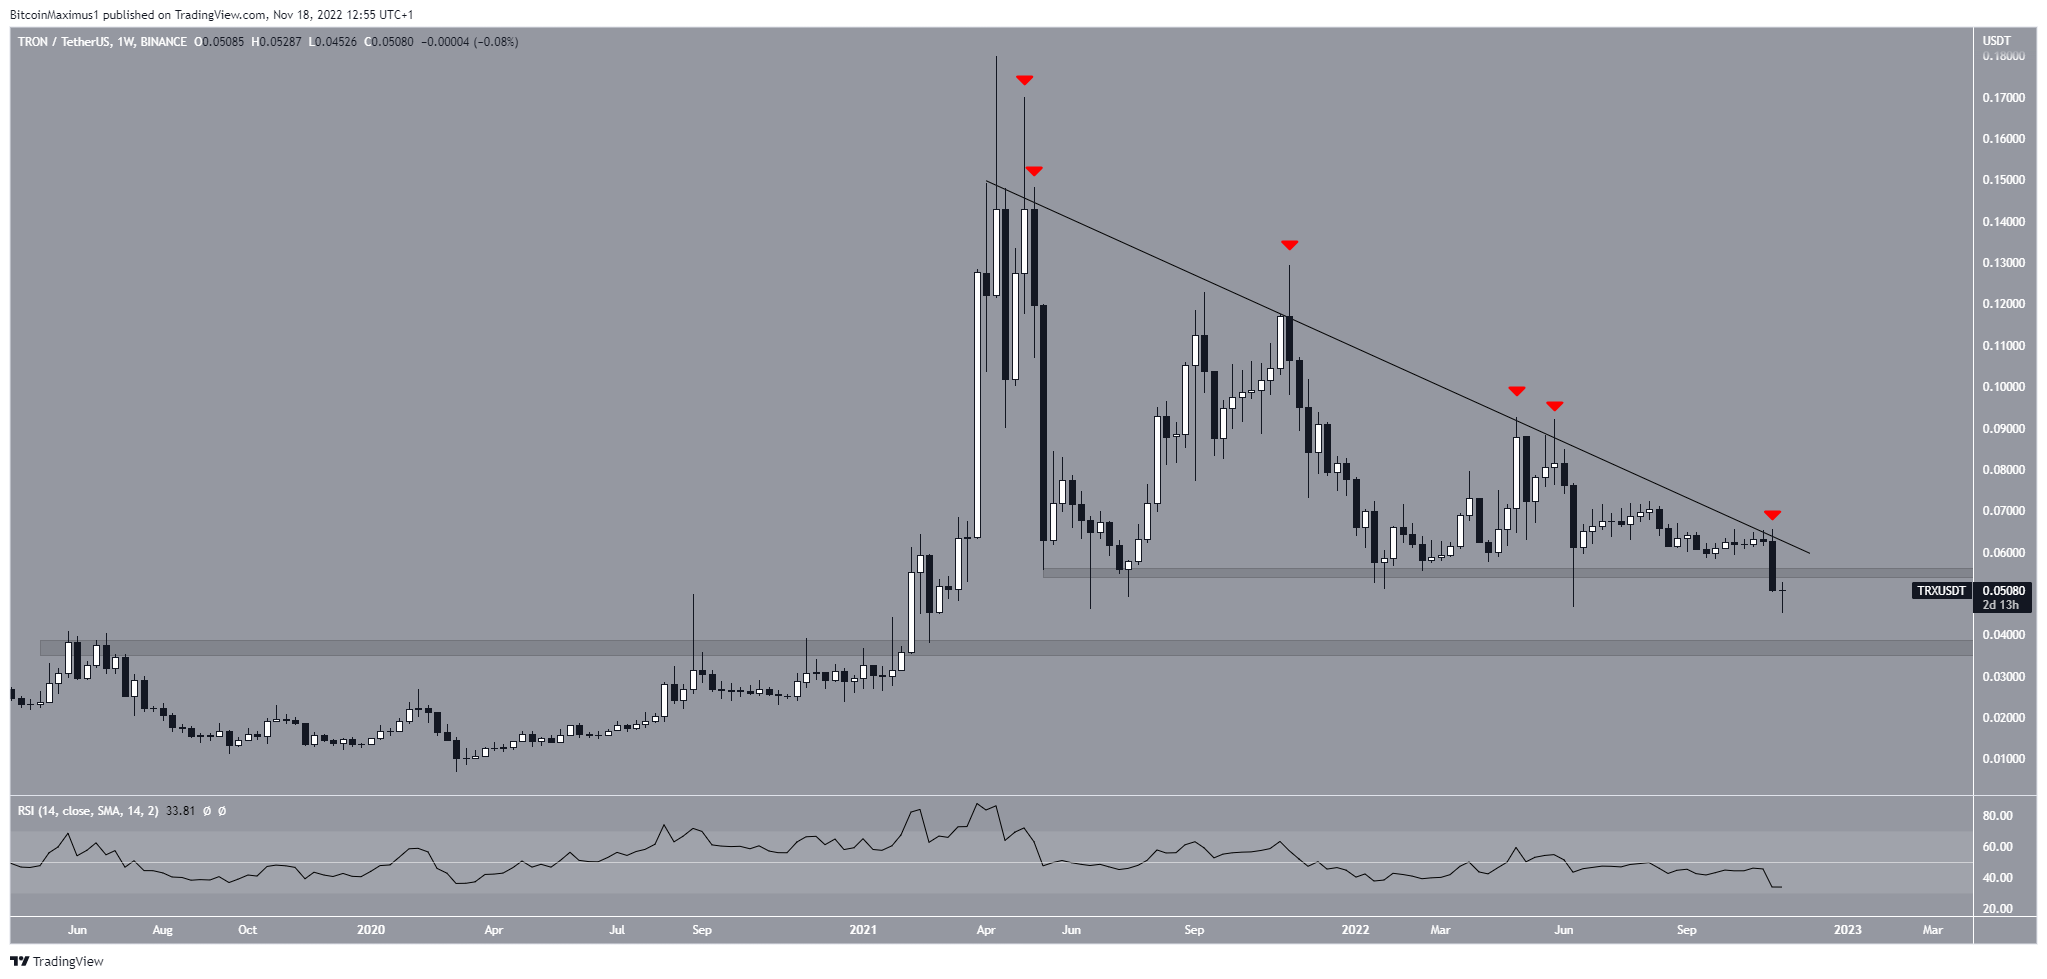
The TRON (TRX) price broke down from a long-term horizontal support area. This could be the first step of a long-term drop toward $0.36.
The technical analysis from the weekly time frame gives a bearish outlook. The TRX price has decreased underneath a descending resistance line since April 2021.
The line has caused numerous rejections (red icon). On Nov. 7, it catalyzed a sharp fall, breaking down below the long-term $0.055 support area. This also confirmed that the RSI is below 50, a bearish development.
There was some interesting TRON news preceding the drop, both positive and negative. The TRON-based stablecoin USDD initially de-pegged but has now nearly stabilized. Moreover, TRON founder Justin Sun announced he had plans to reimburse FTX customers that held TRX, BTT, JST, SUN, and HT.
In any case, the price forecast can only be considered bullish once the TRON price reclaims the $0.055 horizontal area. Due to the long-term breakdown and bearish RSI reading, this seems unlikely. Instead, the most likely TRX price prediction is a descent toward the next support at $0.36.
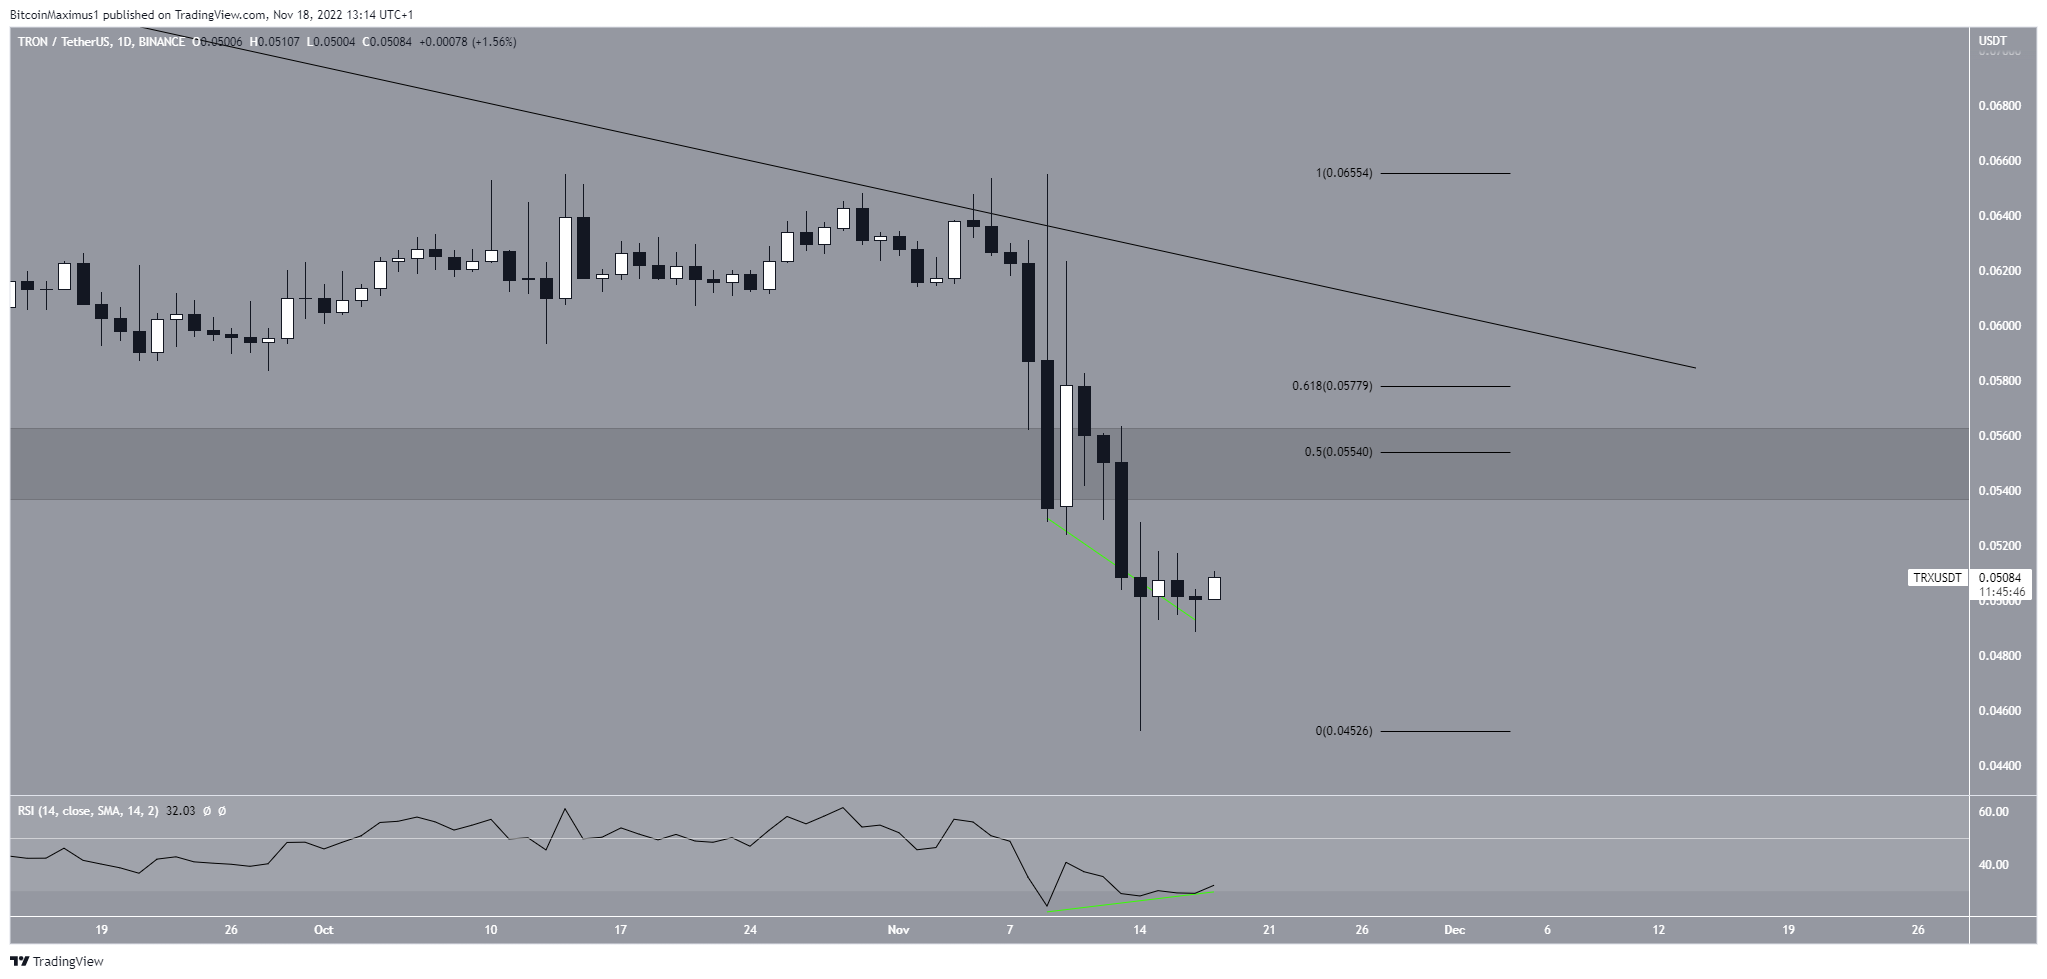
The two main reasons for this are:
- The very long lower wick on Nov. 14
- The bullish divergence in the daily RSI.
The current bounce over the past 24 hours could lead to a future price of $0.055 – $0.058.
However, there is massive resistance at these levels, created by the long-term horizontal resistance area, long-term descending resistance line and the 0.5-0.618 Fib retracement support levels.
As a result, the trend cannot be considered bullish unless TRON reclaims this level. Rather, the most likely scenario is the continuation of the downward movement towards $0.036.
For BeInCrypto’s latest Bitcoin (BTC) analysis, click here.
Disclaimer: BeInCrypto strives to provide accurate and up-to-date information, but it will not be responsible for any missing facts or inaccurate information. You comply and understand that you should use any of this information at your own risk. Cryptocurrencies are highly volatile financial assets, so research and make your own financial decisions.
