


TRON (TRX) has been trading below the $0.043 resistance area for more than two years.
TRON is expected to gradually increase and make another breakout attempt above this level.
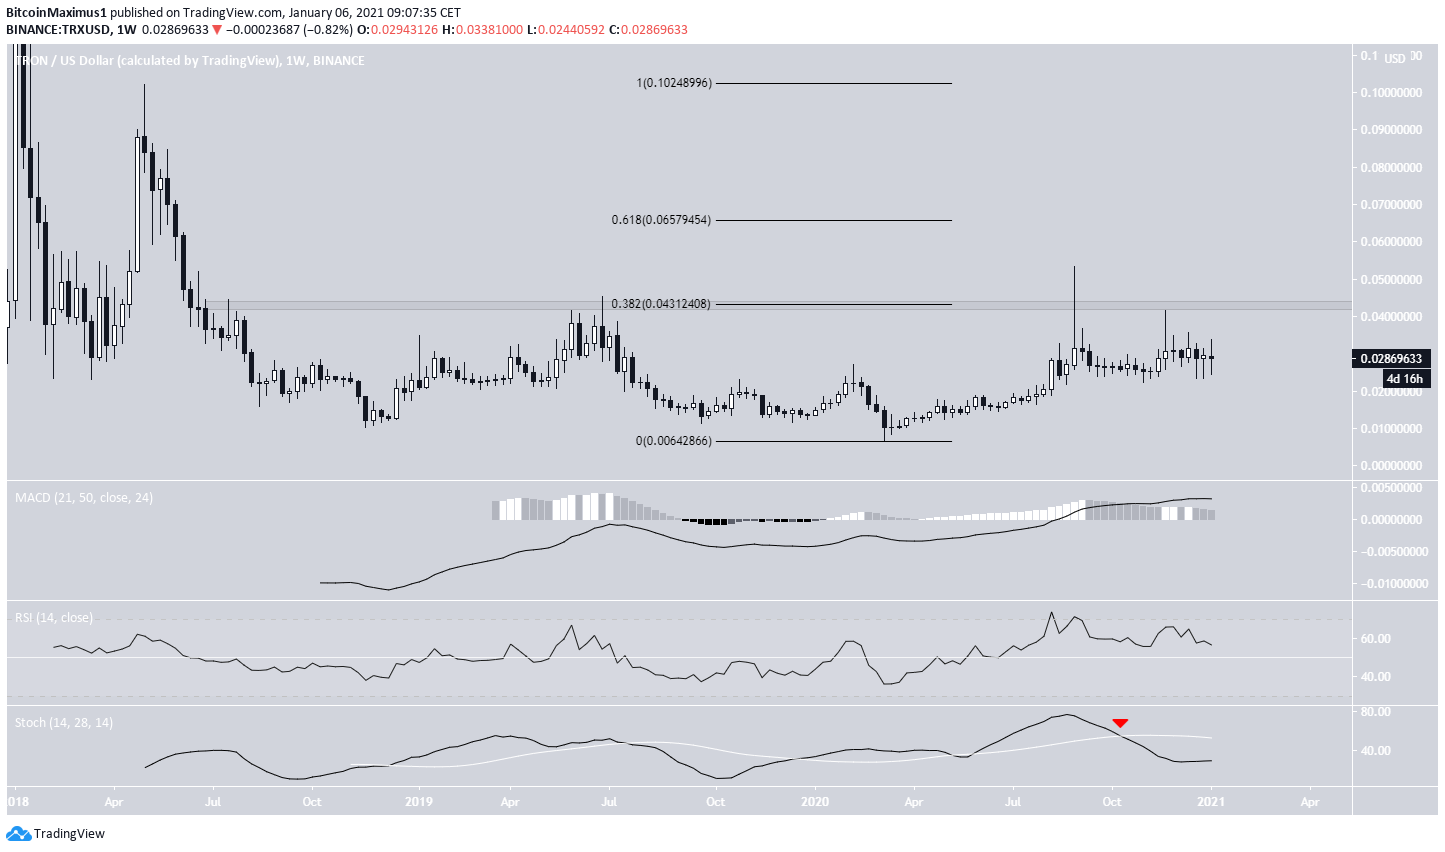
Long-Term TRON Resistance
TRX has been trading below the $0.043 resistance area since June 2018. The area is the 0.382 Fib retracement level of the most recent downward movement. Until now, TRX has made four unsuccessful breakout attempts, the most recent being in November 2020.
If a breakout were to occur, the next closest resistance area would be found at $0.066 — the 0.618 Fib retracement level of the entire previous downward movement.
However, technical indicators are neutral and fail to confirm a breakout.
Future Movement
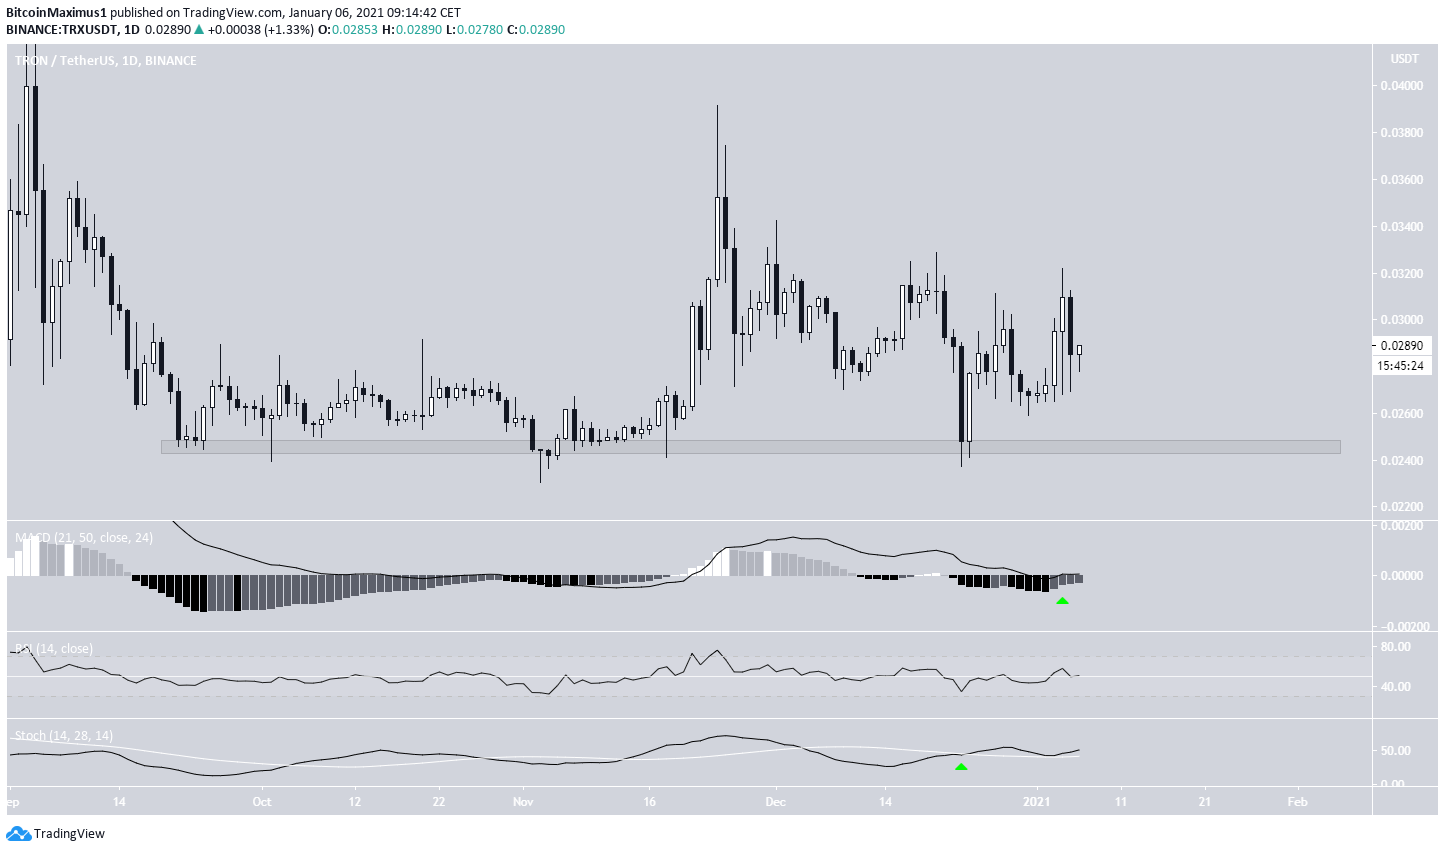
The daily chart shows that there is a strong support area at $0.024. It was most recently challenged on Dec. 23 and was the catalyst for the current upward movement.
Unlike the weekly time-frame, technical indicators are clearly bullish in the daily. This suggests that TRX is likely to increase and make another breakout attempt from the long-term $0.043 resistance area.
Cryptocurrency trader @Bleeding_Crypto outlined a TRX chart, stating that the next upward movement could potentially take it all the way to $0.05.
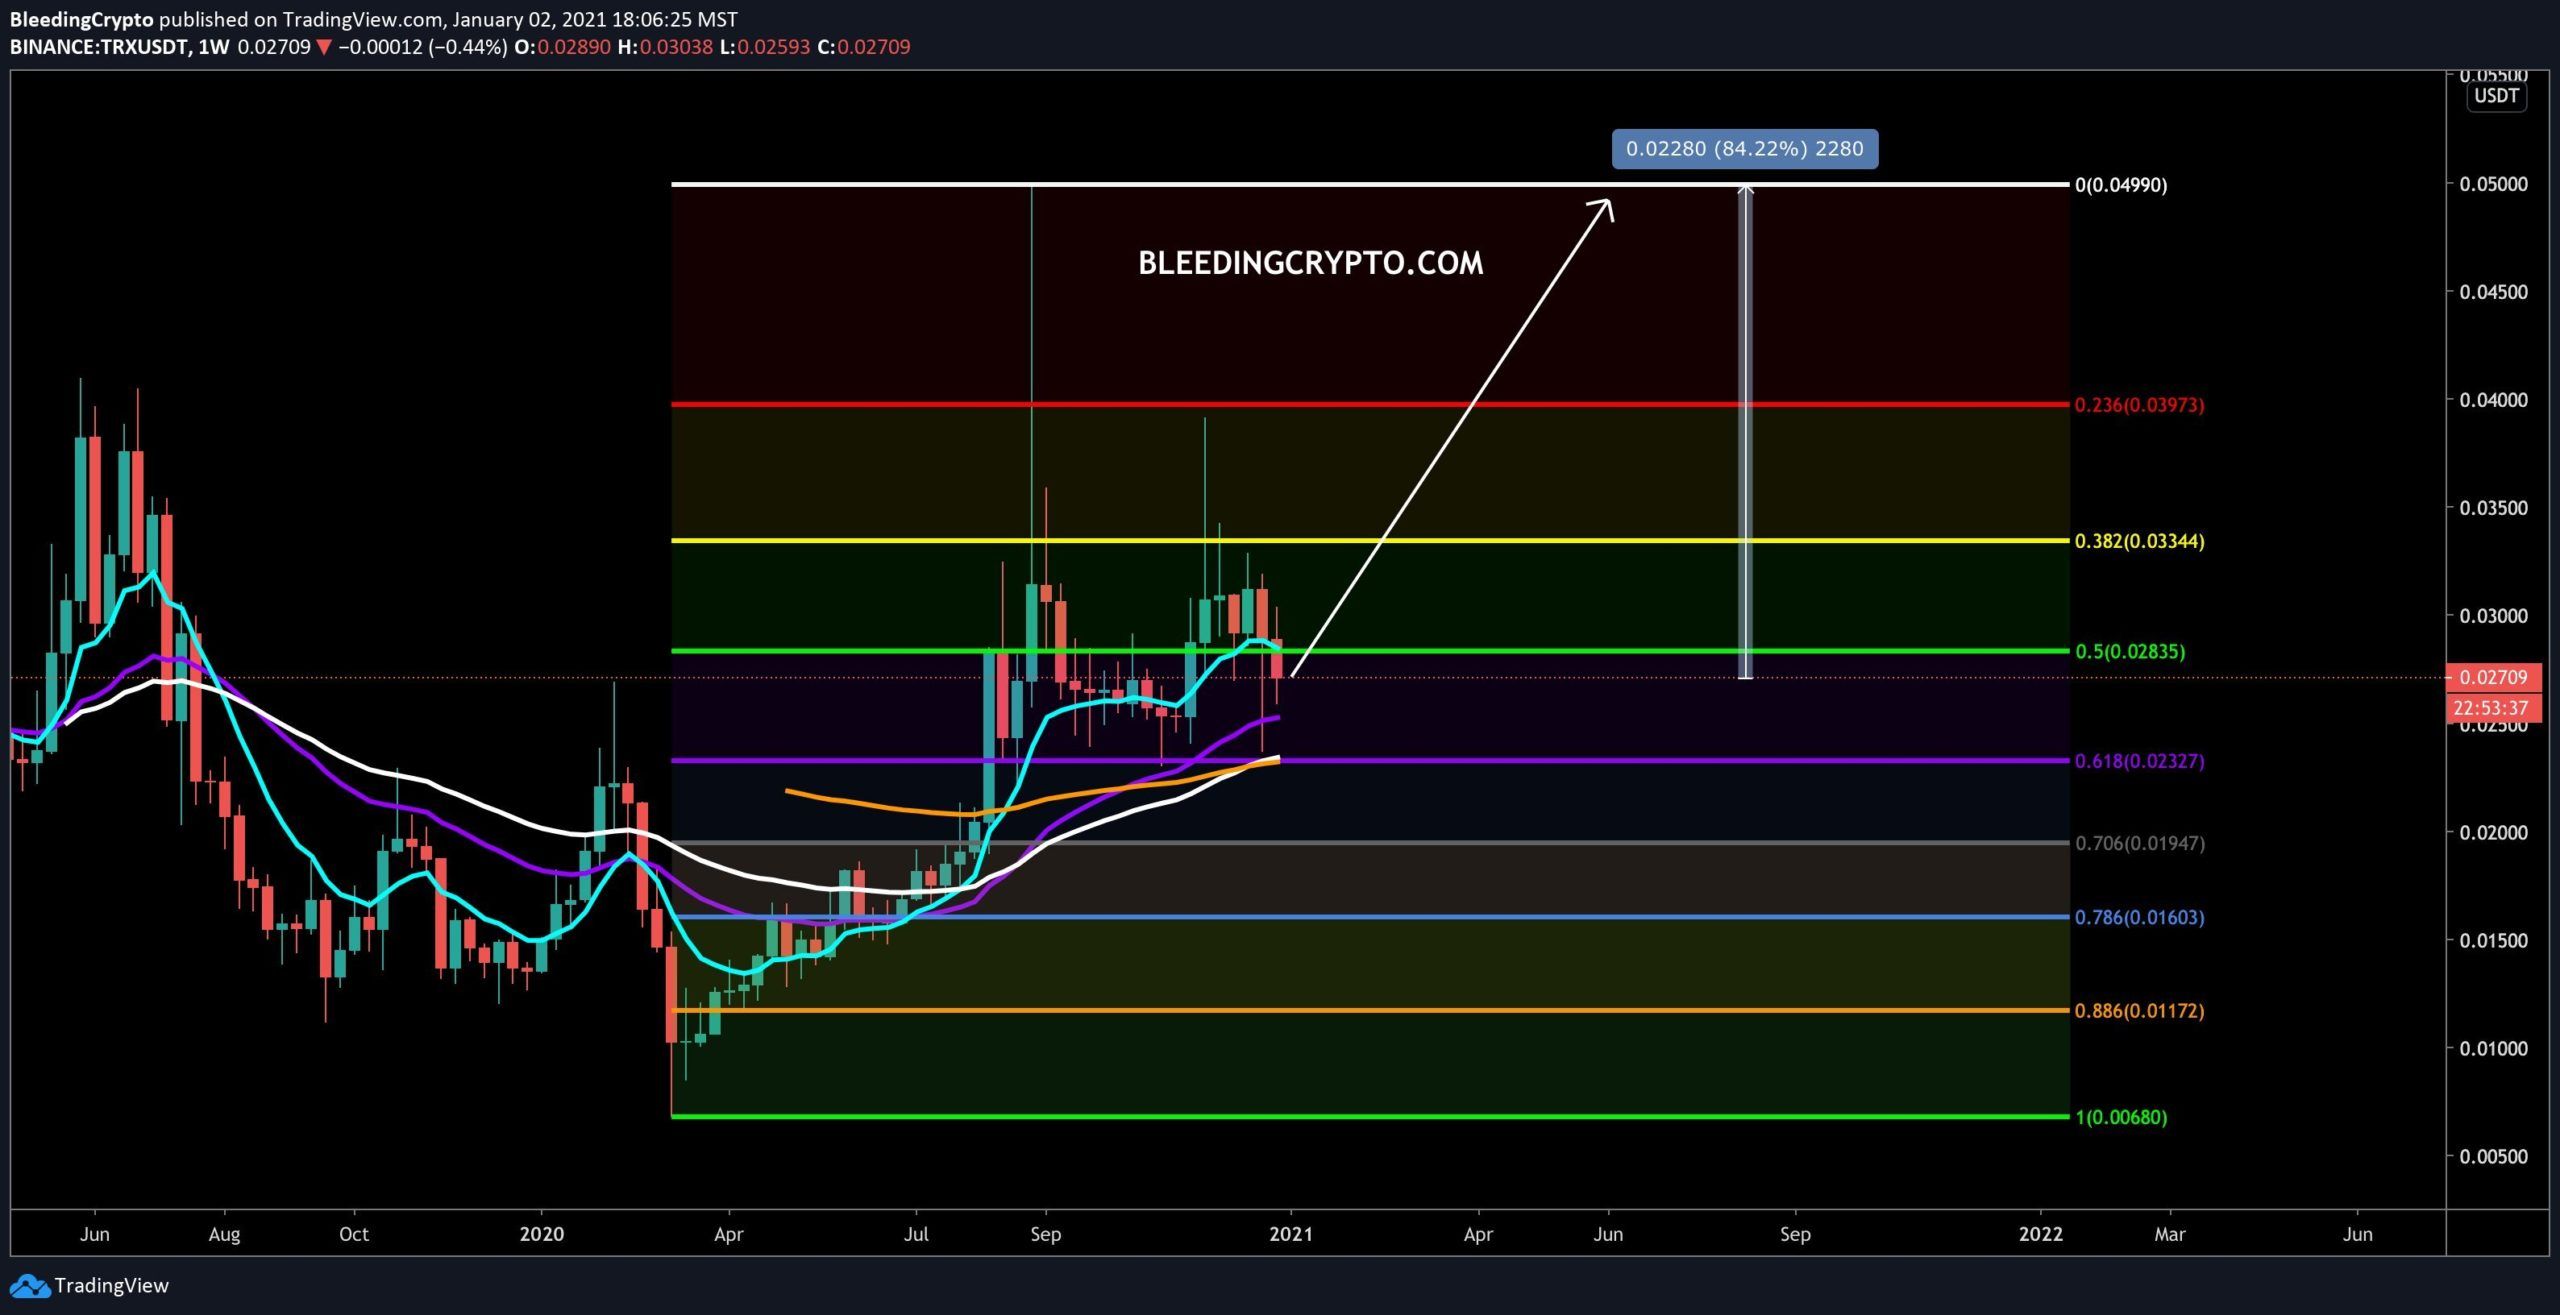
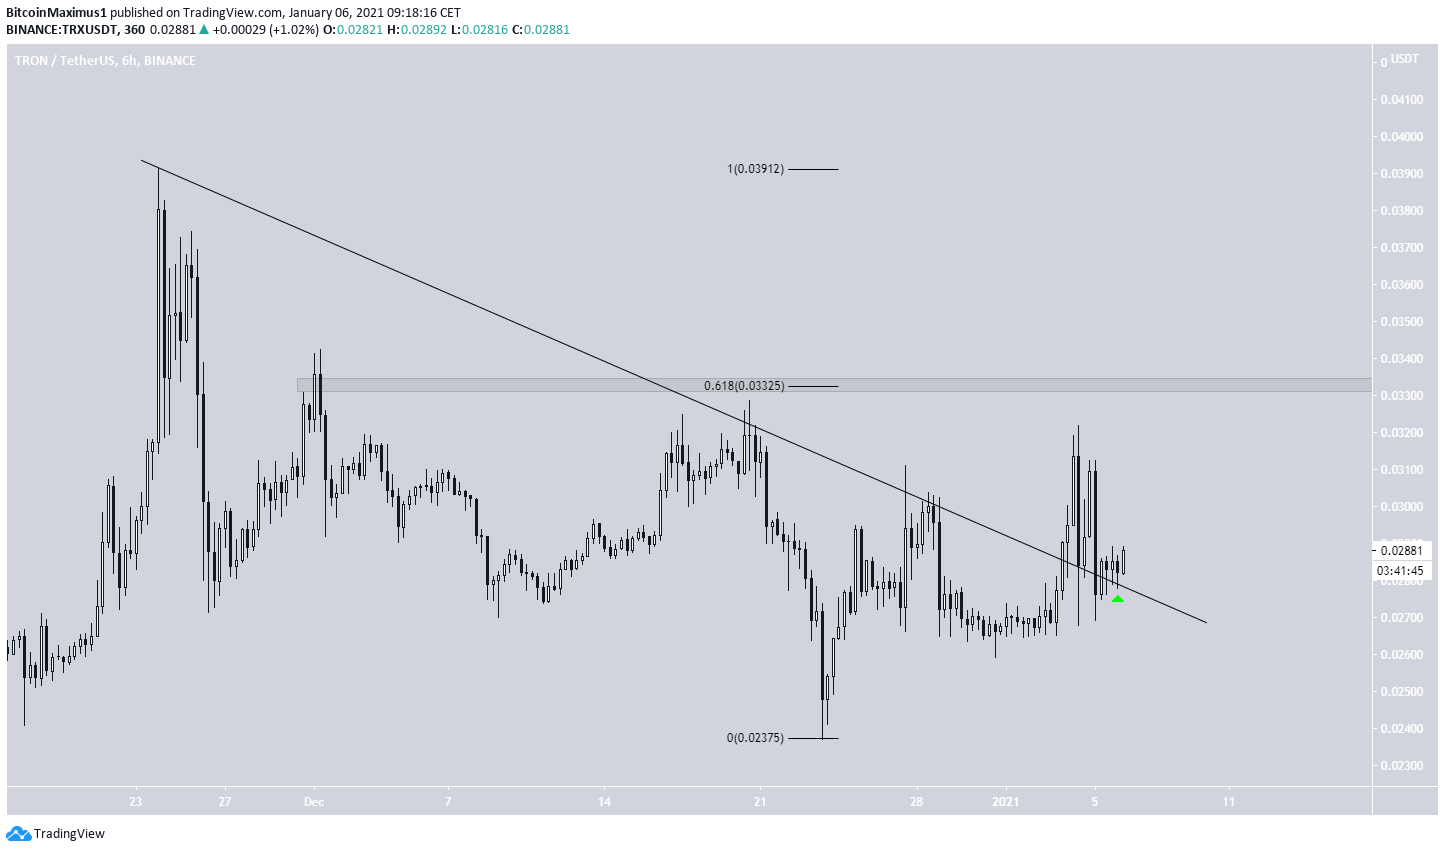
The readings from the daily time-frame support this possibility. The six-hour chart also that TRX has broken out from a descending resistance line and validated it as support after.
The closest resistance area is found at $0.033. If TRX is successful in reclaiming this level, it will likely accelerate.
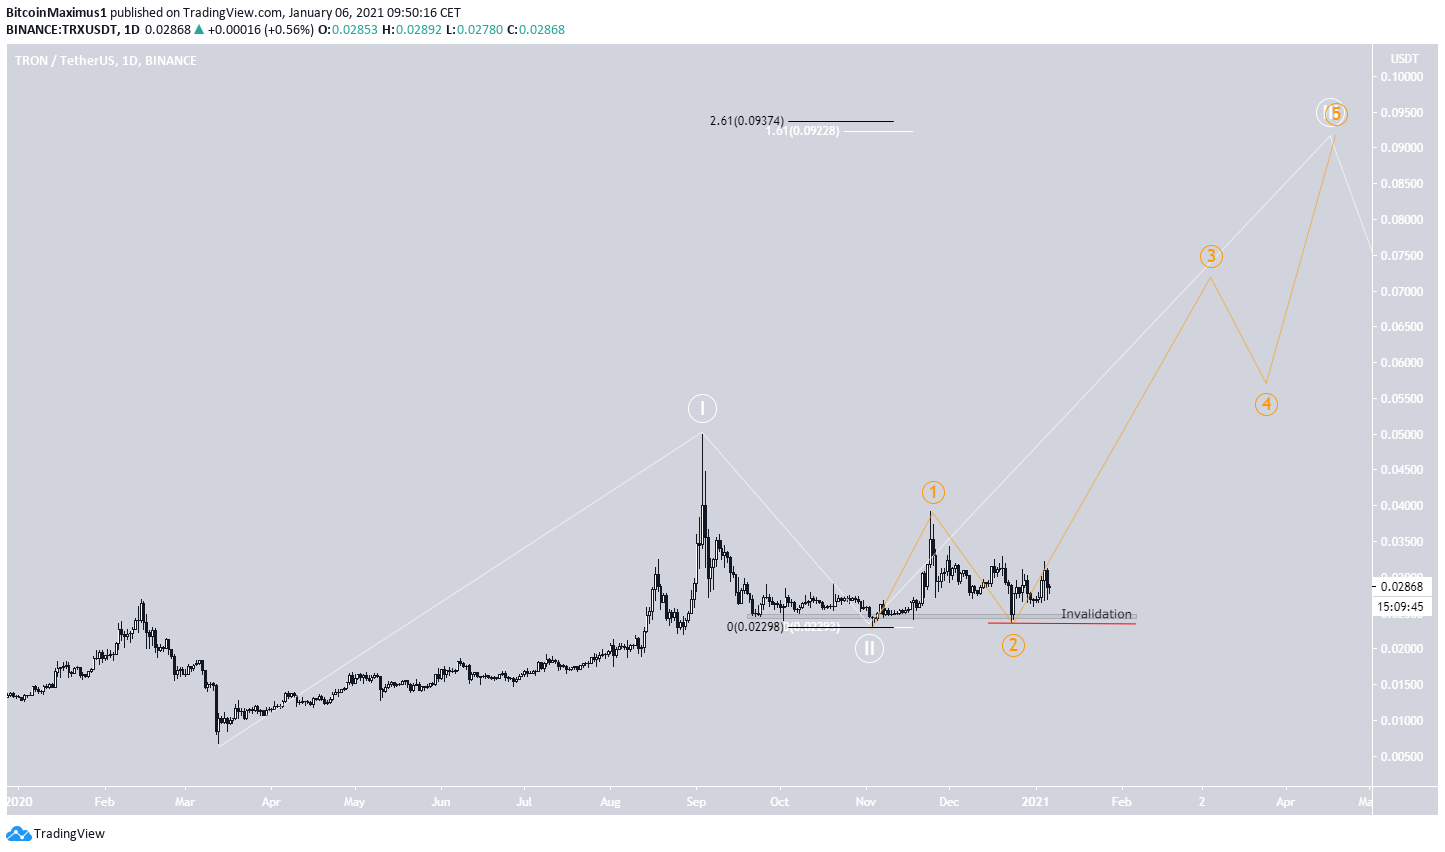
TRX Wave Count
The wave count suggests that TRX has possibly completed waves 1-2 of a long-term bullish impulse (shown in white below), and is currently in wave 3.
A possible target for the top of the move is located between $0.092-$0.093. This range was found by projecting the 1.61 length of wave 1 (white Fib) and the 2.61 external retracement of wave 2 (black Fib).
The sub-wave count is given in orange, and TRX appears to be in sub-wave 3.
A decrease below the sub-wave 2 low (red line) of $0.023 would invalidate this particular wave count.
Conclusion
TRON is expected to gradually increase towards the long-term resistance area at $0.043. The rate of increase is expected to accelerate if TRX breaks out above this level.
For BeInCrypto’s latest Bitcoin (BTC) analysis, click here!
Disclaimer: Cryptocurrency trading carries a high level of risk and may not be suitable for all investors. The views expressed in this article do not reflect those of BeInCrypto.


