On Aug 13, the TRON (TRX) price broke out from a long-term resistance level.
After a potential short-term correction, the price is expected to resume its upward movement towards the next resistance area.
TRX Long-Term Levels
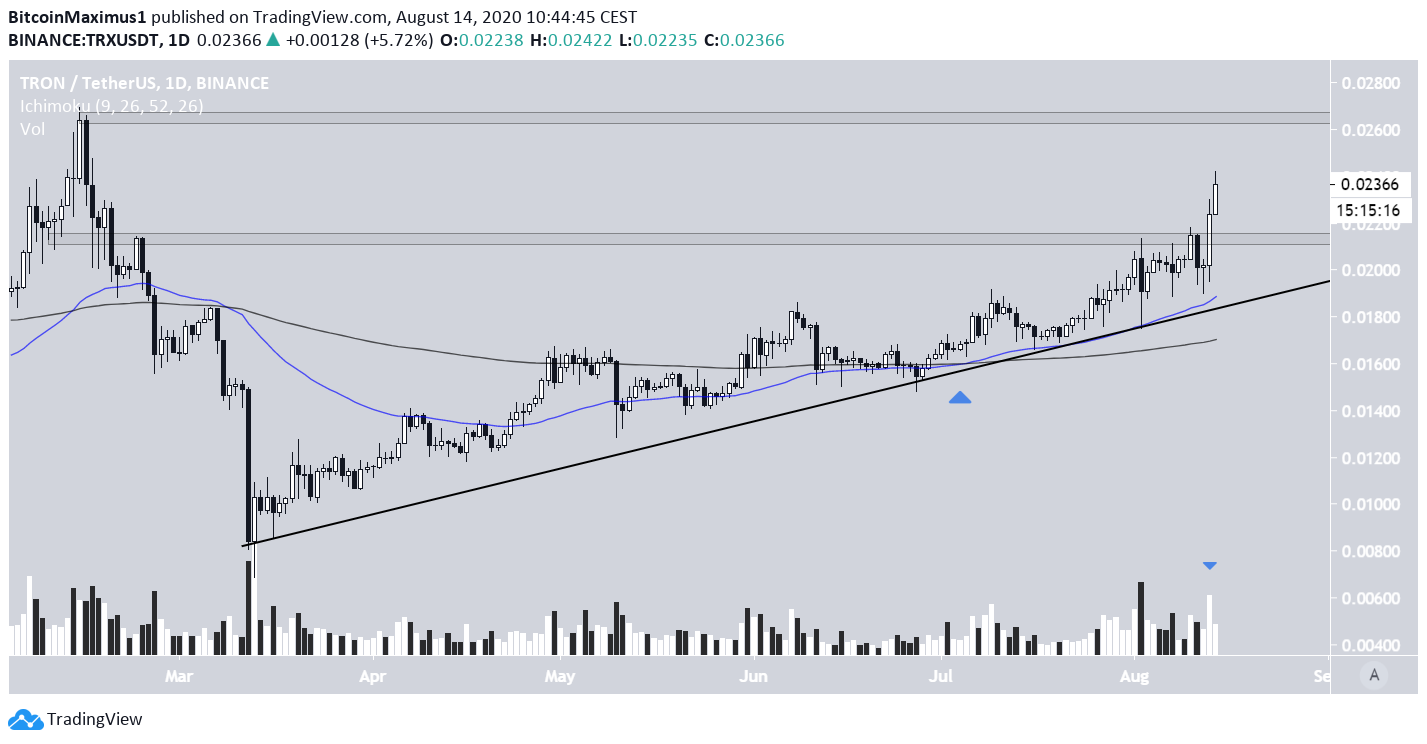
The TRX price has been increasing on top of an ascending support line since reaching a bottom on March 13. The support line is strengthened by the 50 and 200-day moving averages (MA), which have already made a bullish cross.
On Aug 13, the price broke out from the $0.214 resistance area, which is now expected to act as support. The breakout transpired with significant volume, increasing its legitimacy.
If the price manages to hold on above this level, the next resistance zone to test would be found at $0.265.
After the Breakout
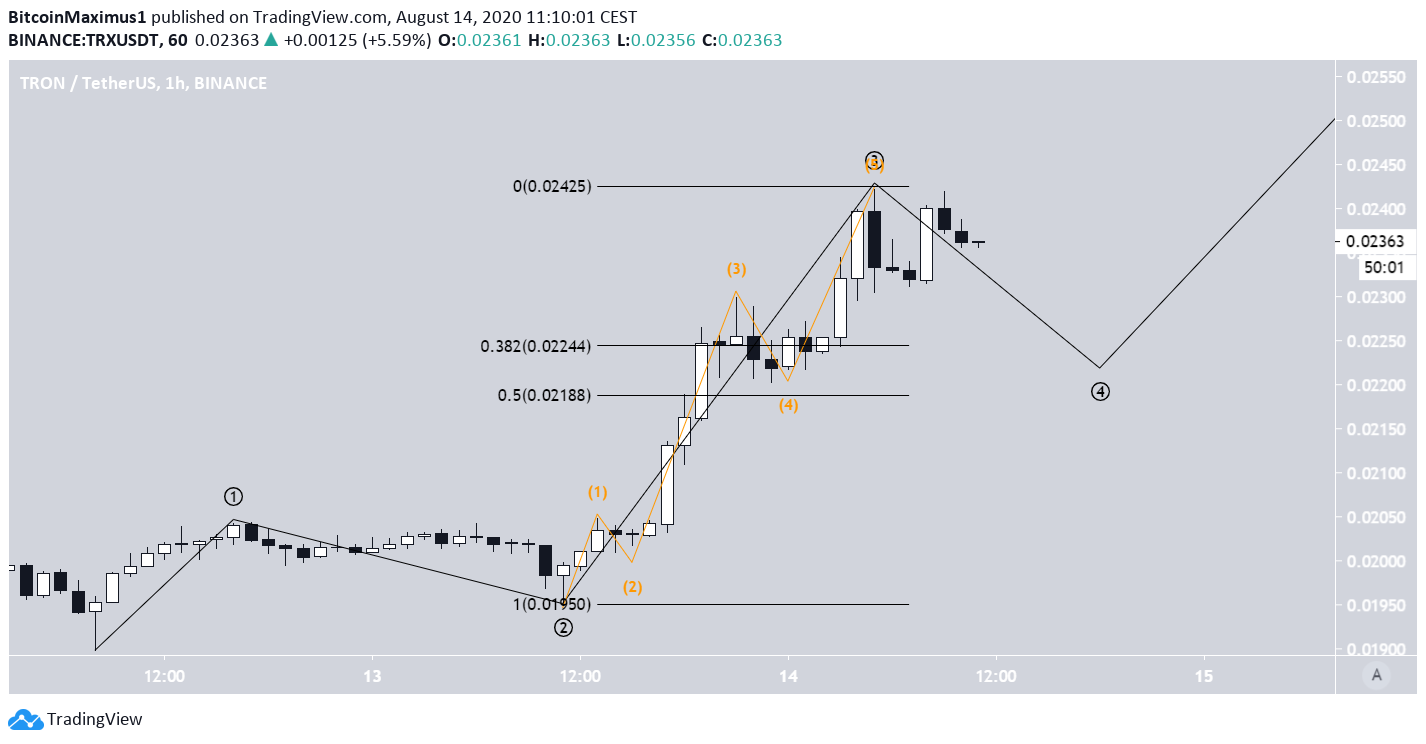
Prior to the breakout, it’s possible that the price already began an impulsive five-wave formation. In this scenario, TRX appears to have just completed the third wave.
Considering the wave 2 correction happened over such a long period of time, wave 4 is most likely to be a bit shorter.
A possible reversal area for the continuation of the trend could fall between the 0.382-0.618 Fib levels of the entire upward move, at approximately $0.218-$0.224.
TRX/BTC
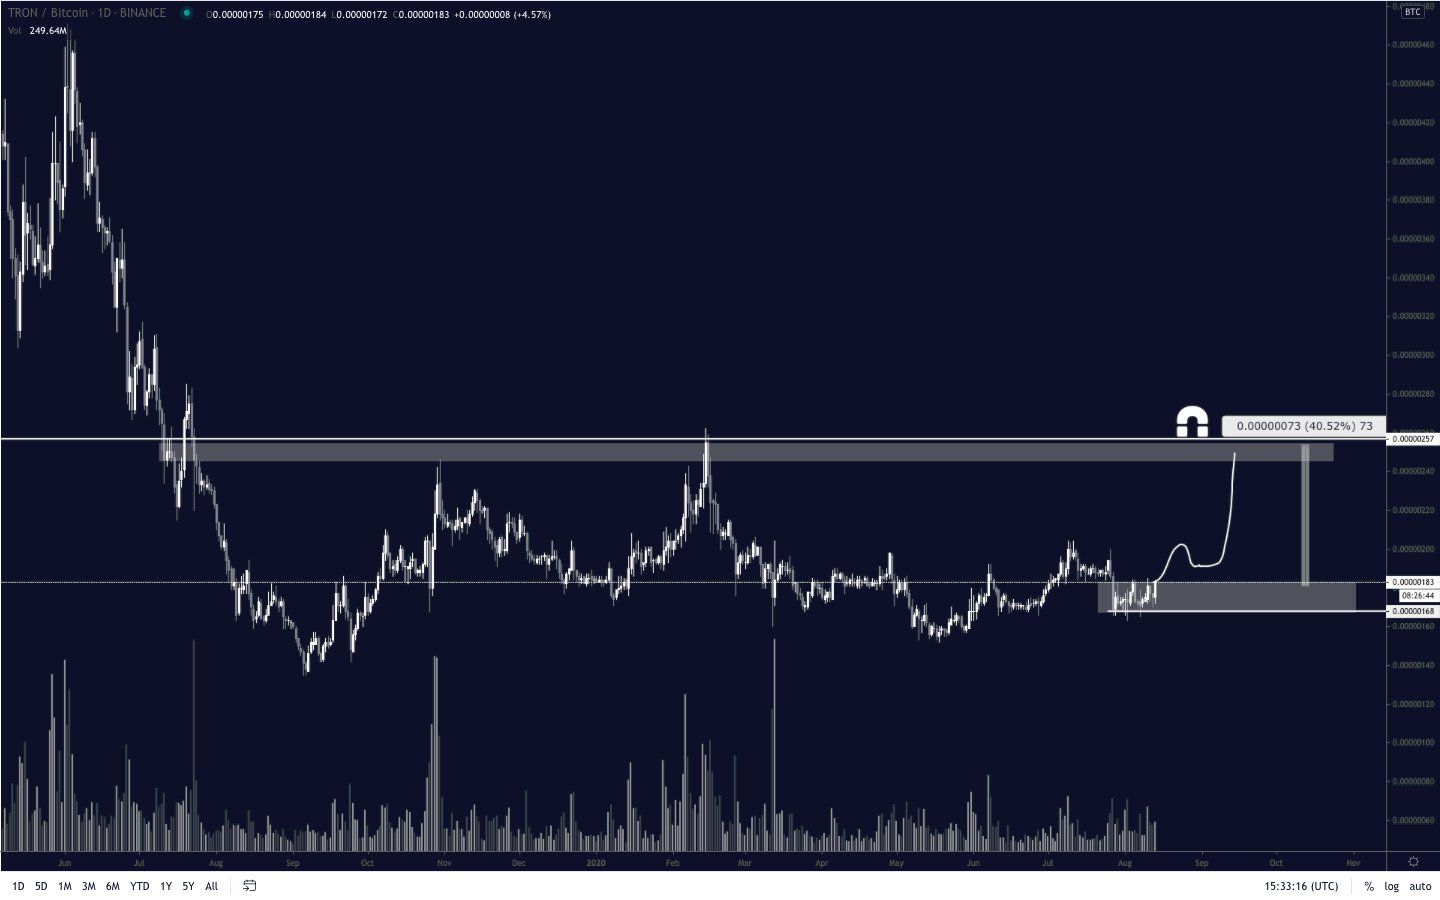
Cryptocurrency trader @pentosh1 stated that the TRX price is likely to continue increasing towards 253 sats.
Just fomo’d into $TRX. It looks pretty pumpy. It’s been a very long time since I’ve owned any #tron It pumps now or never imo
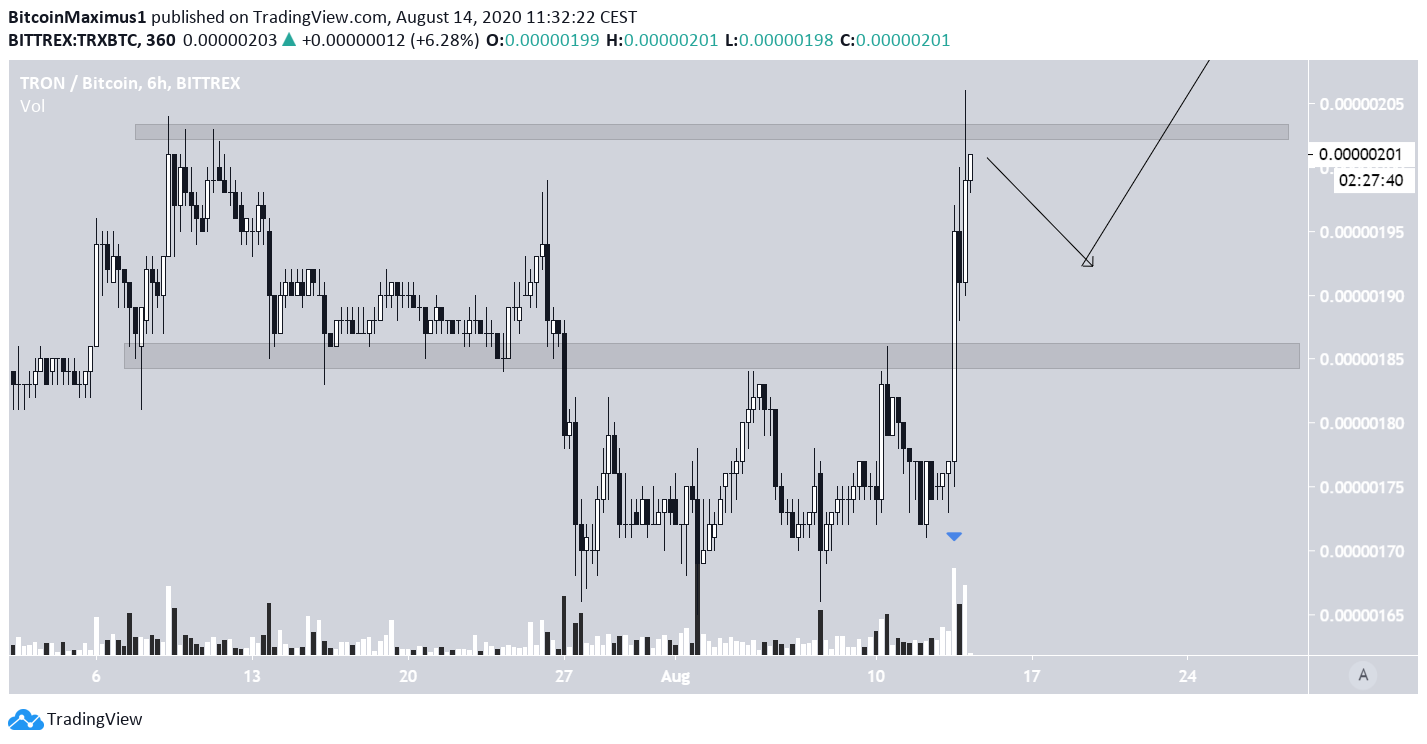
The TRX/BTC chart shows a similar breakout that also transpired with high volume. After breaking out, the price did not revisit the breakout level at all. Instead, it continued all the way to the next resistance area at 203 satoshis, where it is currently trading.
While the price is likely to trade inside these two levels for a period of time, it is expected to eventually break out to reach the 225 satoshi resistance area. An extra bit of steam may even be enough for TRX to hit the 245 sat target that was outlined in the tweet.