


Despite its increase during the marketwide crash of Sept 2-4, the TRON (TRX) price was rejected at an important resistance area and has lost the majority of its gains made during the previous week.
During the week of Aug 31-Sept 6, the majority of the cryptocurrency market decreased considerably. TRX was one of the few that moved in the opposite direction, at one point having increased by 45% with a high of $0.049.
However, the higher prices could not be sustained, and TRX created a long upper-wick before dropping sharply.
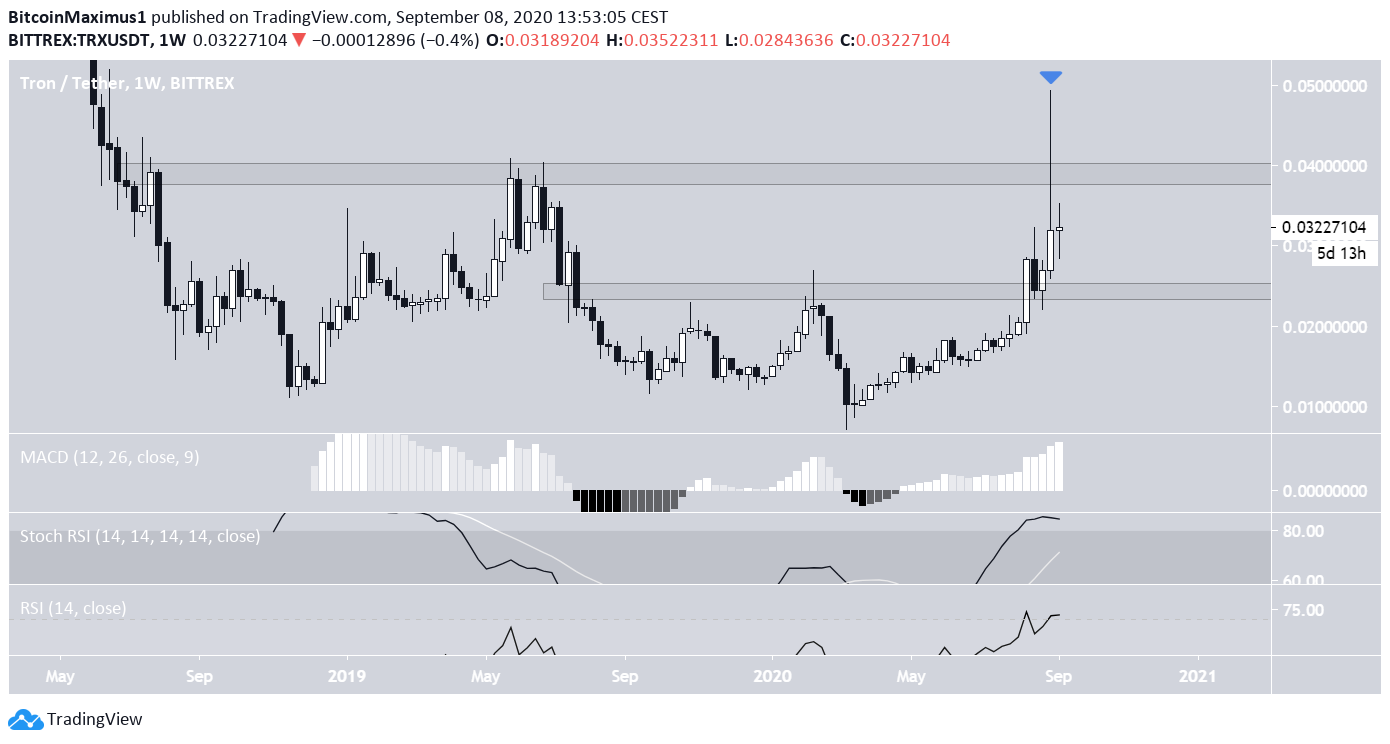
TRX Long-Term Range
At the time of press, TRX was trading between the long-term resistance and support levels at $0.04 and $0.024, respectively.
While technical indicators have recorded overbought levels, there is no clear sign of weakness yet, which would most likely present in the form of bearish divergence or a bearish cross.
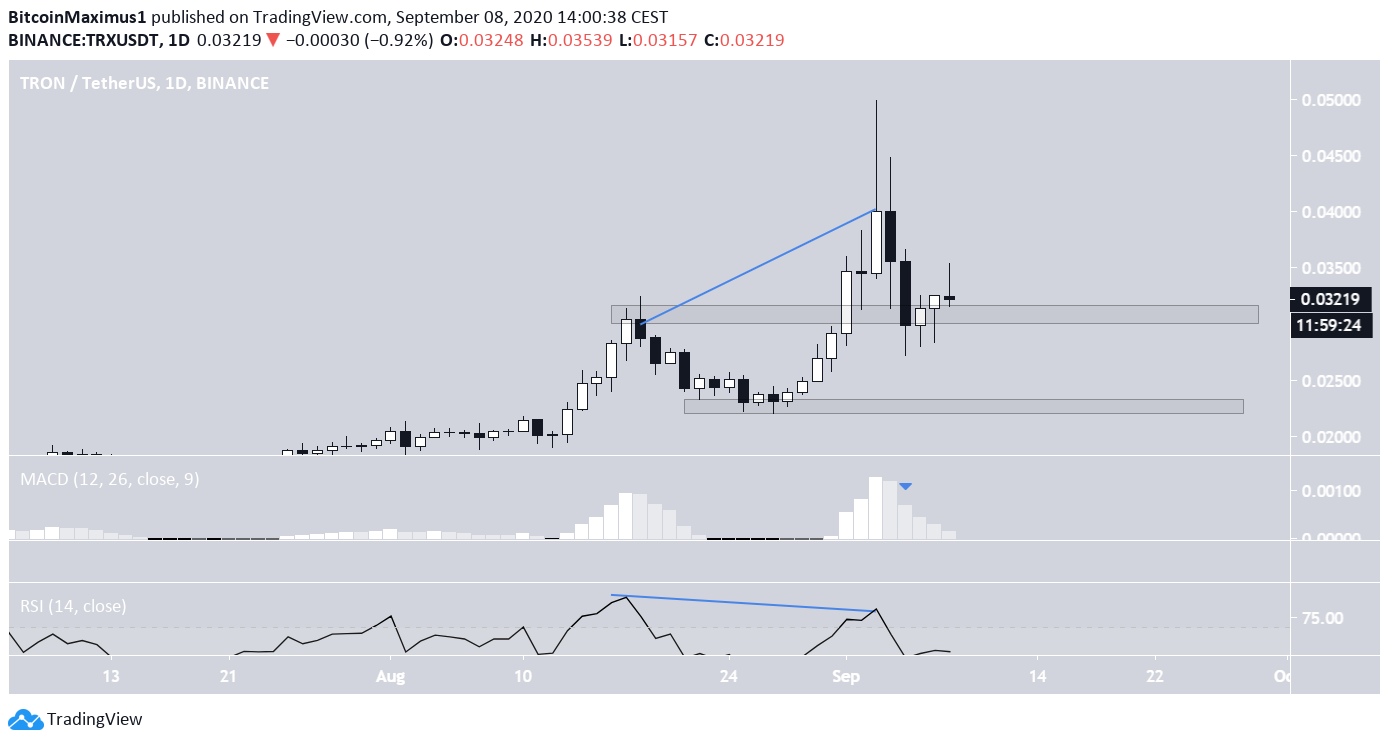
Short-Term Weakness
The daily chart is less bullish than its weekly counterpart. The decrease was combined with significant bearish divergence in the daily RSI. Furthermore, the MACD has begun to decrease, nearly crossing into negative territory.
While the price is still holding up above support, the upper wicks and bearish candlesticks have been bigger than their bullish counterparts.
If the price breaks down from the minor $0.031 support area, it could decrease back towards $0.024.
The 4-hour chart is even more bearish. After a breakdown from an ascending support line, the price is in the process of validating the levels as resistance.
If the price gets rejected, we would expect a decrease back towards the previously mentioned $0.024 support area.

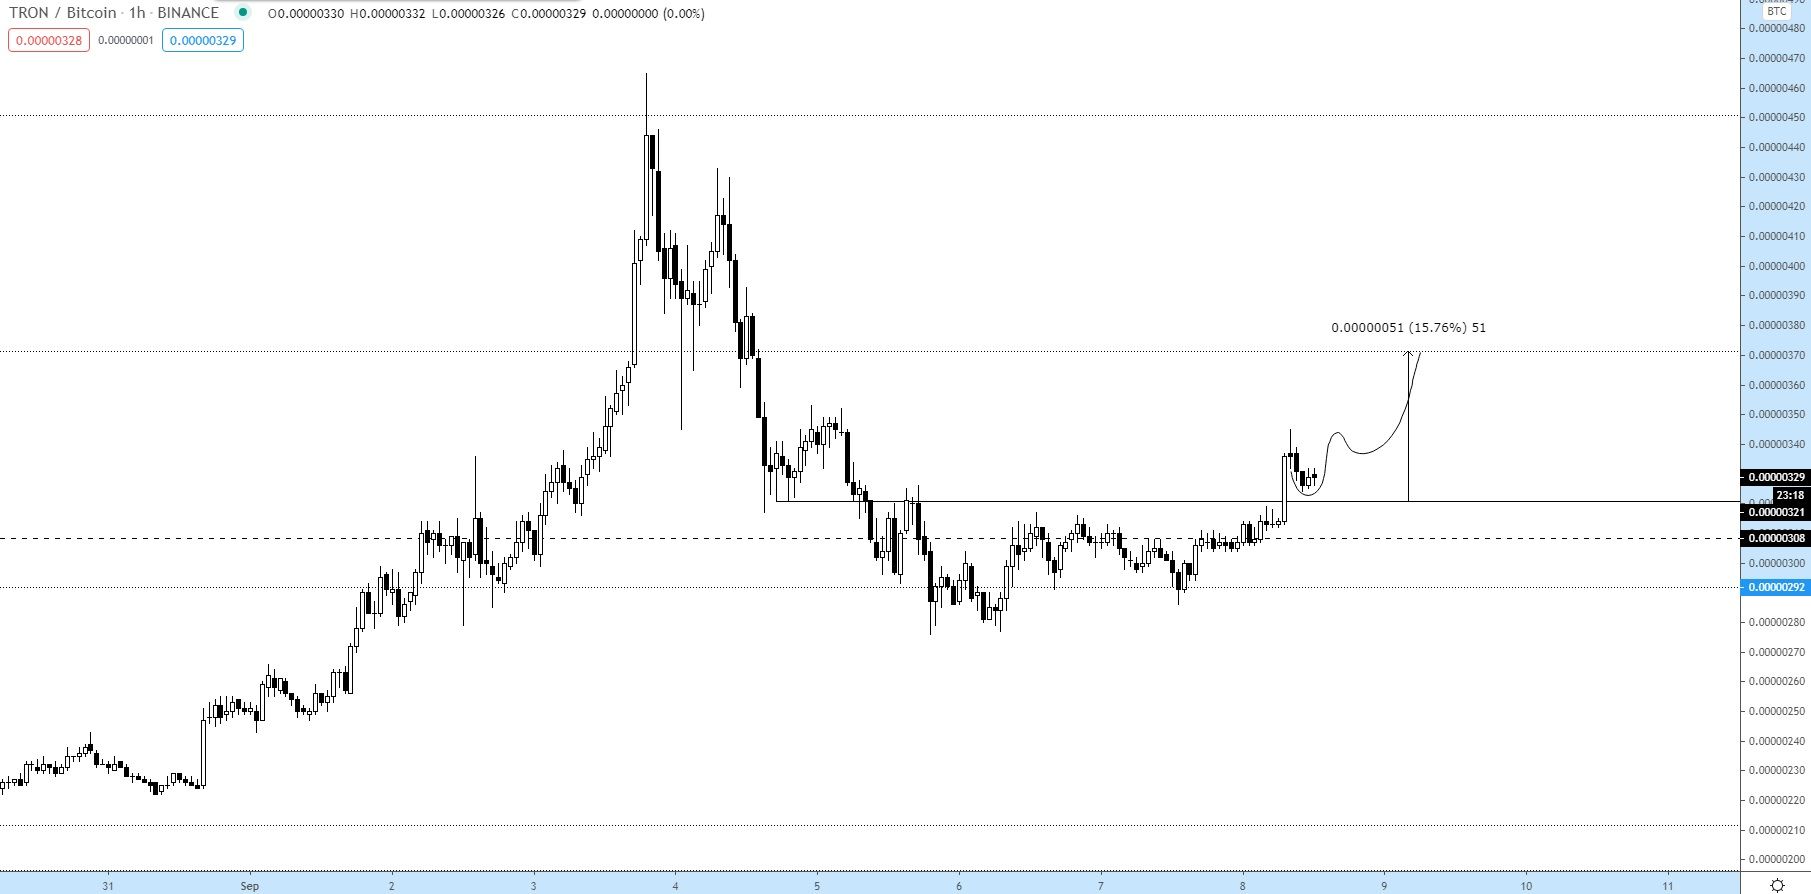
TRX/BTC
Cryptocurrency trader @TheEurosniper outlined a TRX/BTC chart that predicts the price increasing by a further 15%, in the short-term.
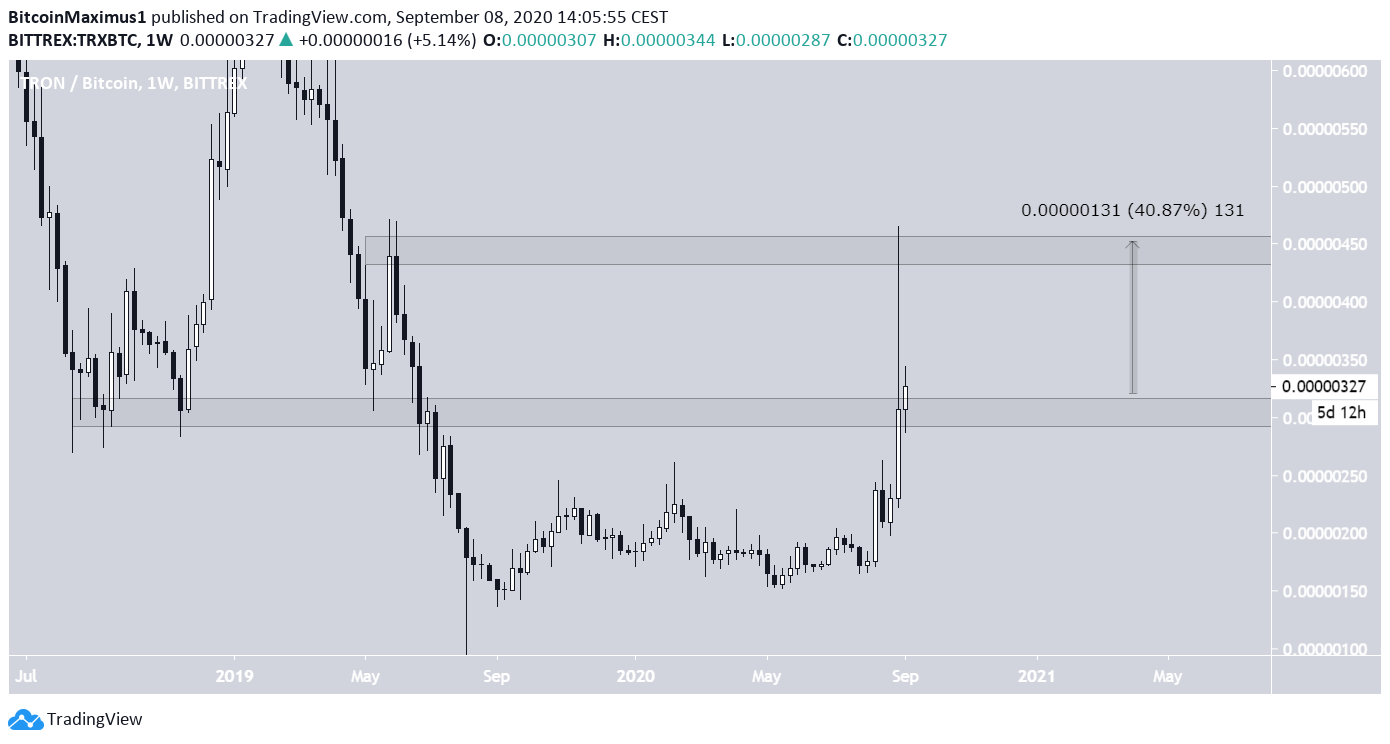
A look at the weekly chart shows that the price might continue trading inside the 300-450 satoshi range. However, a weekly close inside the area has yet to occur.
If the price is successful in doing so, we would expect a re-test of the 450 satoshi resistance area, which is nearly 31% above the current price.
For BeInCrypto’s latest Bitcoin (BTC) analysis, click here!


