
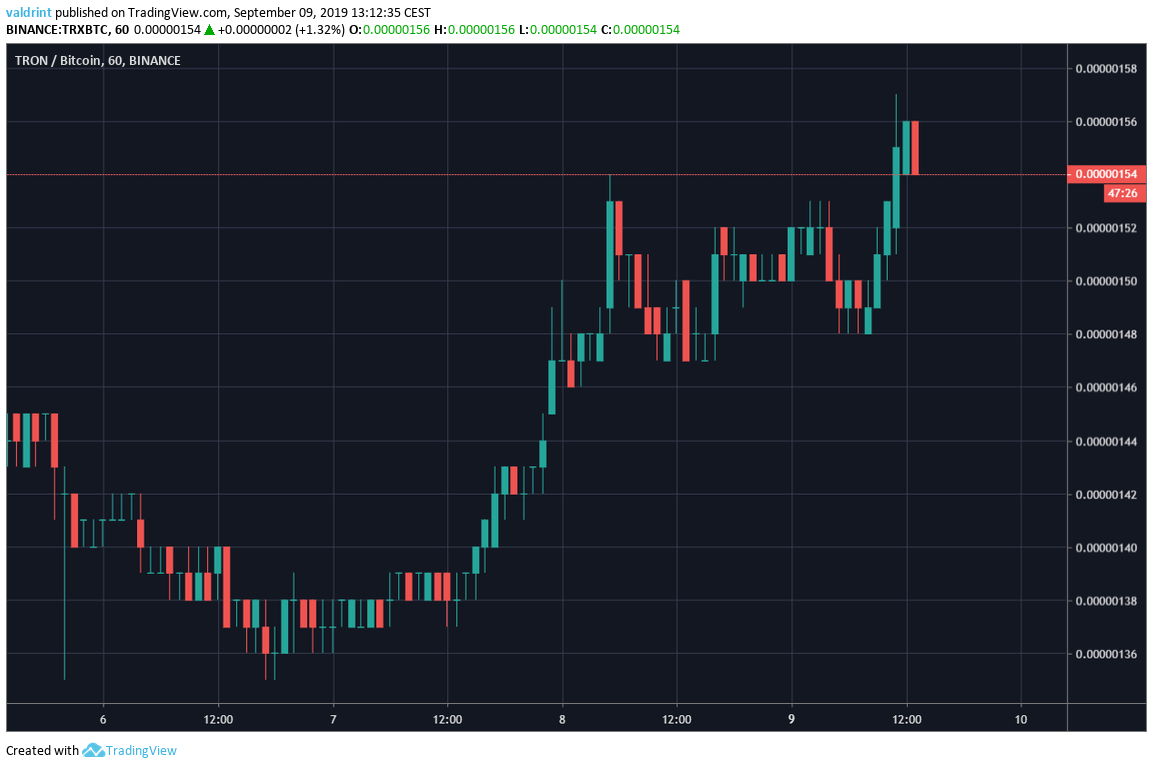
On September 6, 2019, the TRX price reached a low of 135 satoshis. An upward move began and TRX reached a high of 154 satoshis on September 8. After a brief decrease, it reached a higher high of 156 satoshis the next day.
Will TRX continue to increase or is there a reversal in store? Continue reading below if you are interested in finding out.
For our previous analysis, click here.
TRON Price: Trends and Highlights for September 9
- TRX/BTC is following a descending resistance line.
- There is a significant support area at 140 satoshis.
- TRX is facing resistance from the 10- and 20-day moving averages.
- There is resistance at 160 satoshis.
- There is short-term bearish divergence developing in the RSI.
Long-Term Support
A look at the weekly time-frame shows us that TRX has reached a minor support area.
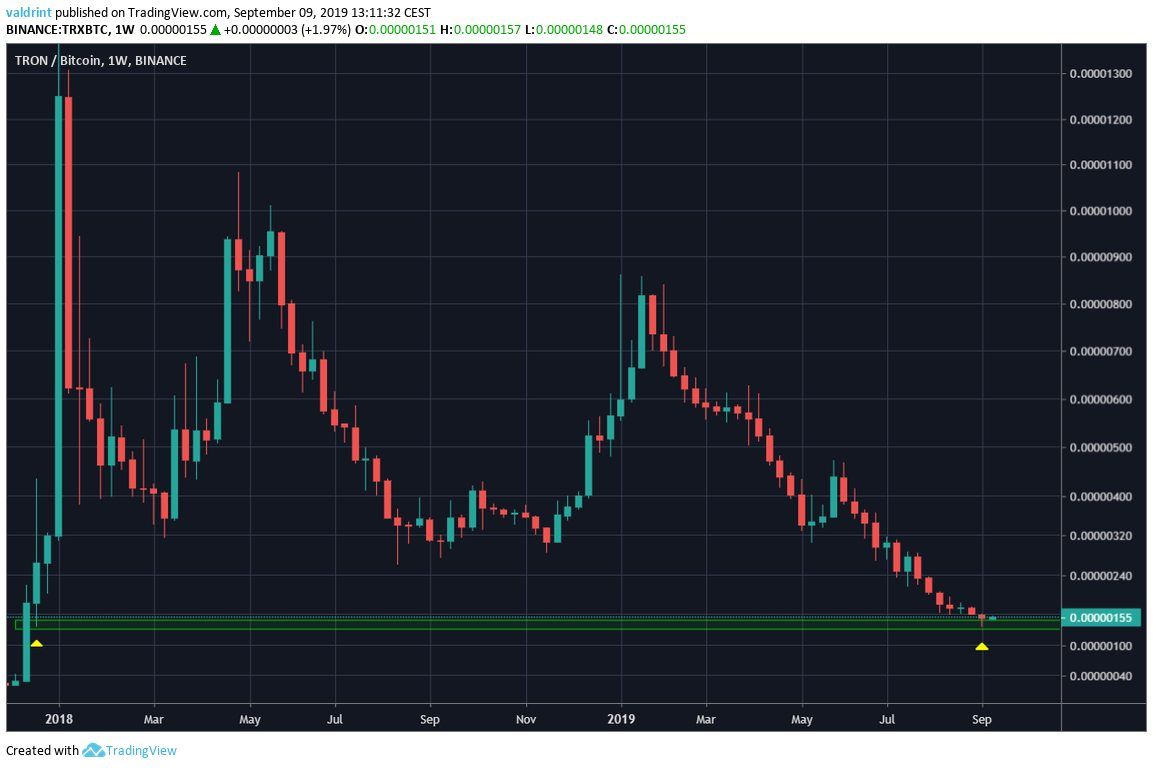
The support area is found at 140 satoshis.
Most notably, it acted as support during the upward movement of December 2017, creating a long lower weekly wick.
Once the price reached this area in September 2019, it initiated the upward move discussed in the introduction.
Descending Resistance Line
A look at the daily time-frame shows that TRX has been following a descending resistance line since August 4.
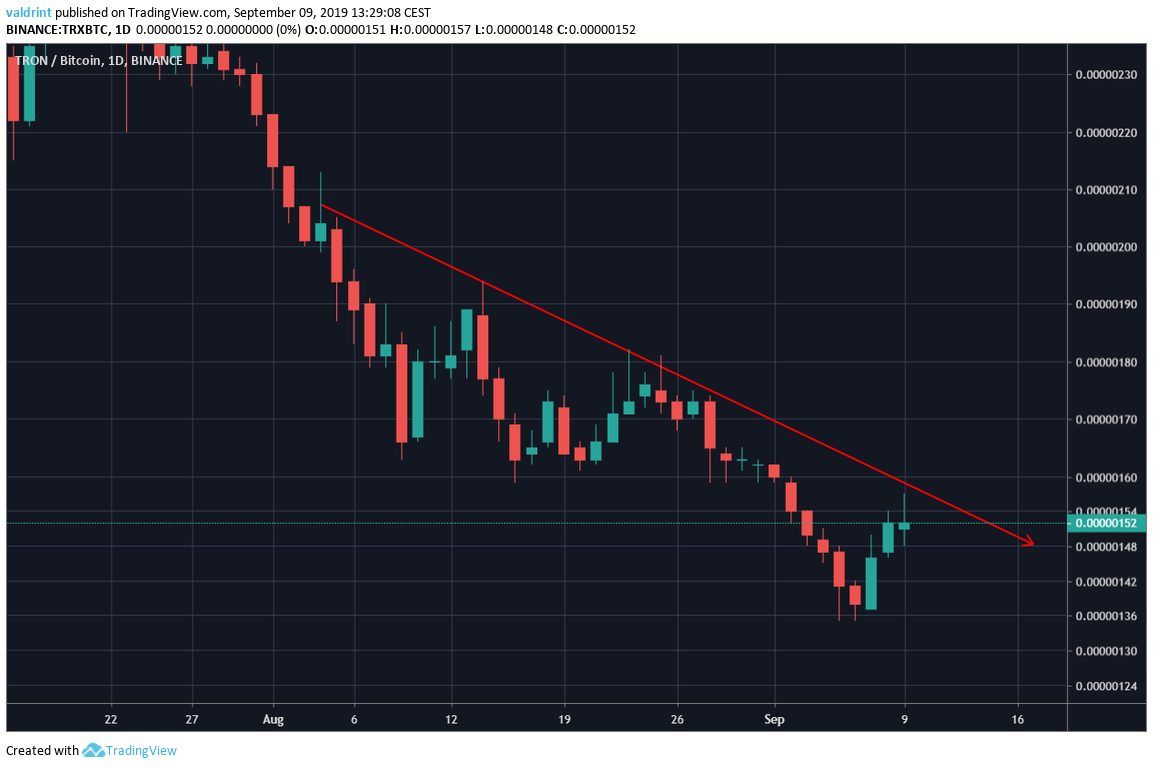
The line has been touched four times.
At the time of writing, TRX briefly reached the resistance line before decreasing slightly.
Incorporating daily moving averages (MA) increases the validity of the resistance line.
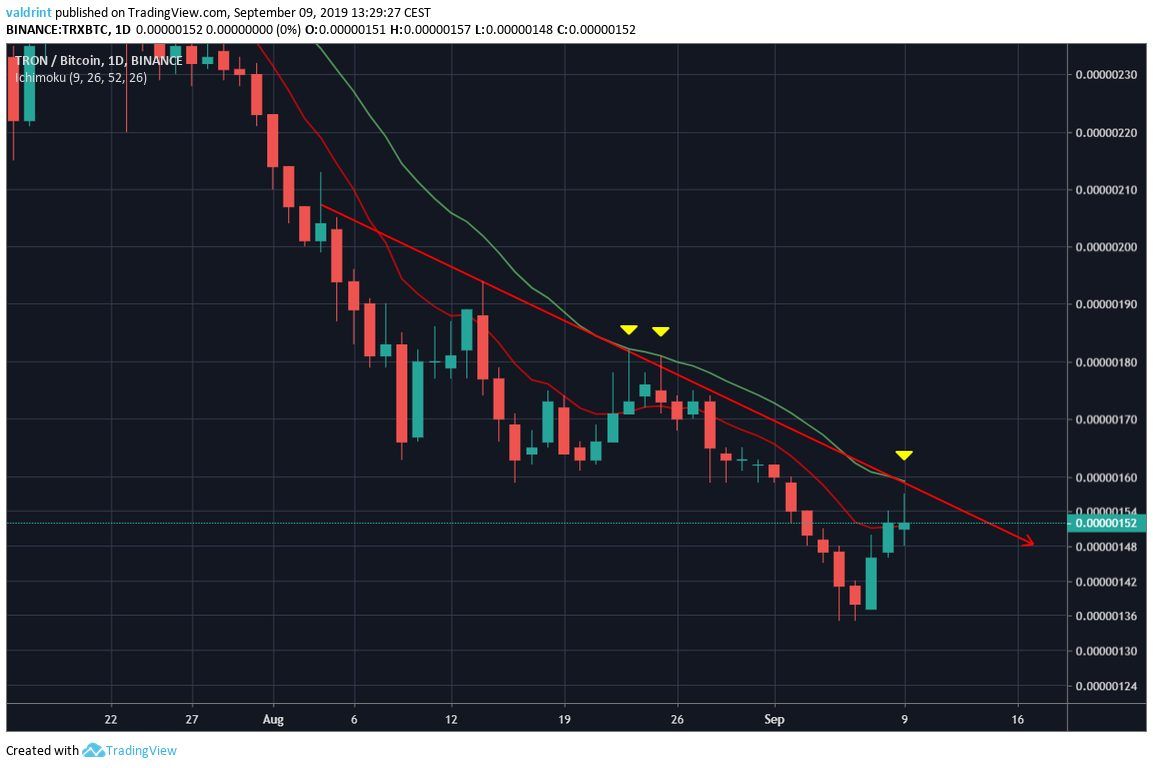
The price is trading right on line with the 10-day MA.
However, it is trading below the 20-day one, which corresponds with the descending resistance line.
Previously, once the Tron price reached the MA, it immediately decreased.
At the time of writing, it seems as if it is in the process of doing so.
Let’s take a look at the short-term to see when this decrease might occur.
Bearish Divergence
Looking at the two-hour time-frame, we can see an additional minor resistance area.
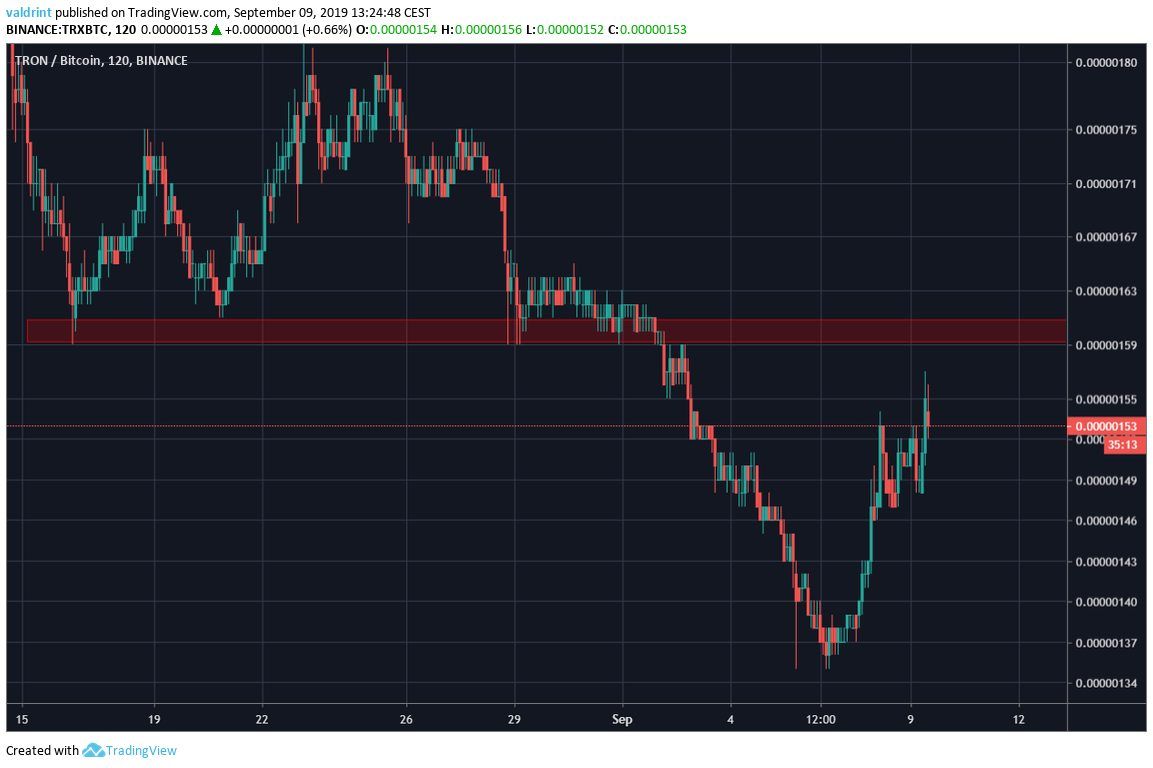
The resistance area is found at 160 satoshis.
While the Tron price has not actually reached it, it has made highs of 157 satoshis.
However, we can see that the upward move has lost strength once we incorporate the RSI into the analysis:
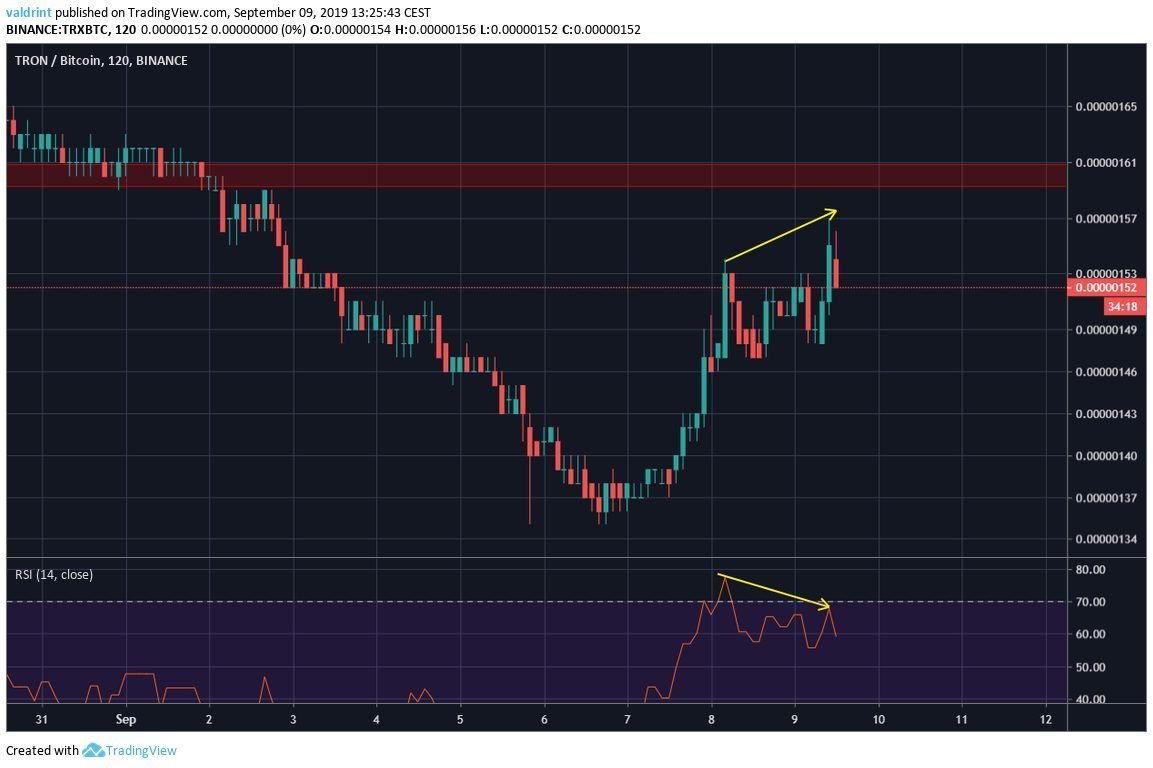
It has been generating bearish divergence, most notably during the higher highs of September 8 and 9.
Combined with the significant resistance discussed previously, this makes us believe that TRX will soon begin to decrease, and again reach the support area of 140 satoshis.
Tron Price Summary
The TRX price is following a descending resistance line.
According to our analysis, it is likely to decrease and reach the support area of 140 satoshis again.
For trading purposes, we consider TRX a sell for short/medium-term time-frames.
However, a stop loss above the descending resistance line (160 satoshis) is recommended.
Do you think the TRX price will break out above the resistance line? Let us know in the comments below.
Disclaimer: This article is not trading advice and should not be construed as such. Always consult a trained financial professional before investing in cryptocurrencies, as the market is particularly volatile.
Images are courtesy of Shutterstock, TradingView.
