The Tron (TRX) price has completed a short-term bullish pattern and is making its third attempt at breaking out above an important resistance area.
Current Resistance
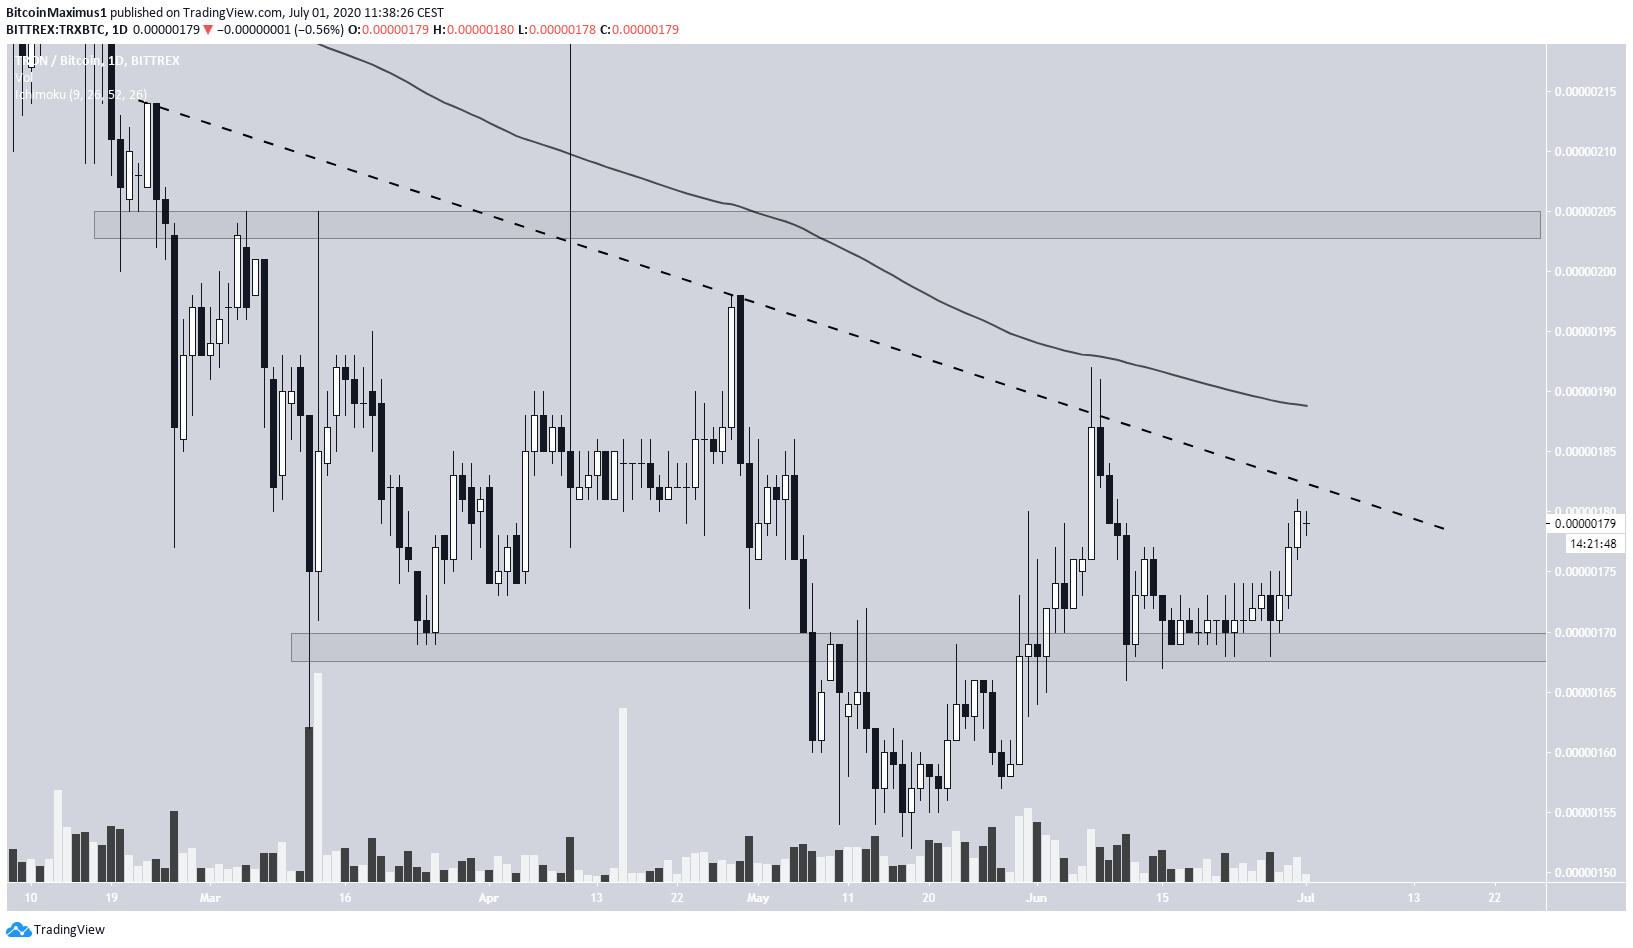
The TRX price has been following a descending resistance line since February 24, currently trading only slightly below it. The price has been rejected four times by this line, until now.
However, the latest movement appears bullish. TRX initially lost the 170 satoshi support area, but reclaimed it afterward and has since begun moving upward.
However, even if the price breaks out, it would face resistance from the 200-day moving average (MA), which rejected the price on June 8. After that, the next closest resistance area is found at 205 satoshis.
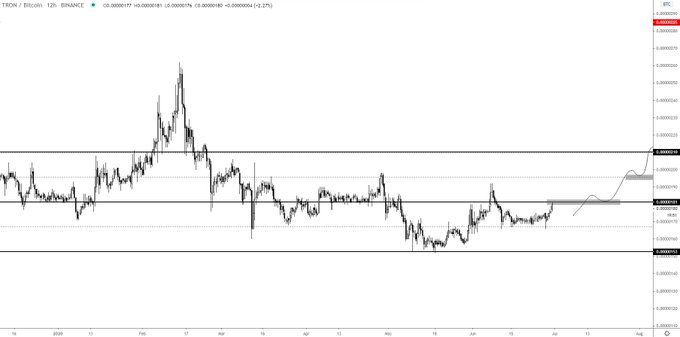
Cryptocurrency trader @TheEurosniper explains that the Tron (TRX) price could soon break out and head towards the range high at 210 satoshis. This area is only slightly above our resistance since @TheEuroSniper is using a longer-term time-frame.
Tron/Dollar
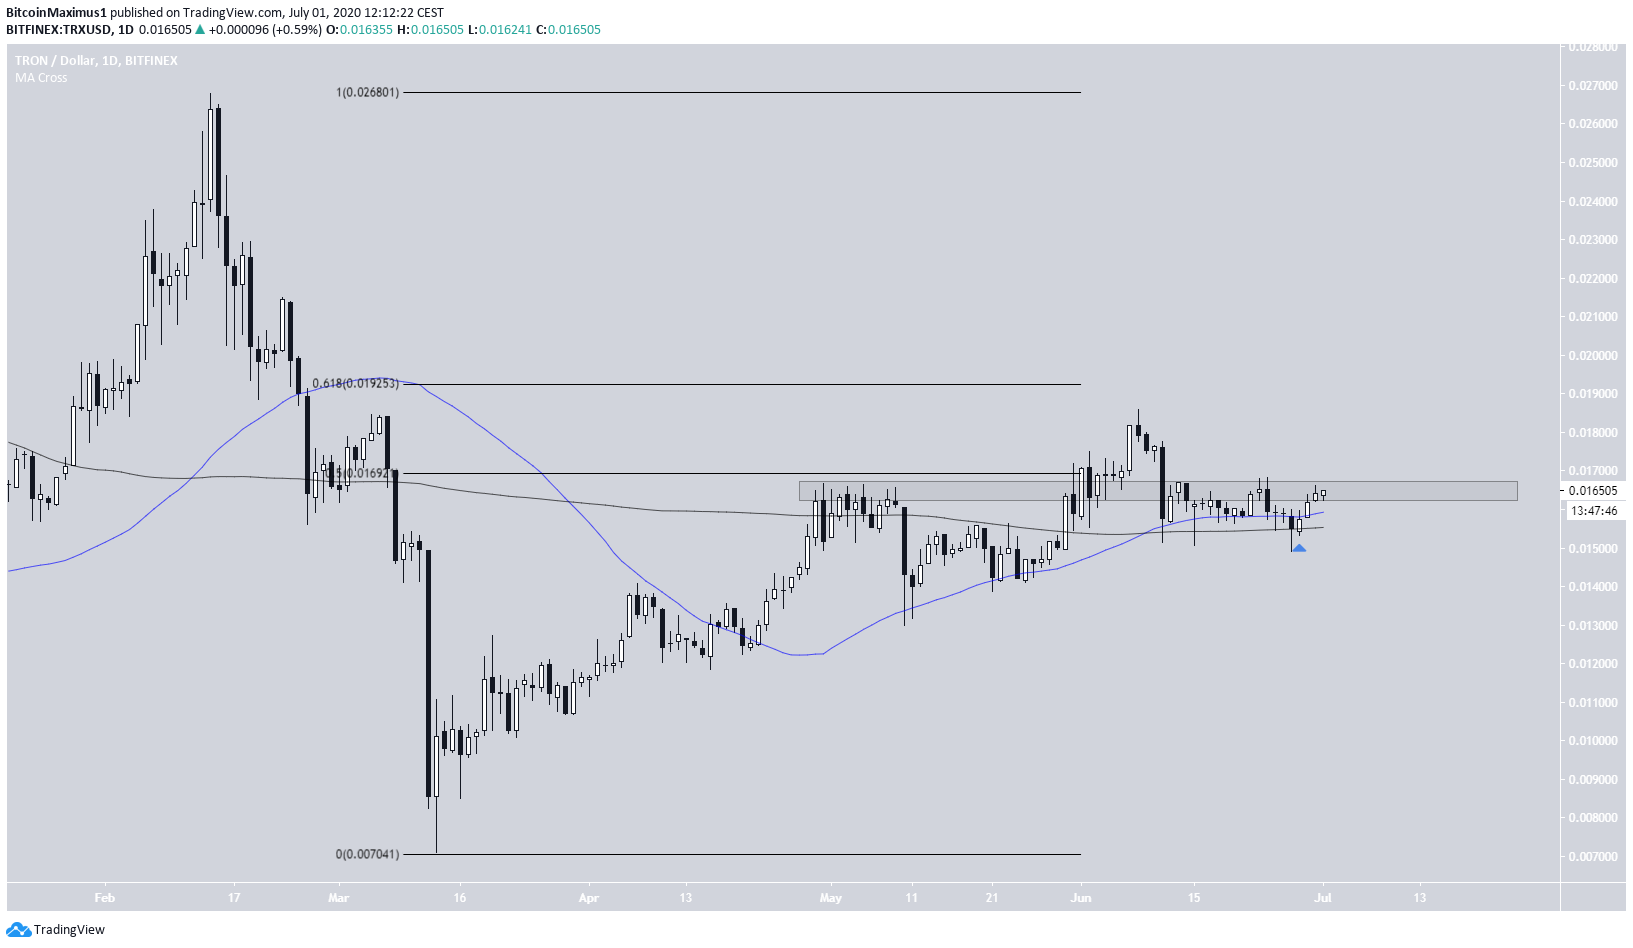
The TRX/USD chart shows that the price is trading very close to the $0.17 resistance area, which is also the 0.5 Fib level of the entire decline beginning from February 14. While the price moved above this area on June 7, it proceeded to fall below it shortly afterward. Therefore, the current move may be a validation of this same resistance area.
However, the price is trading above the 50 and 200-day MAs, which have already made a bullish cross whether the price declines below these MAs or moves above the previously mentioned resistance area will likely determine the future trend.
For the price action to be considered bullish, TRX has to reach a close above the next resistance area, the 0.618 Fib level, at $0.192.
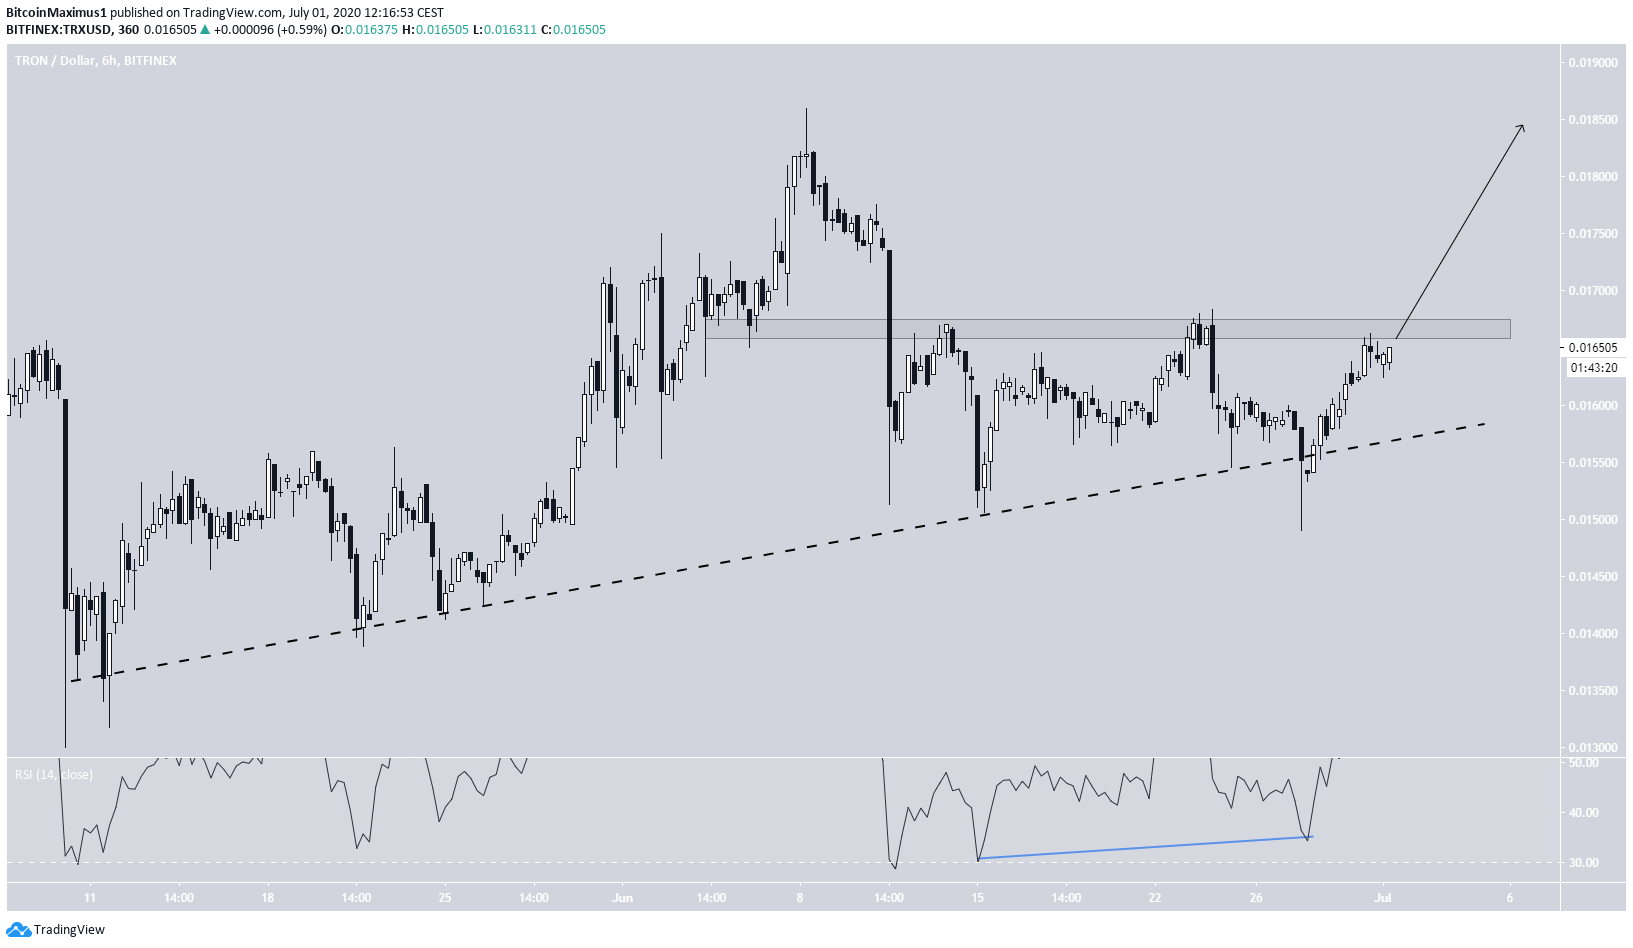
The shorter-term chart reveals that TRX is following a rising support line, and has been doing so since May 11. Throughout this period, the price has completed a double bottom pattern combined with bullish divergence.
It is currently making its third attempt at breaking out above the minor $0.165 resistance area.
Therefore, it seems likely that TRX will successfully break out above this level and move towards the June highs at $0.185.