
The Total Cryptocurrency Market Cap (CRYPTOCAP) has broken out and validated an important horizontal level as support.
As long as it is trading above it, the trend remains bullish.
Cryptocurrency Cap Re-Tests Resistance
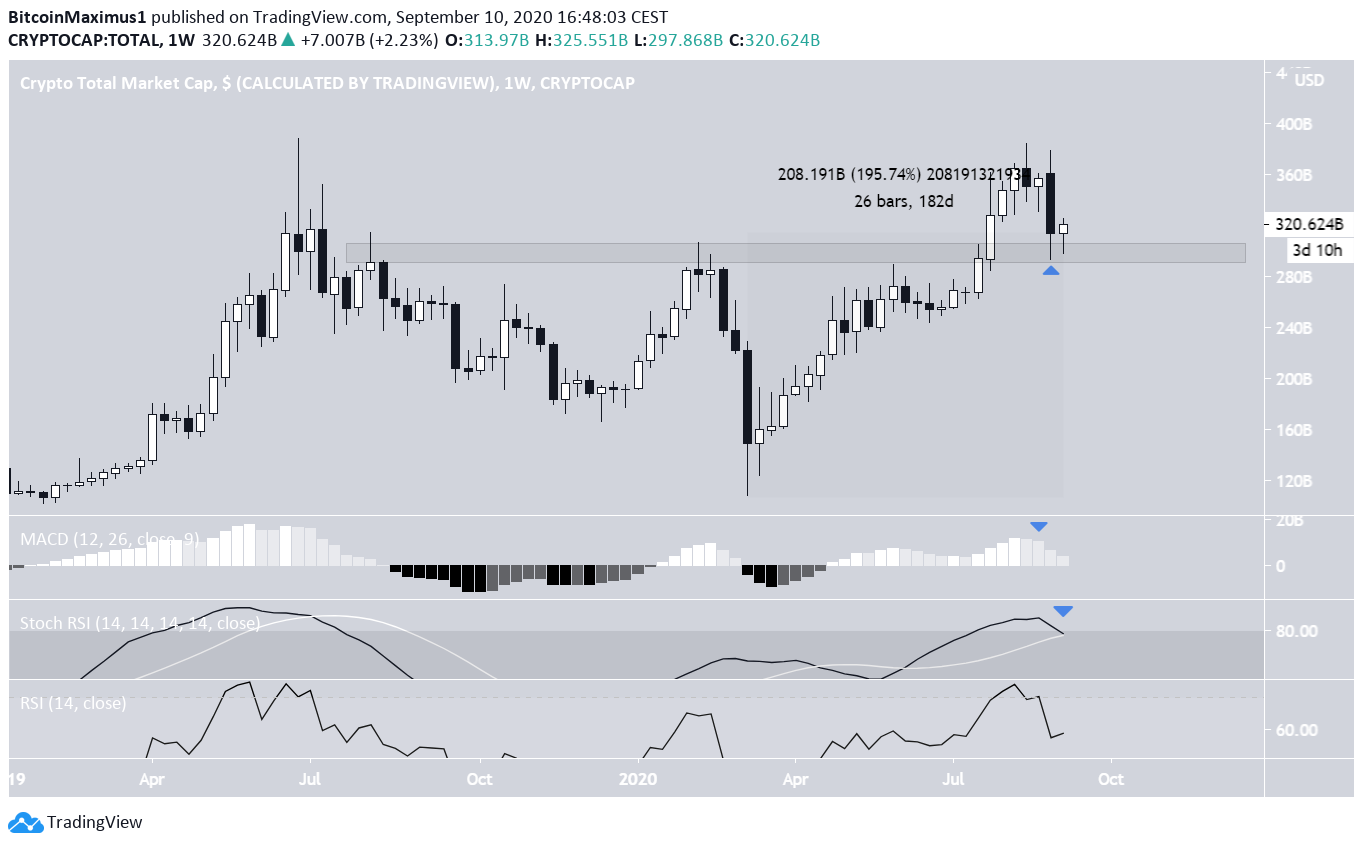
The CRYPTOCAP has increased by 186% since the March crash 186 days ago. The early September losses caused it to return and validate the $300 billion level as support before a slight bounce to ~$320 billion where it currently sits.
Despite the re-test of the previous resistance area as support, technical indicators have turned bearish. The stochastic RSI has made a bearish cross and the MACD has begun to lose momentum. Furthermore, the RSI is decreasing, even if it has not yet generated any bearish divergence.
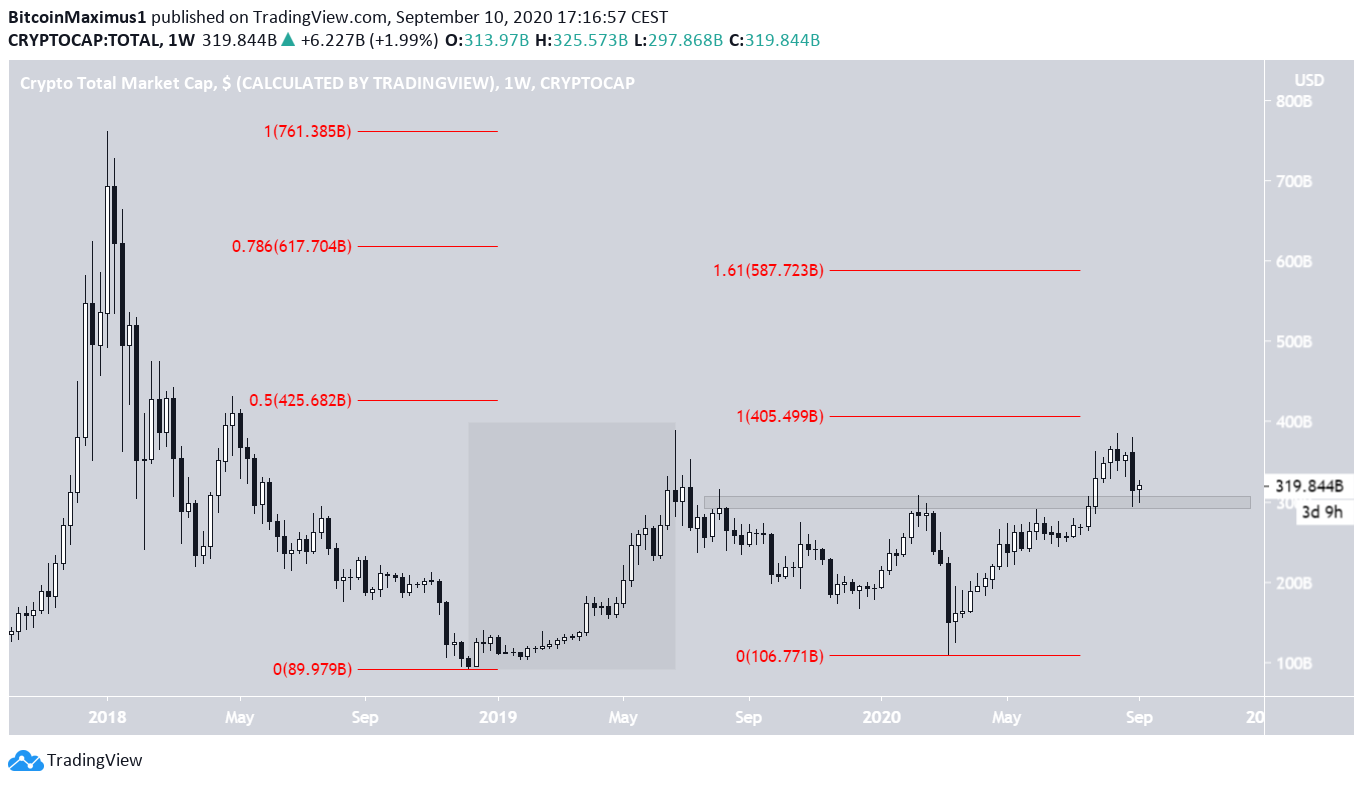
However, even if the current movement is the correction, based on the height of the previous increase (outlined in black), the CRYPTOCAP would be expected to make a high of at least $405 billion (also near the 0.5 Fib level of the entire decrease) or $587 billion (near the 0.786 Fib).
Breakdown From Support
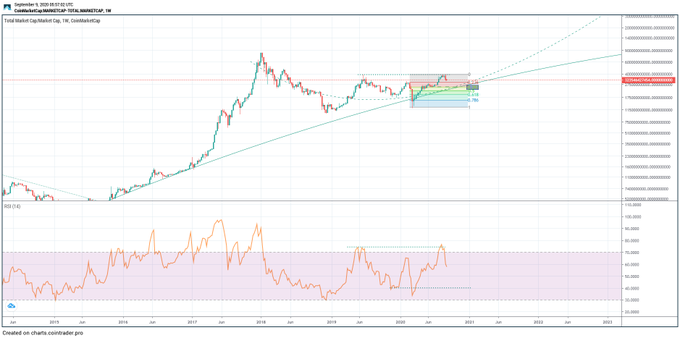
Cryptocurrency trader @Davthewave outlined a total cryptocurrency market cap chart which shows that the cap is trending above the average rate of increase. While this may mean that the rally is overextended, it does not predict when the rate will fall to the mean.
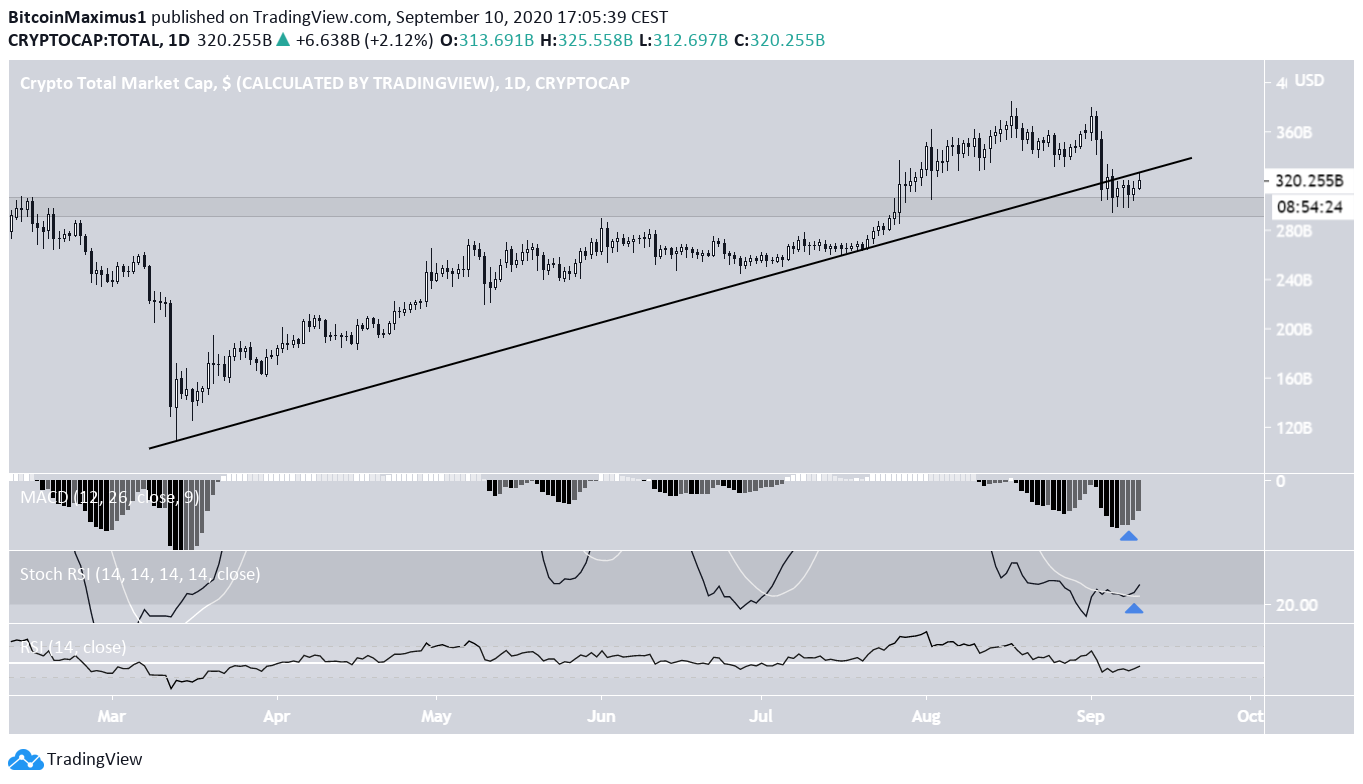
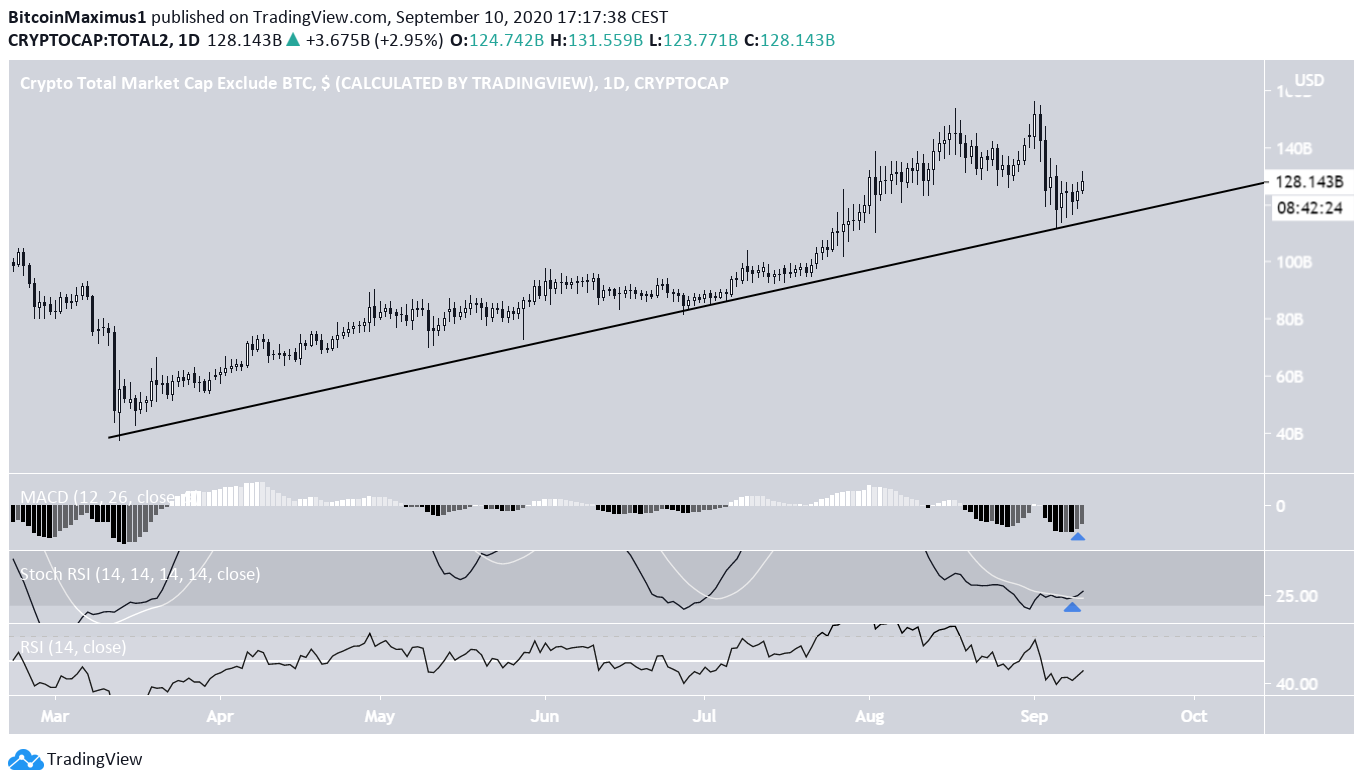
A look at the daily chart gives a conflicting outlook. On the bearish side, the market cap has broken down from an ascending support line that had previously been in place since the March low. In addition, the RSI has fallen below 50 and is facing resistance from it.
On the bullish side, the stochastic RSI has made a bullish cross, and the MACD is increasing.
If the market cap were to reclaim this support line, it would be expected that the trend would continue to be bullish. The opposite would most likely ring true if it breaks down from the current support area.
The market cap, when excluding BTC, has identical readings in technical indicators. However, it has not broken down from its ascending support line, making its outlook more bullish.
Conclusion
To conclude, while the direction of the CRYPTOCAP is unclear, the long-term chart suggests that even if the current movement is a correction, a high of $425 billion and even possibly $685 billion would still be expected prior to another dip.
Whether the CRYPTOCAP reclaims the ascending support line it just broke down from, or breaks down from the current support area, will help determine whether the trend is bullish or bearish.
Due to the lack of a breakdown from its bullish structure, the market cap excluding Bitcoin (BTC) has a more positive outlook than with BTC included.
For BeInCrypto’s latest Bitcoin (BTC) analysis, click here!
