


Unlike June, numerous tokens increased considerably in July. Bitcoin (BTC) increased by 16% while six different tokens posted triple digit increases.
The ten altcoins that increased the most in July are:
- Axie Infinity (AXS) – 629%
- DigitalBits (XDB) – 271%
- Flow (FLOW) – 173%
- The Sandbox (SAND) – 158 %
- Chromia (CHR) – 116%
- Paris Saint-Germain Fan Token (PSG) – 107%
- Quant (QNT) – 88%
- Dego Finance (DEGO) – 83%
- Aavegotchi (GHST) – 60%
- Augur (REP) – 56%
AXS
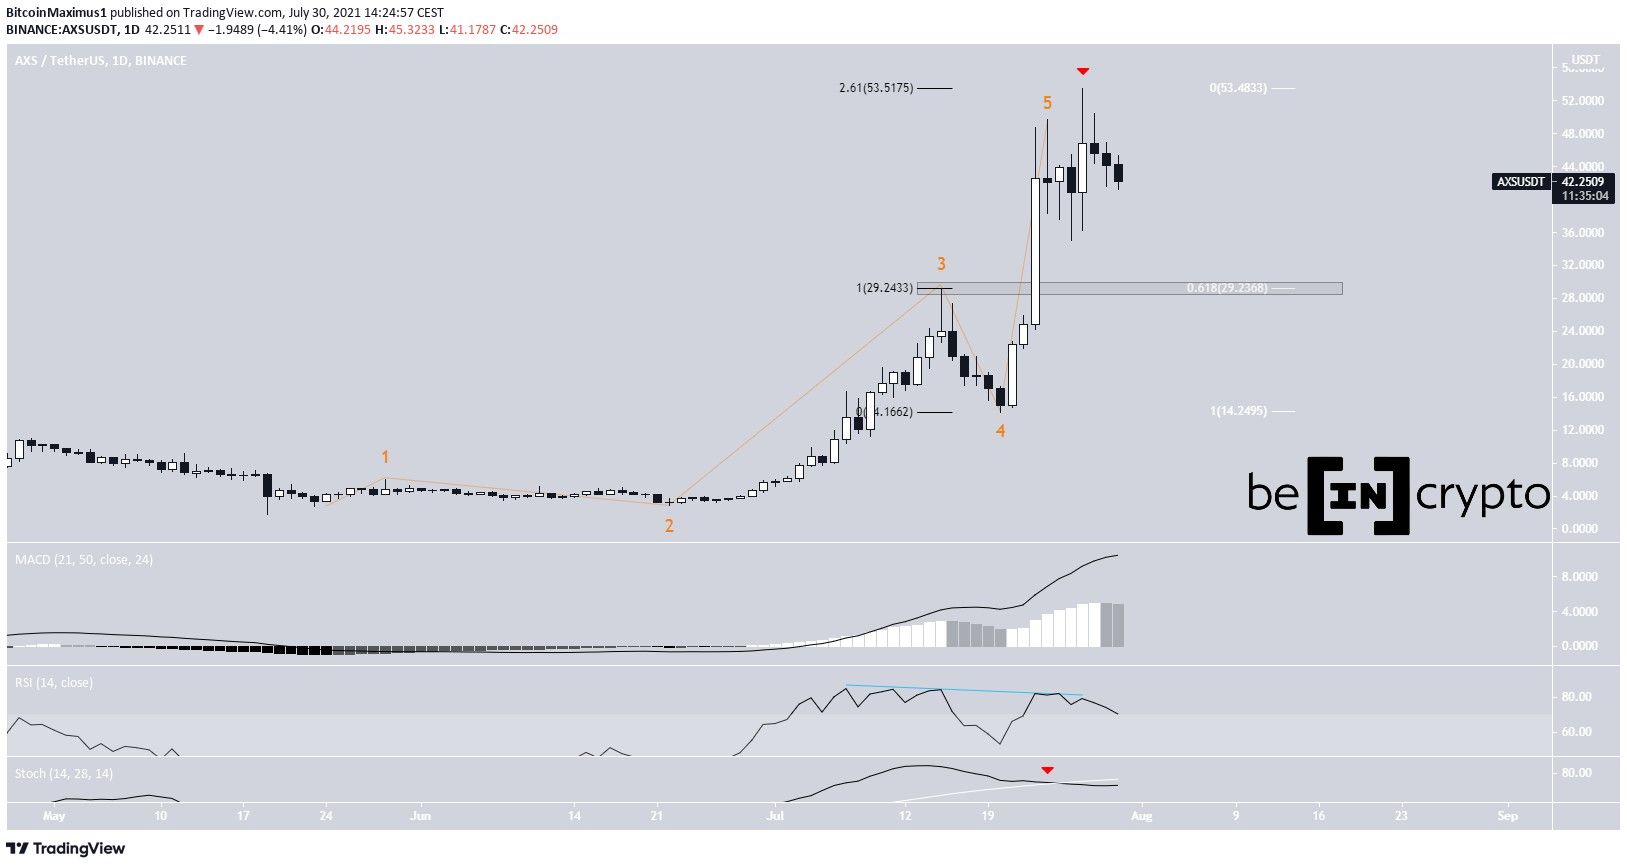
AXS has been moving upwards at an accelerated rate since July 20. This led to a new all-time high price of $53.50 on July 27. The token has been moving downwards since.
The high was made very close to the 2.61 external Fib retracement level (black) when measuring the most recent portion of the increase. Therefore, it is an area in which a top is likely to be reached.
In addition to this, technical indicators are showing signs of weakness. The RSI has generated bearish divergence and the Stochastic oscillator has made a bearish cross (red icon).
Finally, the entire movement looks like a completed five wave bullish impulse.
The closest support level is at $29.35. This is the previous all-time high and the 0.618 Fib retracement support level (white).
XDB
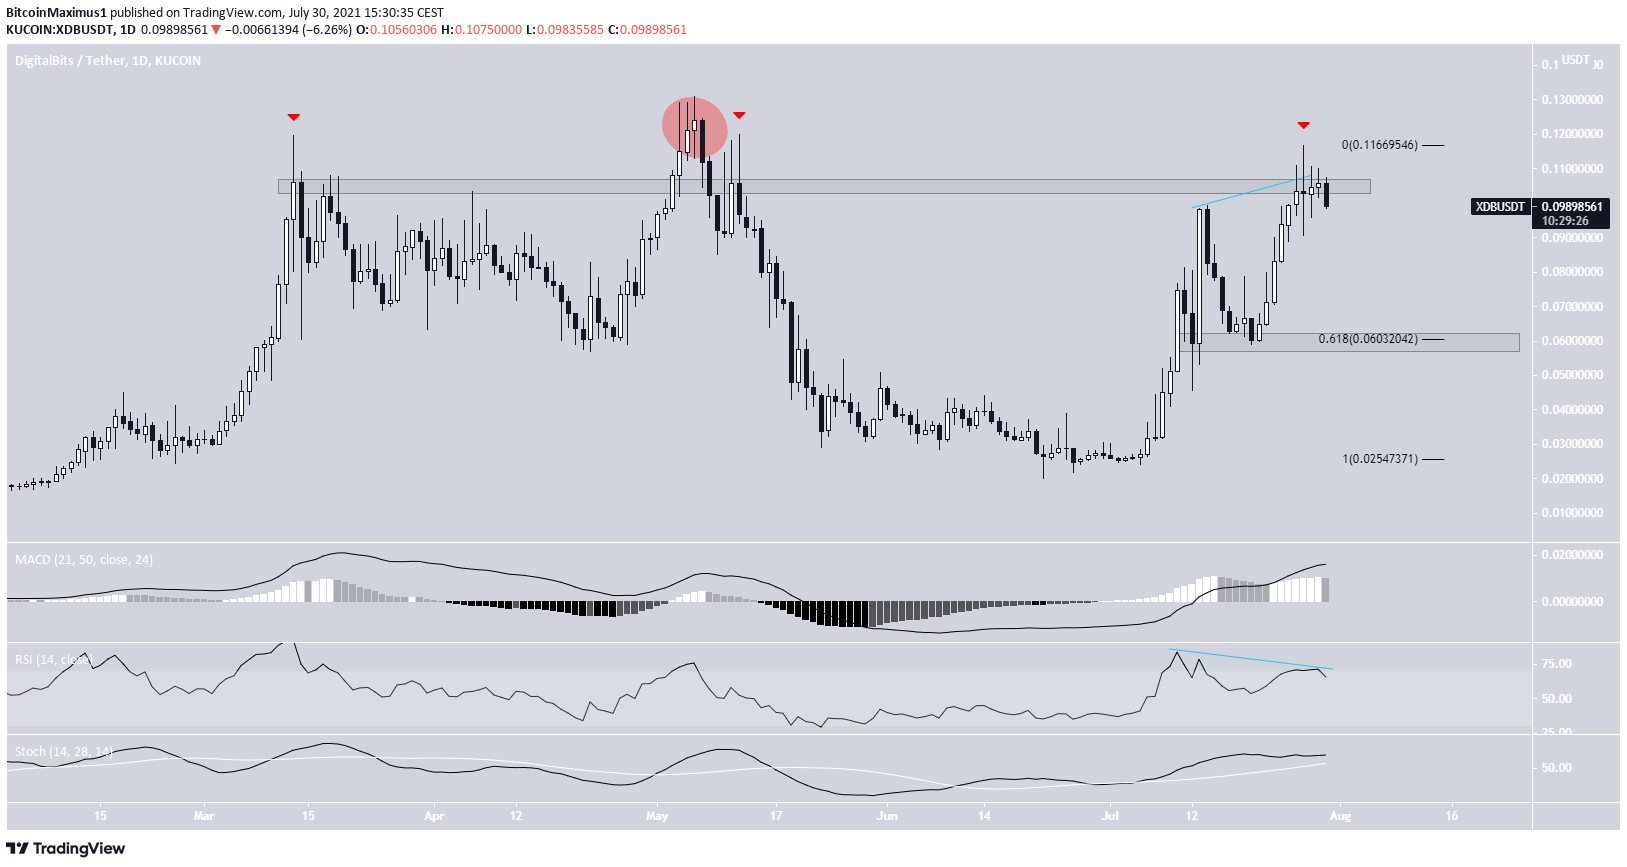
XDB has been moving upwards since June 26. On July 27, it reached a high of $0.116 and decreased, leaving a long upper wick in place.
The rejection was important, since XDB is now trading below the $0.105 horizontal resistance area. With the exception of a deviation on May 5, all forays above this level have left long upper wicks behind (red icons).
Furthermore, the RSI has generated bearish divergence.
The closest support level is at $0.06, the 0.618 Fib retracement support level and a horizontal support area.
FLOW
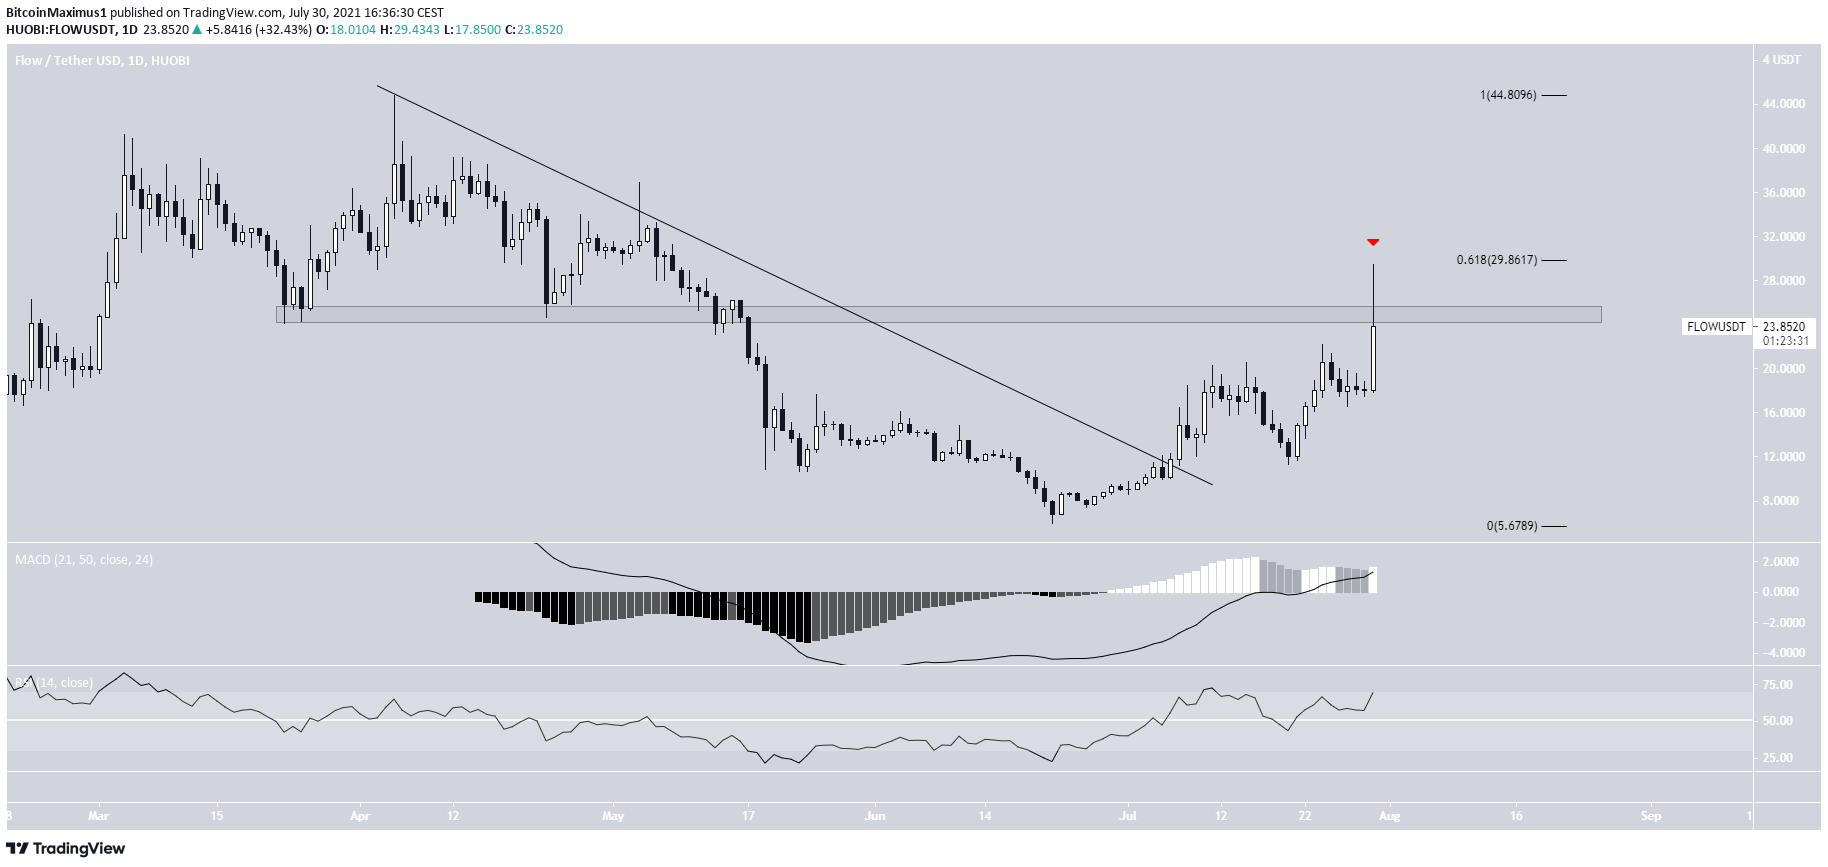
FLOW has been increasing since June 22. On July 6, it broke out from a descending resistance line. It created a higher low on July 20 and has been increasing at an accelerated rate since.
On July 30, the token initiated a strong upward movement and proceeded to reach a high of $29.43. The high was made right at the 0.618 Fib retracement resistance level.
However, the higher prices could not be sustained and FLOW created a long upper wick (red icon). In addition to this, it has now fallen below the $24.50 horizontal resistance area.
Despite the fact that the RSI & MACD are still bullish, the token has to reclaim this level in order for the trend to be considered bullish.
SAND
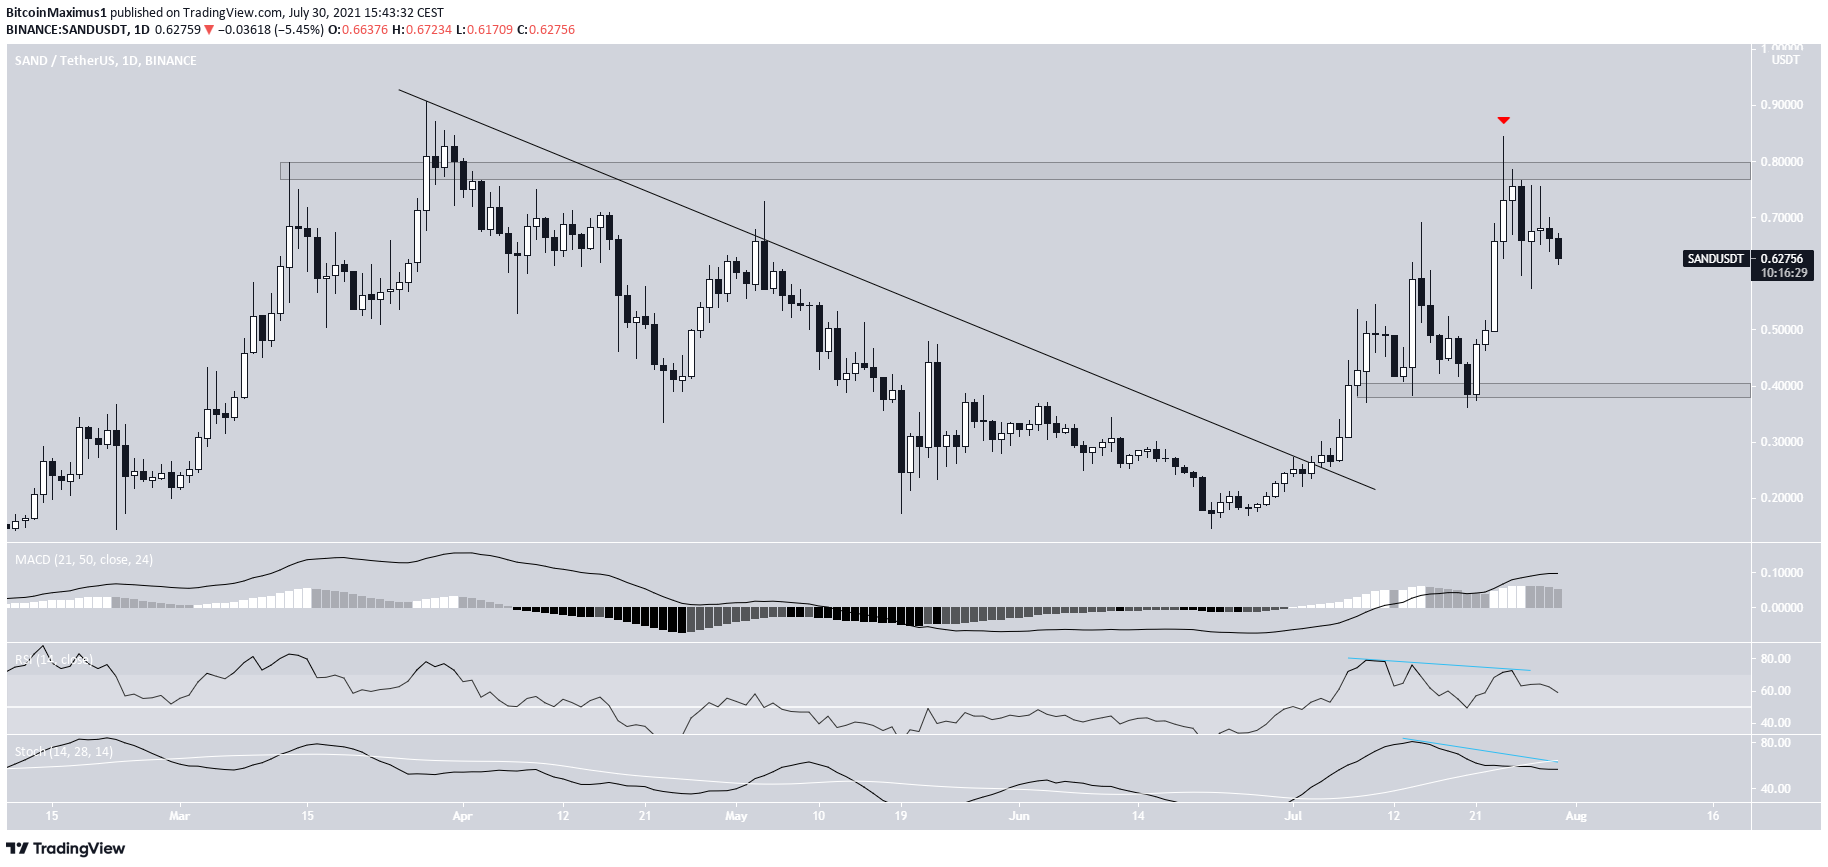
SAND has been moving upwards since June 1. On July 3, it managed to break out from a descending resistance line. This eventually led to a high of $0.845 being reached on July 24.
However, the token decreased shortly afterwards, leaving a long upper wick (red icon) in place. The drop validated the $0.78 horizontal area as resistance. Additionally, the drop was preceded by bearish divergences in the RSI & Stochastic oscillator. The latter has now made a bearish cross.
The closest support level is at $0.040.
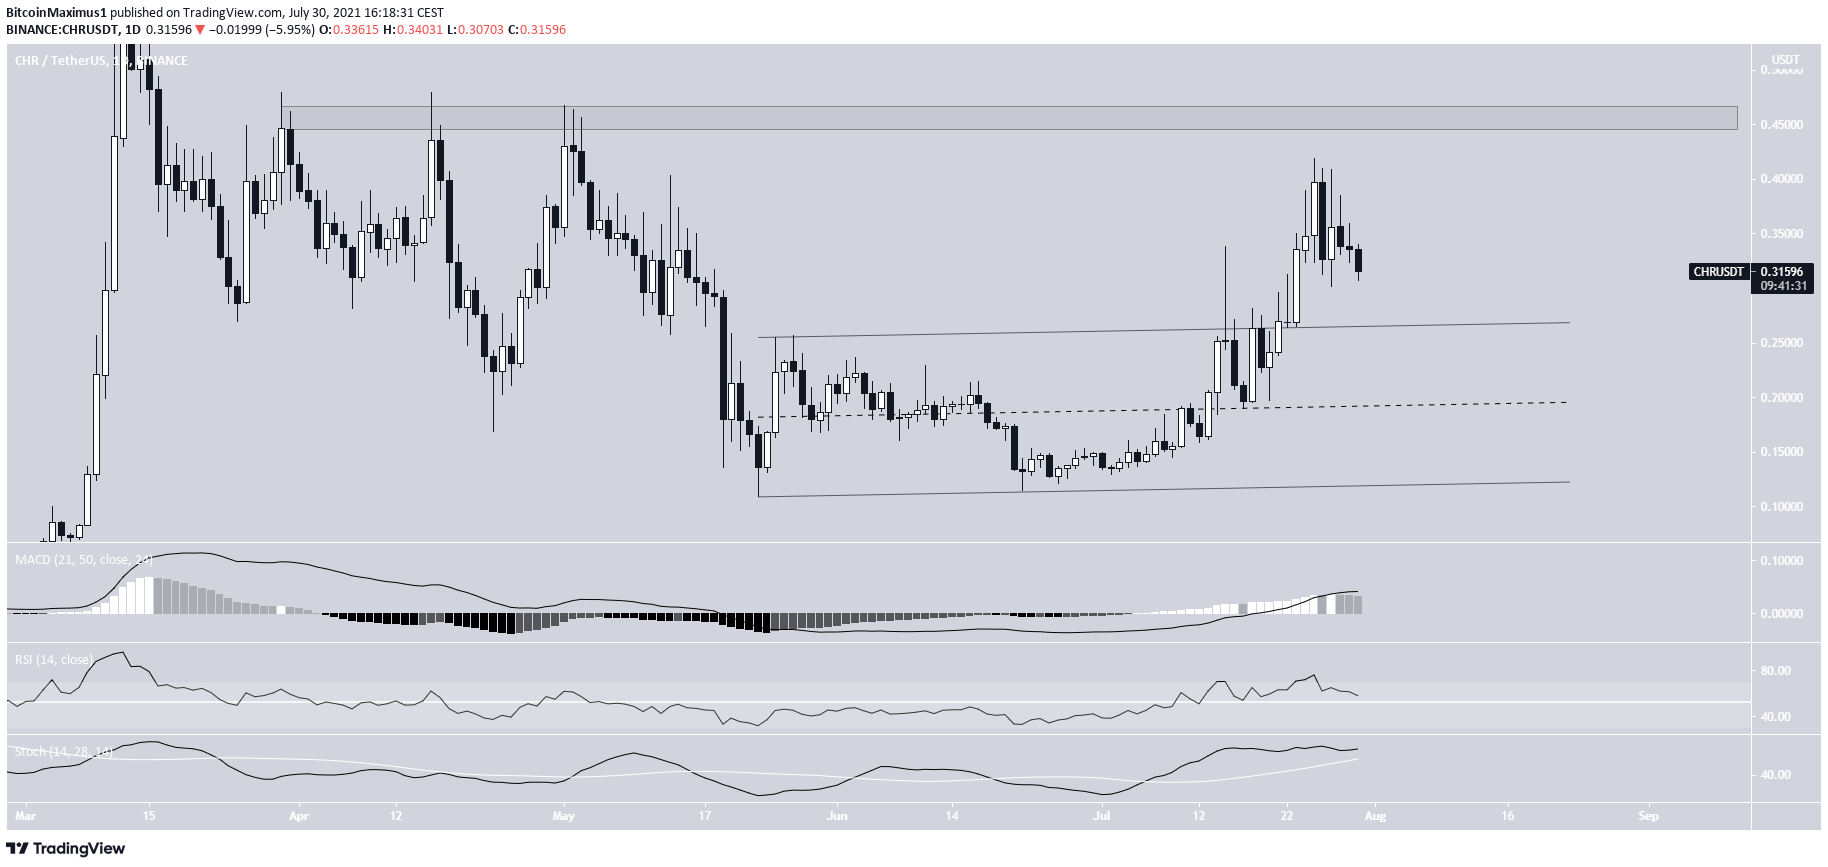
CHR
CHR has been increasing since May 23. On July 22, it managed to break out from an ascending parallel channel and proceeded to reach a high of $0.41 three days later.
It has been decreasing since, potentially returned to validate the channel as support.
Technical indicators are still bullish, since the RSI is above 50 and the MACD is positive. In addition, the Stochastic oscillator has not made a bearish cross.
The main resistance area is at $0.46.
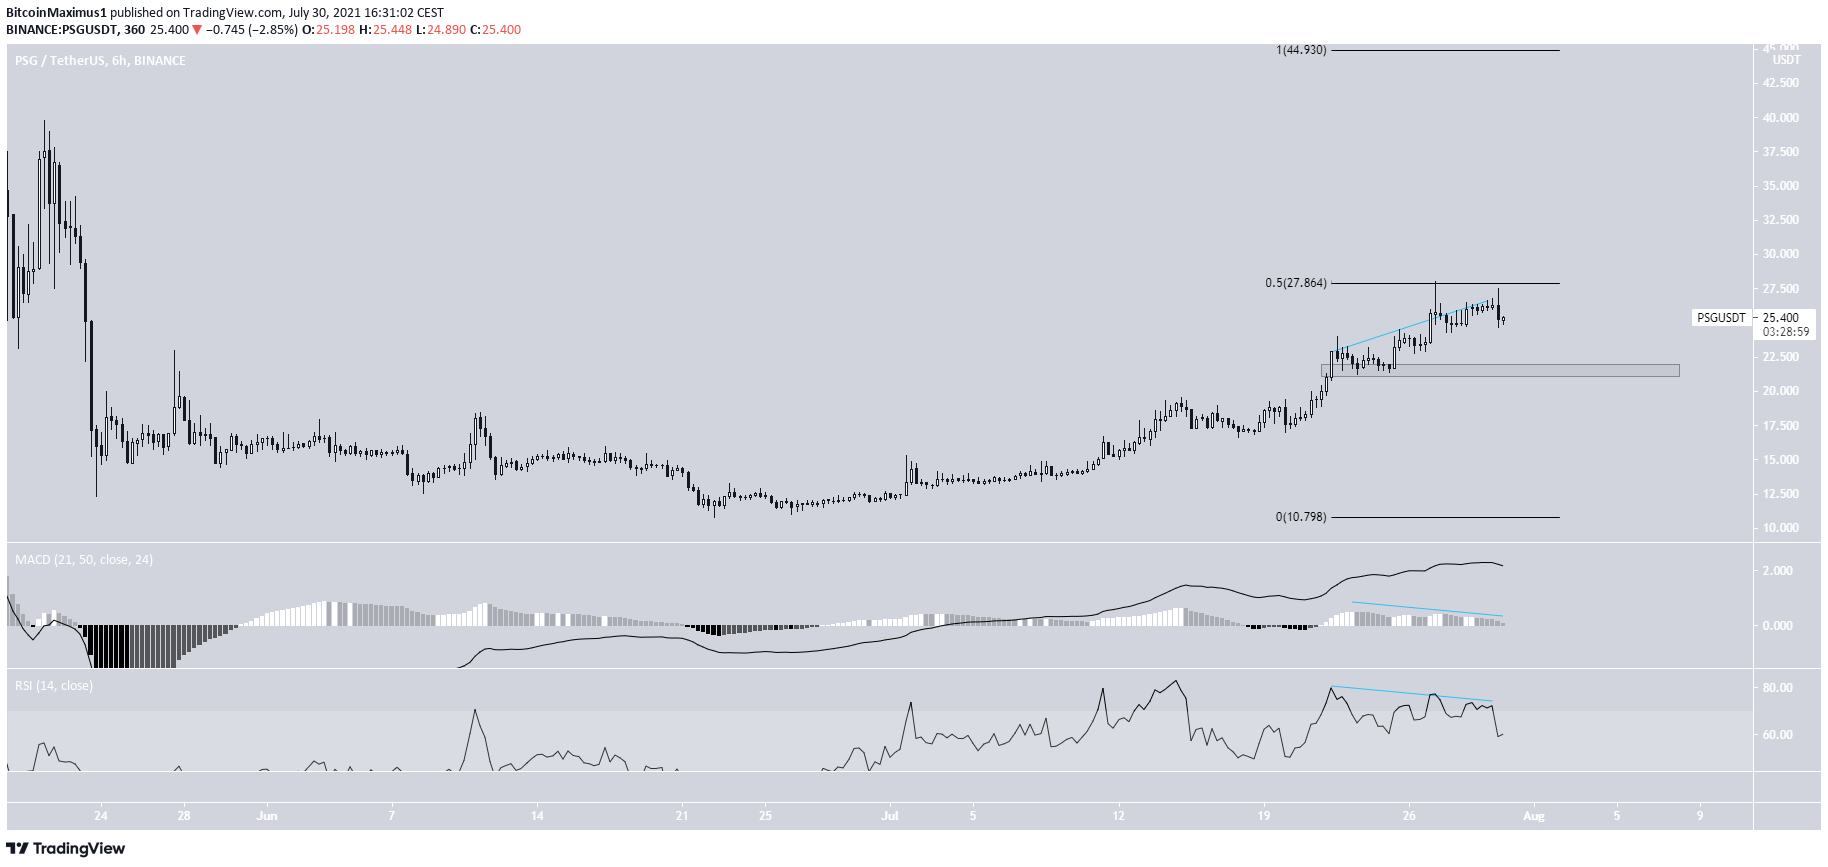
PSG
PSG has been increasing since reaching a low on June 22. The upward movement continued until a high of $28 was reached on July 27. The high was made right at the 0.5 Fib retracement resistance level when measuring the entire downward movement. Shortly afterwards, the token created a double top pattern and began to decrease.
The double top was combined with bearish divergence in the RSI and MACD.
If a downward movement were to follow, the closest support level would be at $21.50.
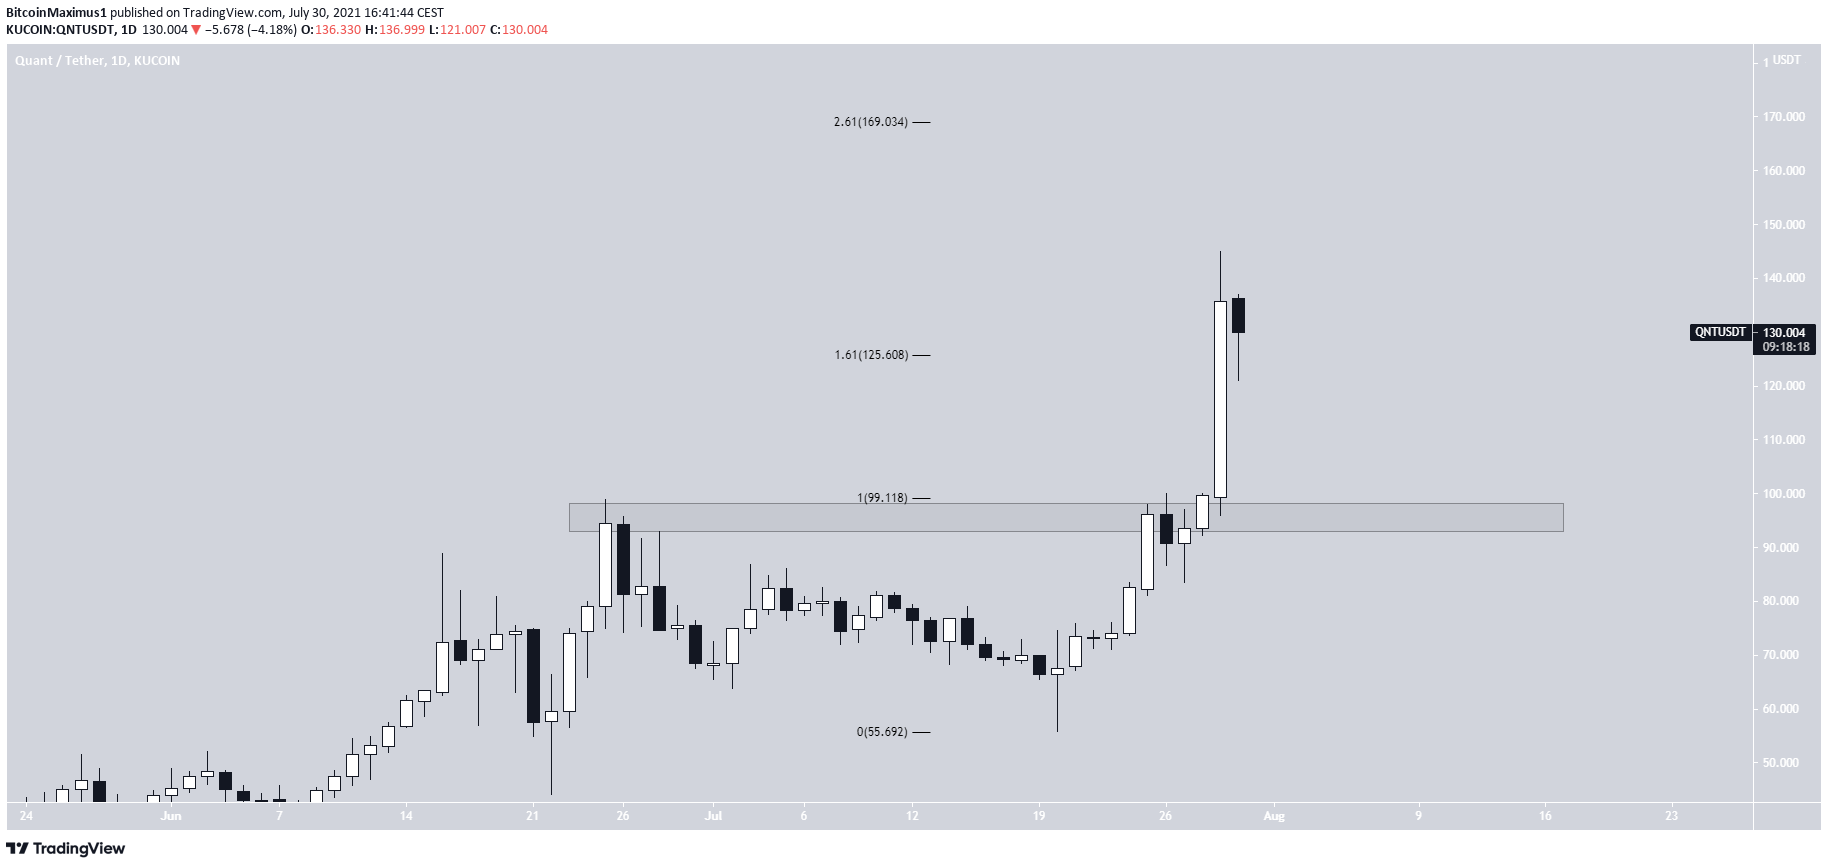
QNT
QNT had been struggling to move above the $96 resistance area since June 25. On July 28, it managed to break out and reached an all-time high price of $145 the next day.
The high was made very close to the 1.61 external Fib retracement at $125. If the token manages to close above this level, the next resistance would be at $169, the 2.61 external Fib retracement.
The previous resistance area of $96 is now expected to act as support.
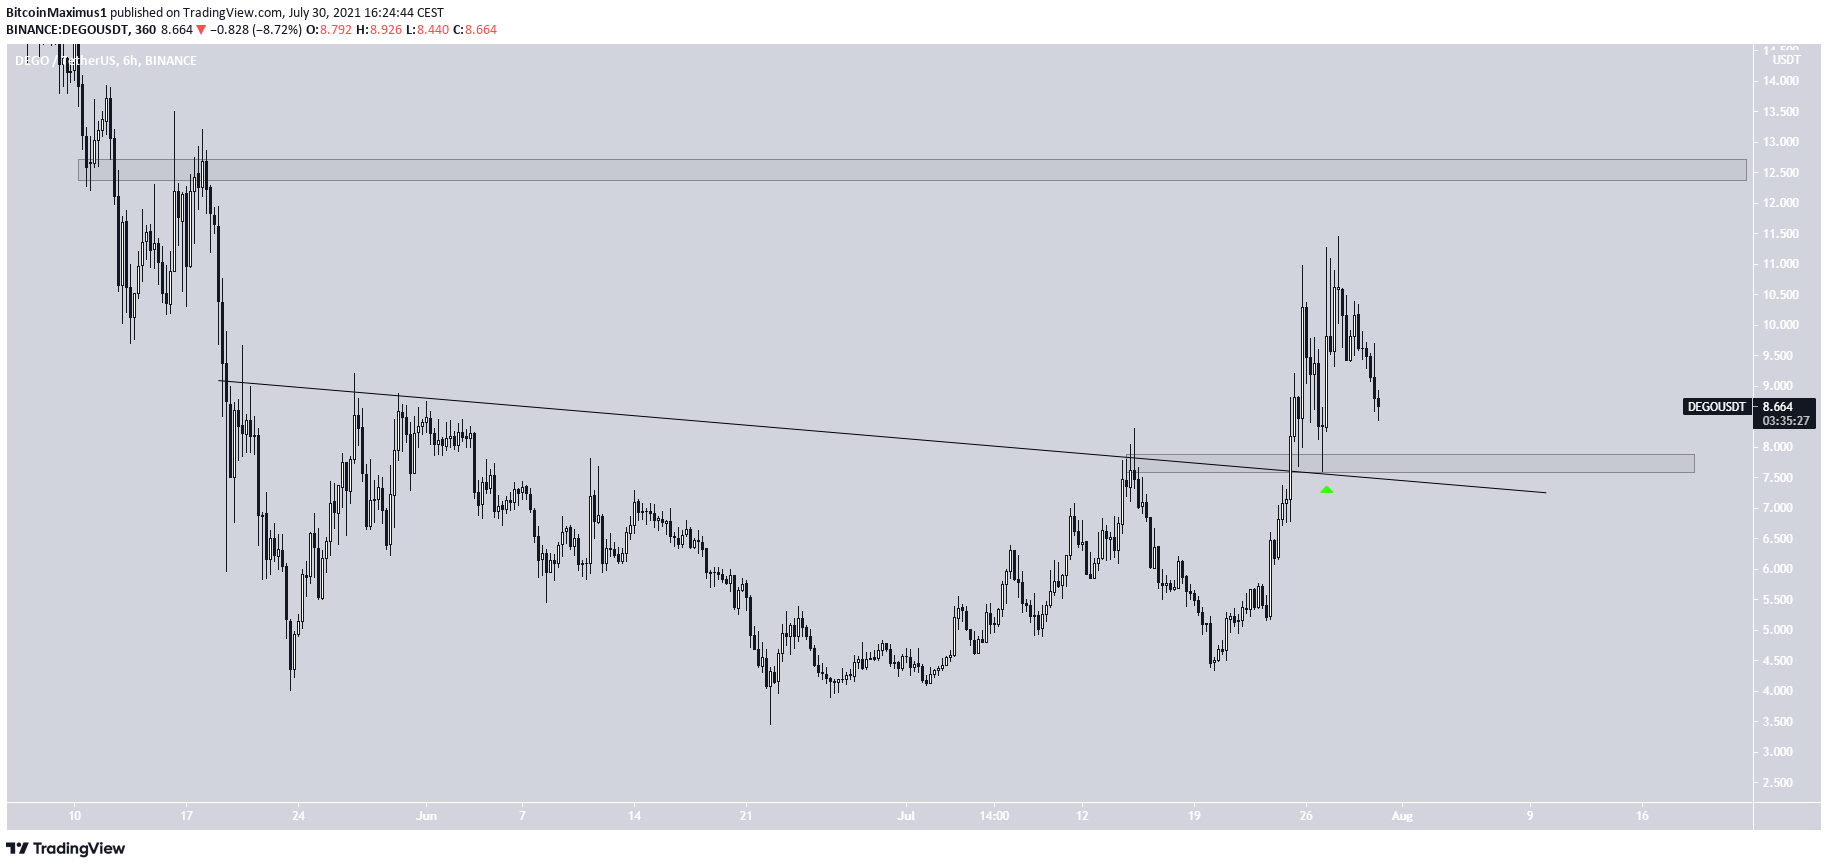
DEGO
DEGO has been moving upwards since July 20. It broke out from a descending resistance line on July 25.
Afterwards, it validated the line and the $7.80 area as support (green icon) and then proceeded to reach a high of $11.45 on July 28.
It is currently decreasing, potentially aiming to validate the $7.80 area once more.
The closest resistance area is at $12.60.
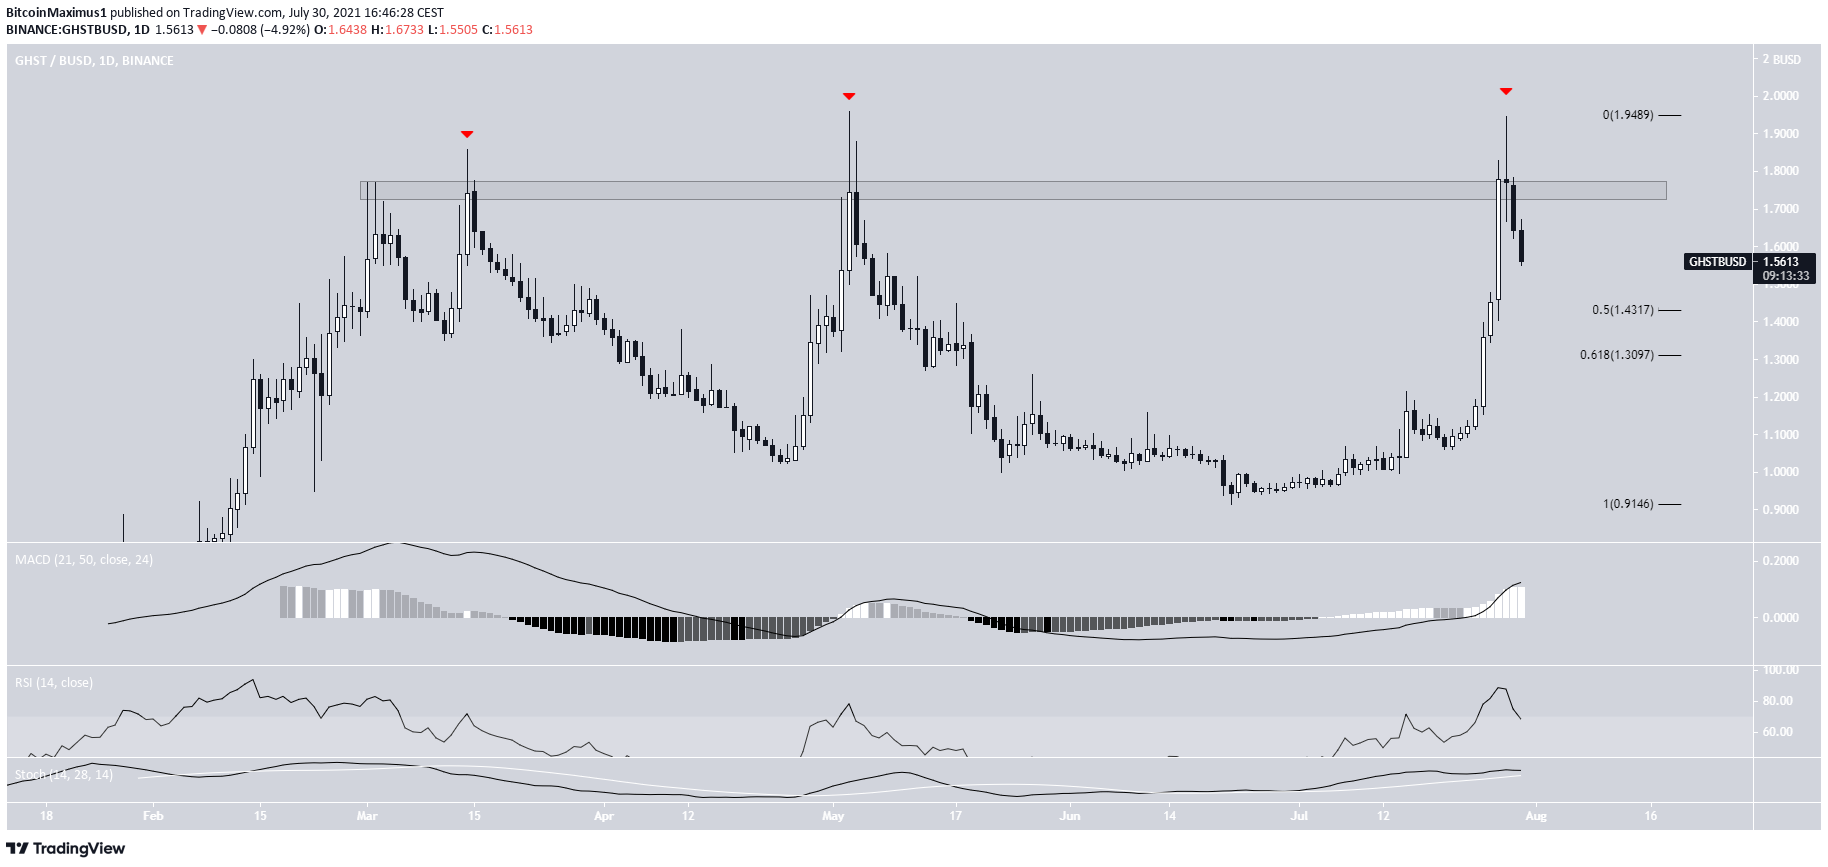
GHST
GHST has been moving upwards at an accelerated rate since July 29. On July 29, it proceeded to reach a high of $1.946.
However, the higher prices could not be sustained, and the token created a long upper wick (red icon). This effectively created a triple top pattern.
GHST has fallen below the $1.75 horizontal resistance area since.
However, technical indicators are still bullish.
The closest support areas are between $1.31-$1.43, the 0.5-0.618 Fib retracement support levels.
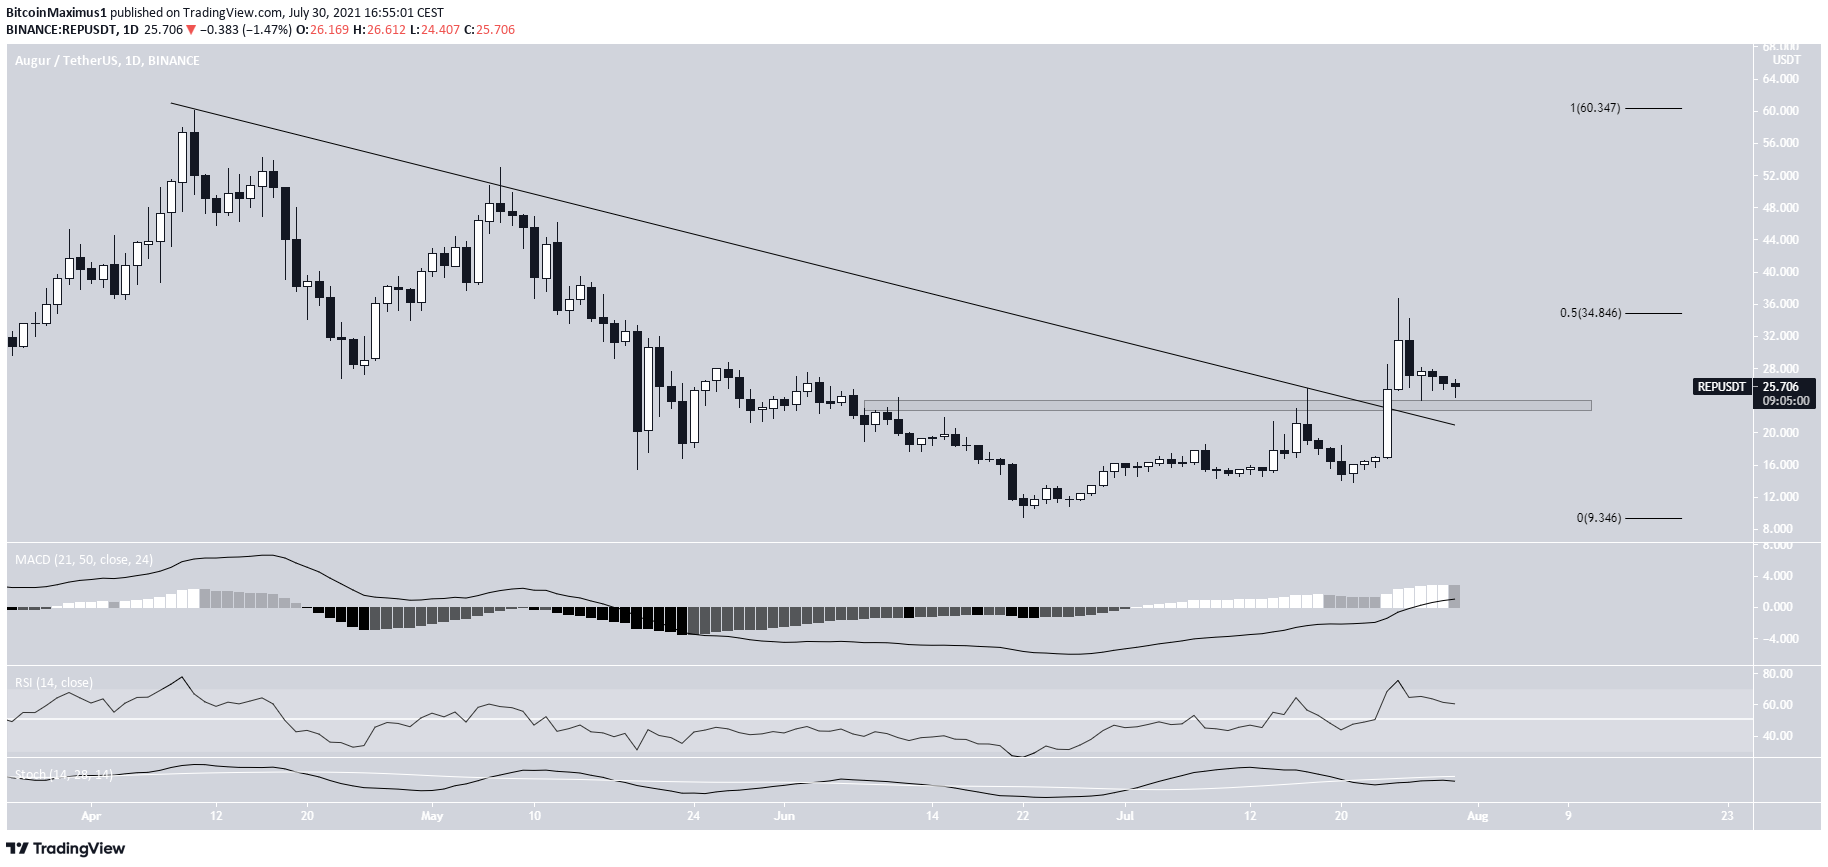
REP
REP has been moving upwards since June 22. On July 24, it broke out from a descending resistance line that had previously been in place since April 10. This led to a high of $36.51 the next day.
However, REP was rejected by the 0.5 Fib retracement resistance level and has been moving downwards since.
It is currently attempting to validate the resistance line and $23.50 area as support, prior to potentially initiating another upward movement.
Despite the bearish cross in the Stochastic oscillator, the MACD and RSI are still bearish.
For BeInCrypto’s latest bitcoin (BTC) analysis, click here.


