
The Tomochain (TOMO) price has been increasing significantly since it reached a local low on Sept 5.
Despite the significant rejection on Oct 1, it’s possible that the correction has ended and TOMO has begun a new upward move.
TOMO Bounces at Support
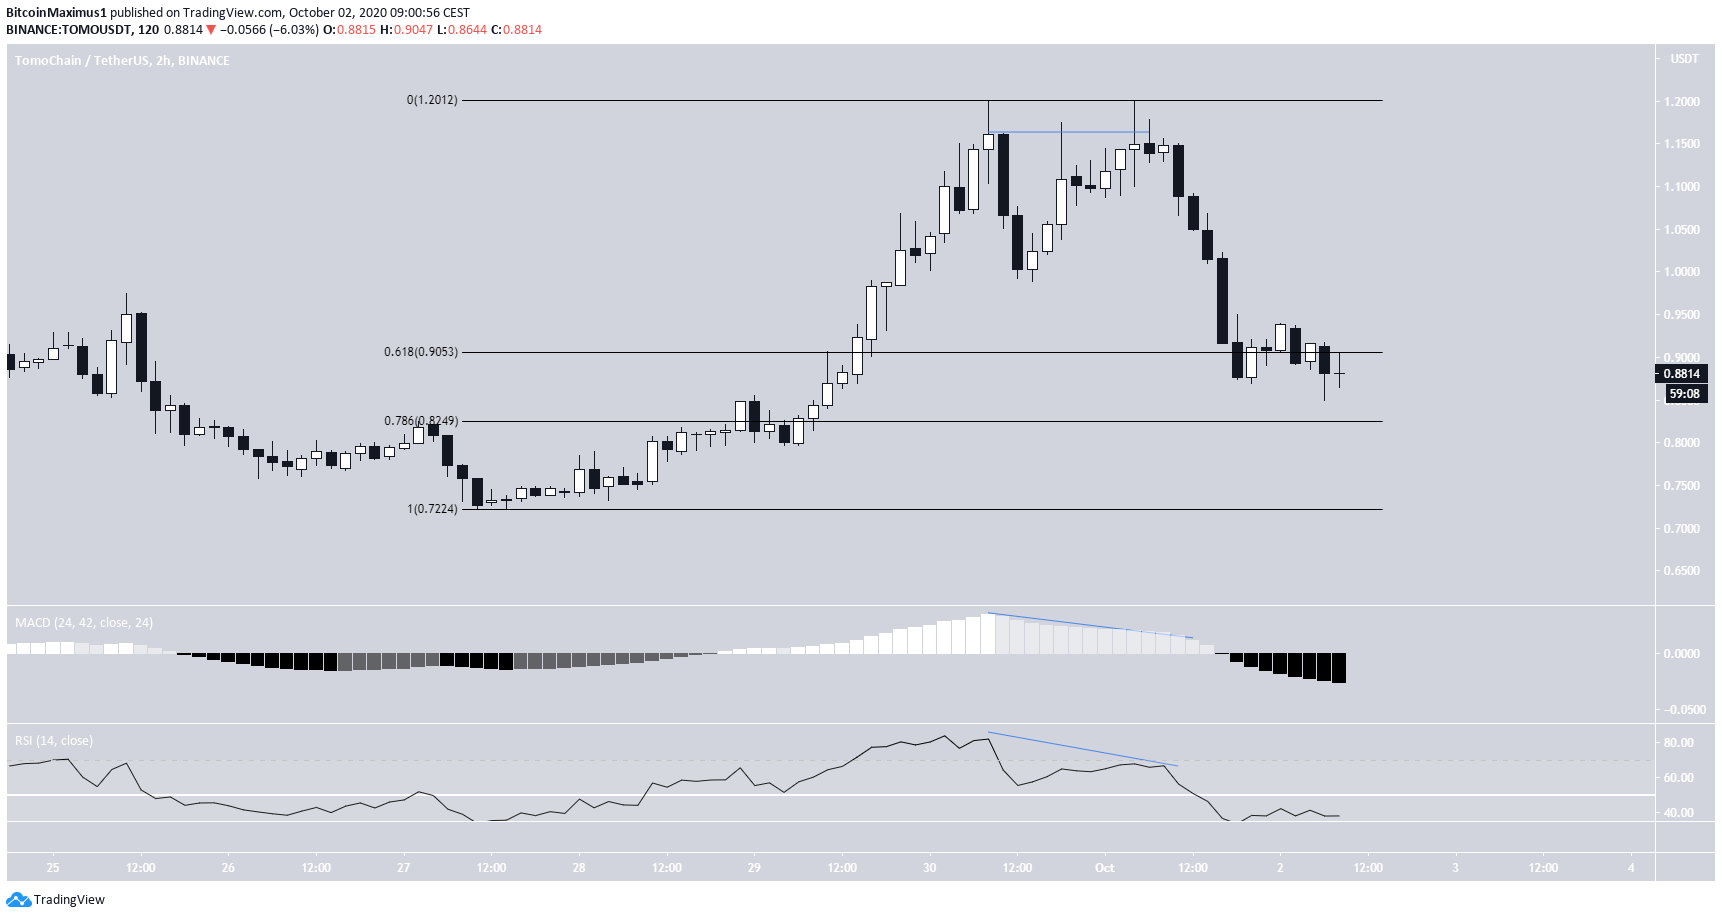
On Aug 13, the TOMO price reached a high of $1.55 and began a downward move that continued until a low of $0.52 was reached on Sept 5. Since then, the price has been increasing at an accelerated rate, reaching a high of $1.20. However, TOMO dropped sharply on Oct 1 and is currently trading near $0.87. The main support area is found just above $0.63, while the main resistance area is found at $1.15, the 0.618 Fib level of the previous decrease.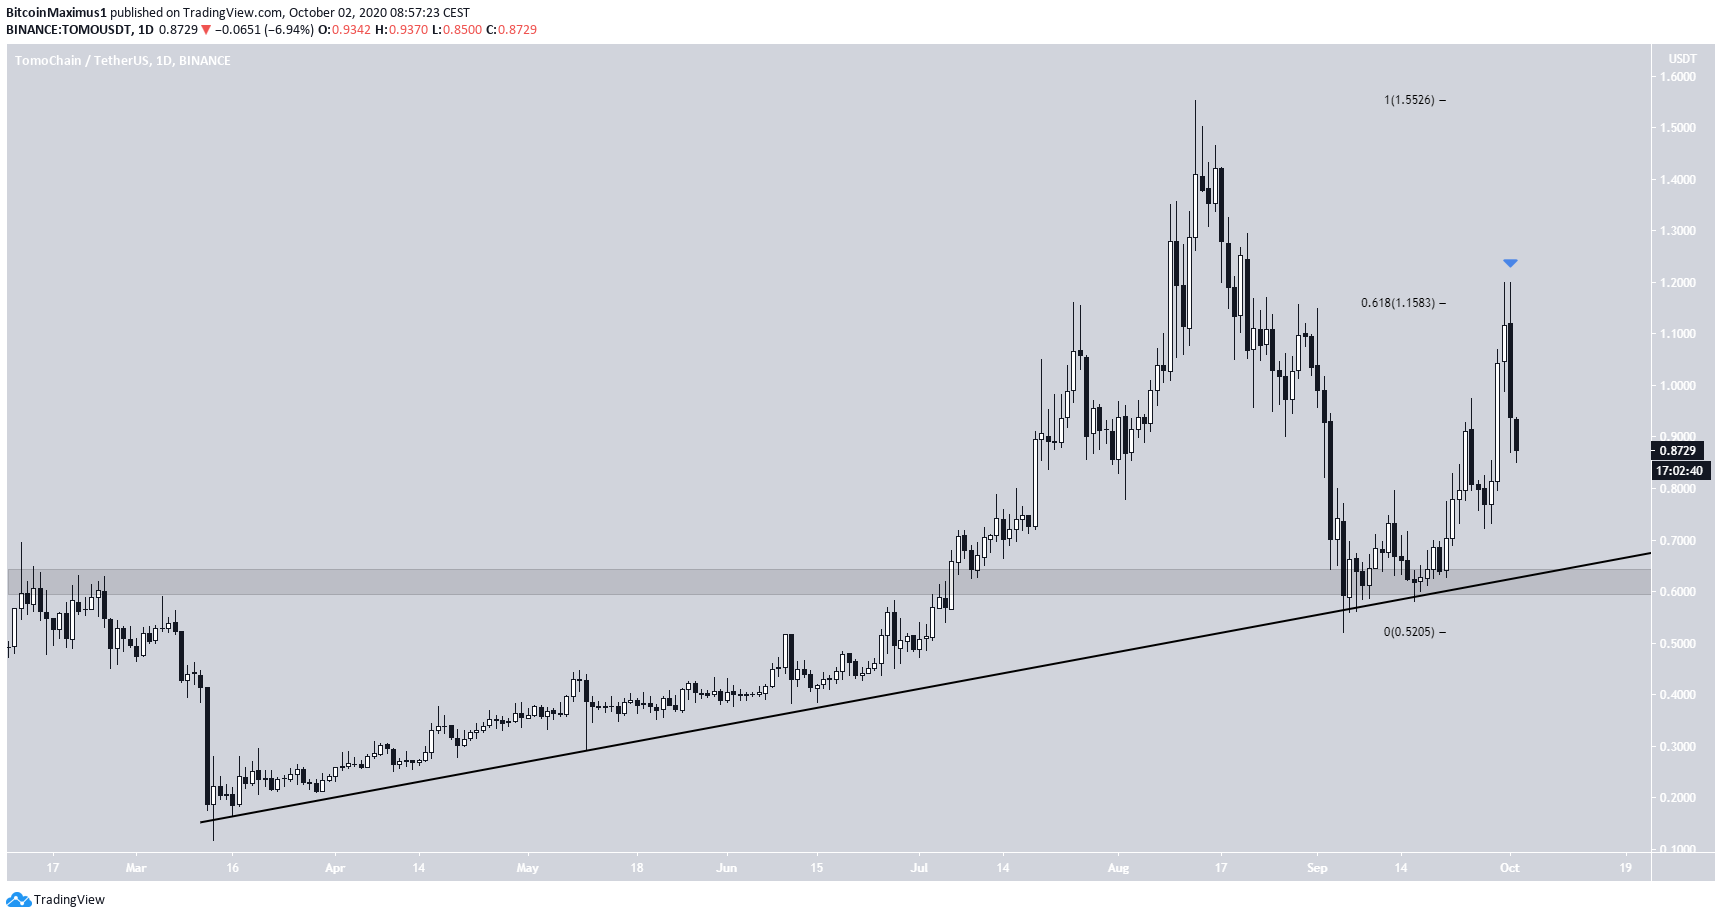
Double-Top Pattern
Cryptocurrency trader @Devchart outlined a TOMO chart, stating that the price has increased by 40% and almost reached his target resistance area of $1.11. Since the Tweet, the target has been hit, but a rejection followed.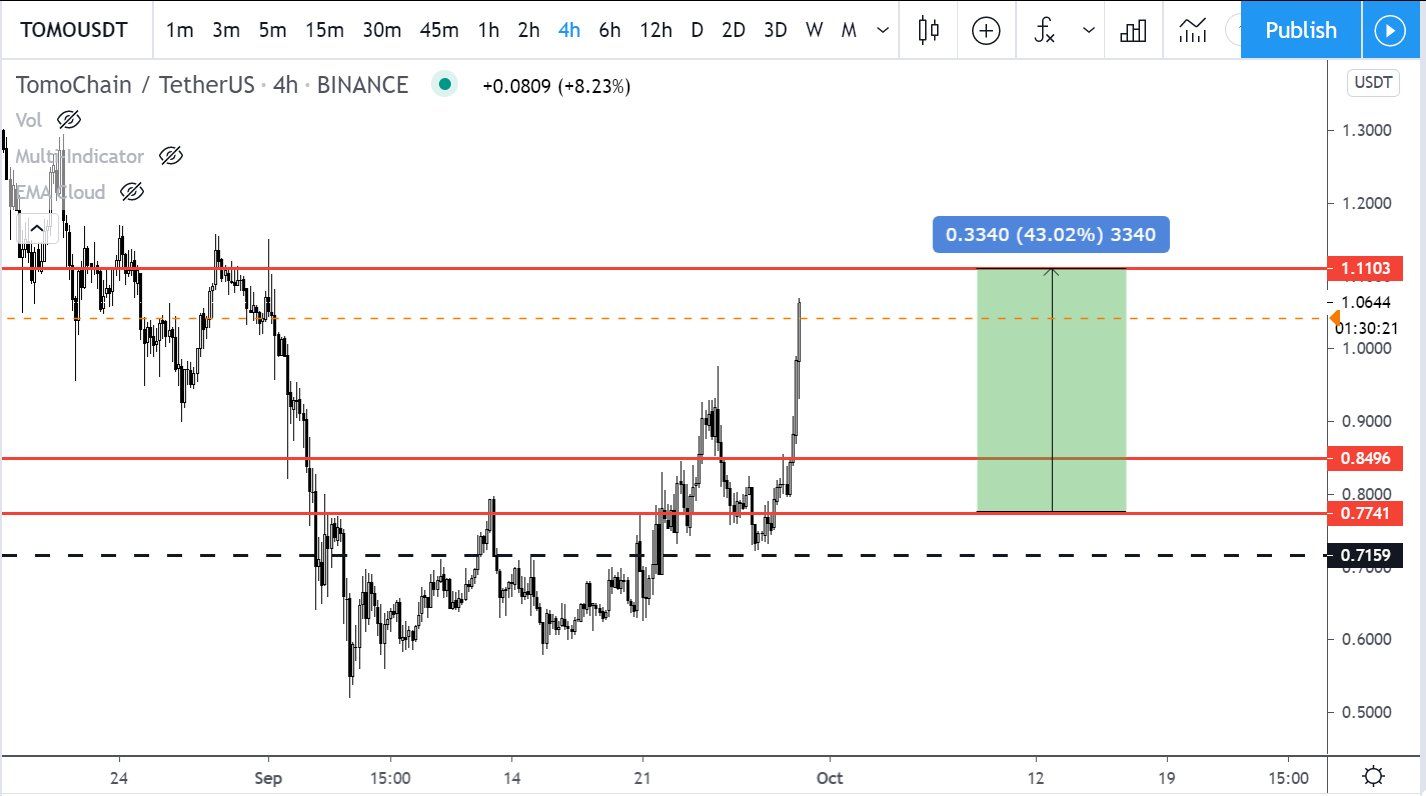
Wave Count
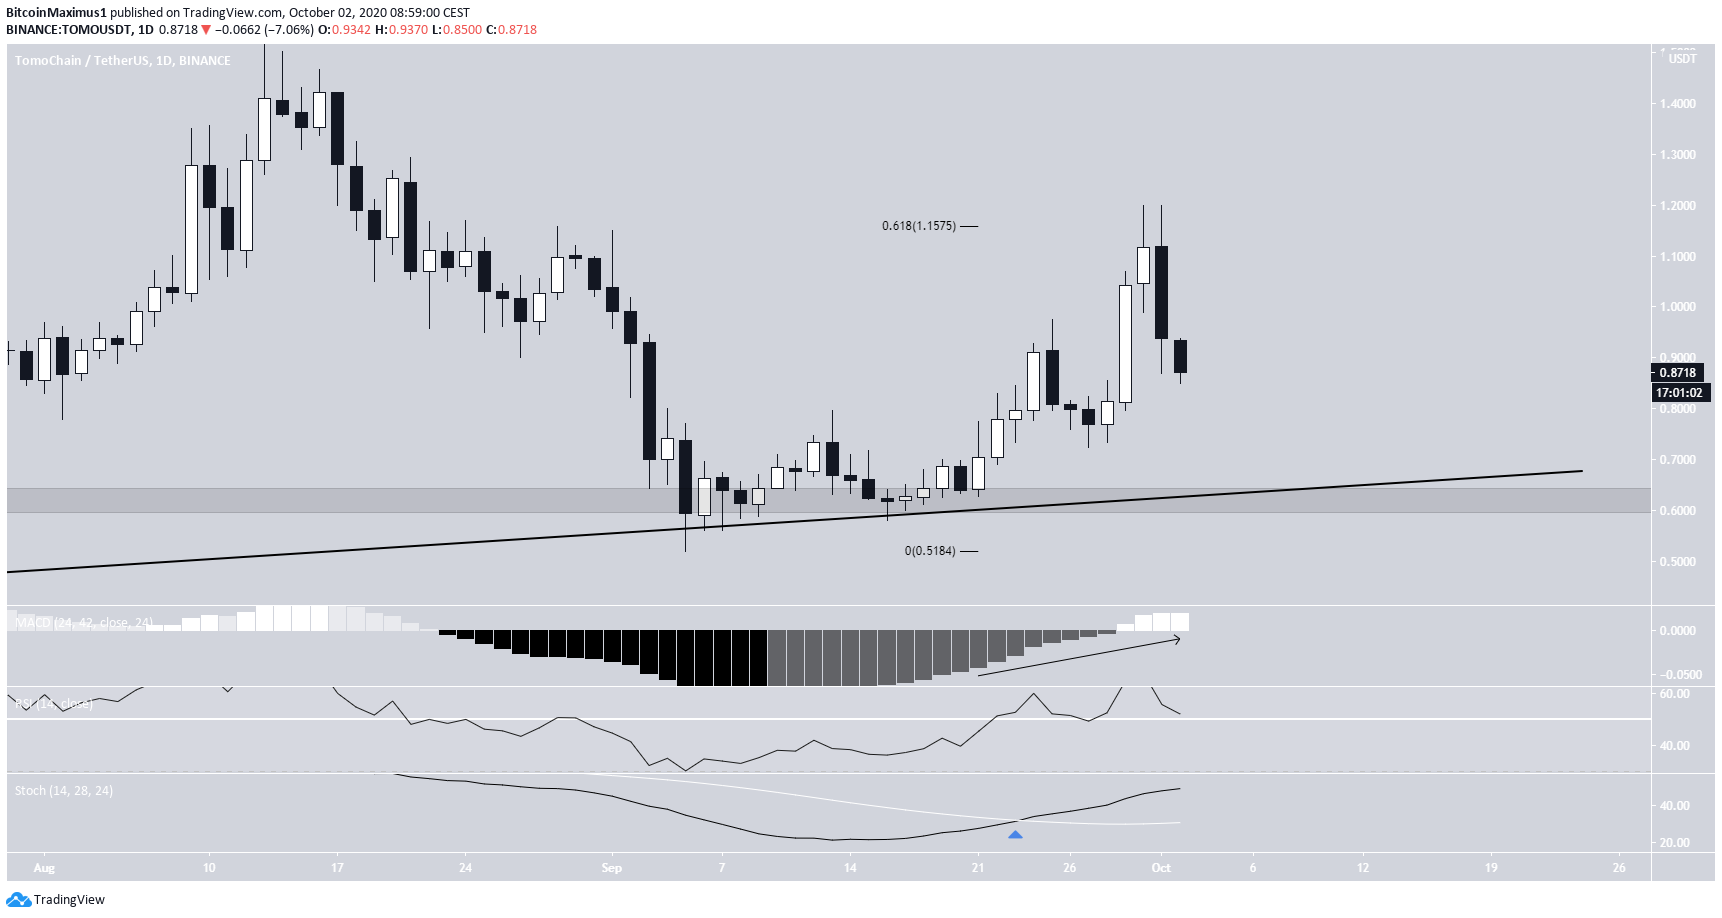
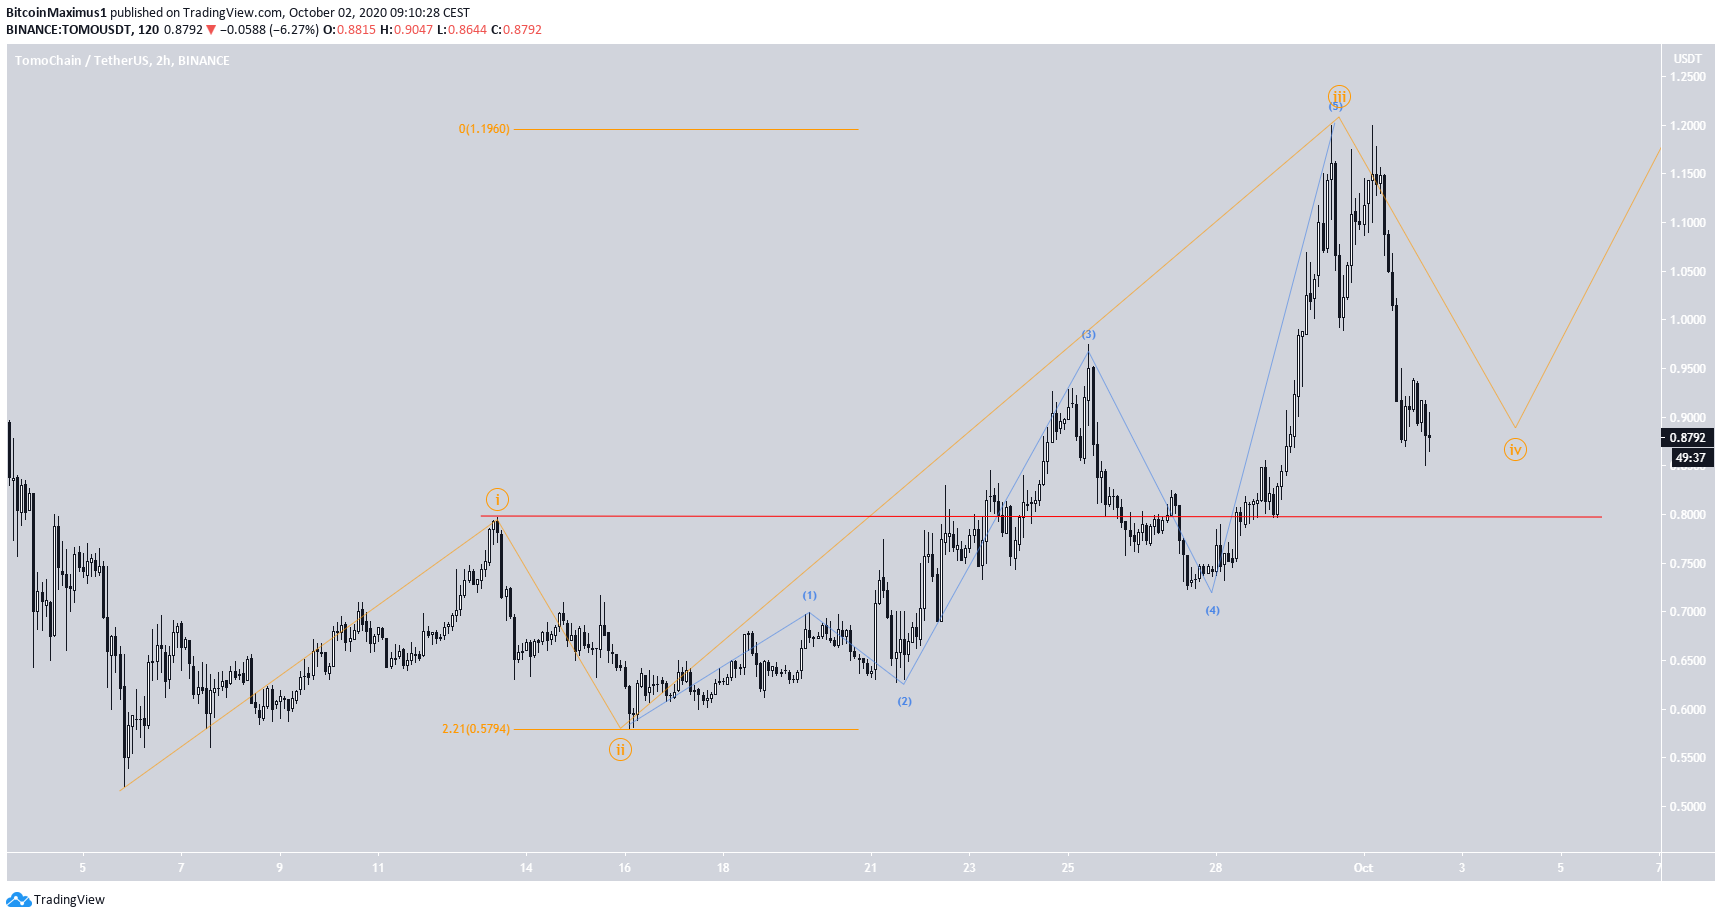
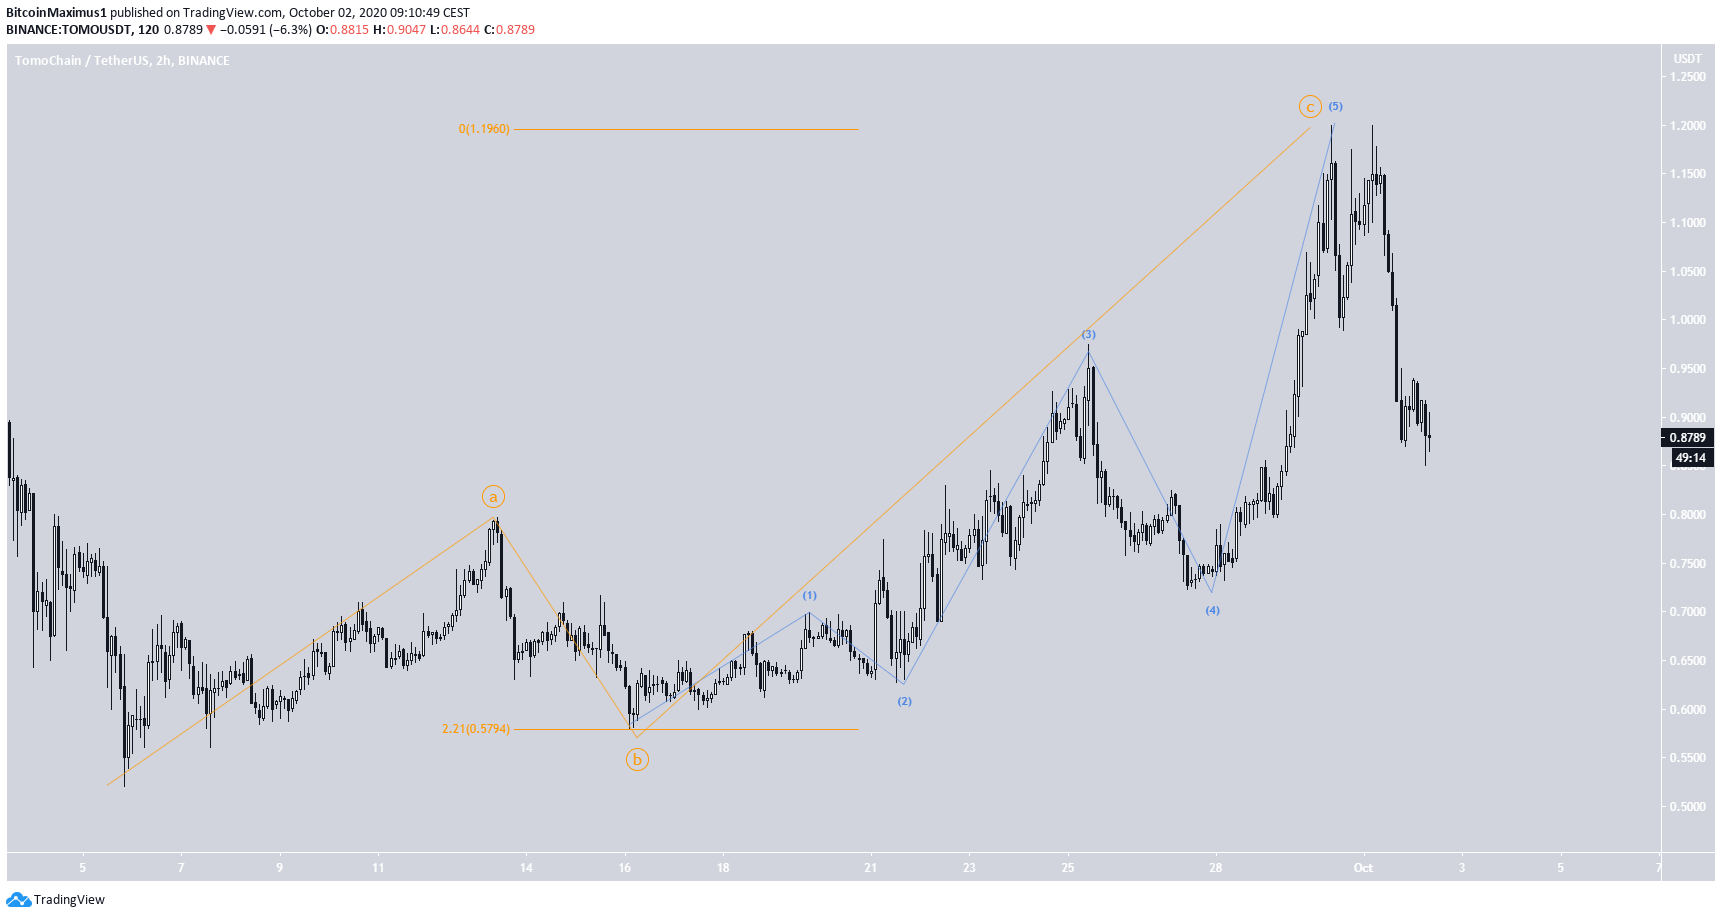
Since the aforementioned Aug 13 high, TOMO seems to have completed an A-B-C correction (in orange below), in which the A:C waves have a 1:1 ratio. Since then, the price has been rapidly increasing in what looks like the beginning of an upward move.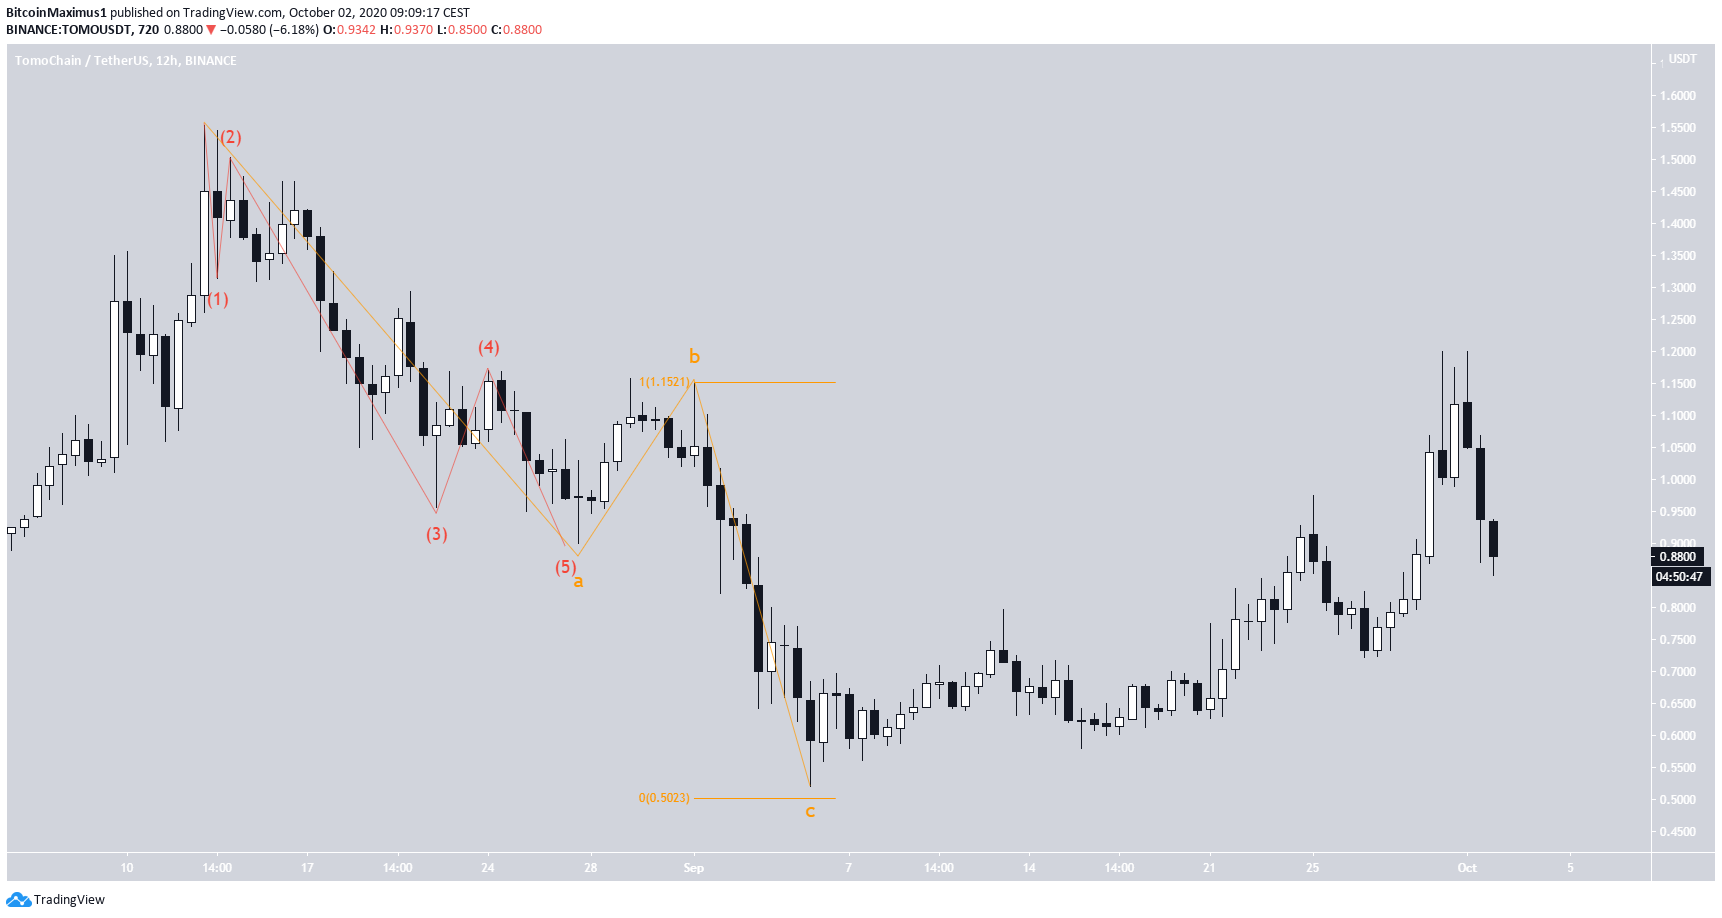
Disclaimer
In line with the Trust Project guidelines, this price analysis article is for informational purposes only and should not be considered financial or investment advice. BeInCrypto is committed to accurate, unbiased reporting, but market conditions are subject to change without notice. Always conduct your own research and consult with a professional before making any financial decisions. Please note that our Terms and Conditions, Privacy Policy, and Disclaimers have been updated.

Valdrin Tahiri
Valdrin discovered cryptocurrencies while he was getting his MSc in Financial Markets from the Barcelona School of Economics. Shortly after graduating, he began writing for several different cryptocurrency related websites as a freelancer before eventually taking on the role of BeInCrypto's Senior Analyst.
(I do not have a discord and will not contact you first there. Beware of scammers)
READ FULL BIO
Sponsored
Sponsored