
Tomochain (TOMO) is following an ascending support line. It has also bounced at the previous all-time high resistance.
Theta Fuel (TFUEL) reached an all-time high in the early hours of March 24 but has decreased considerably since.
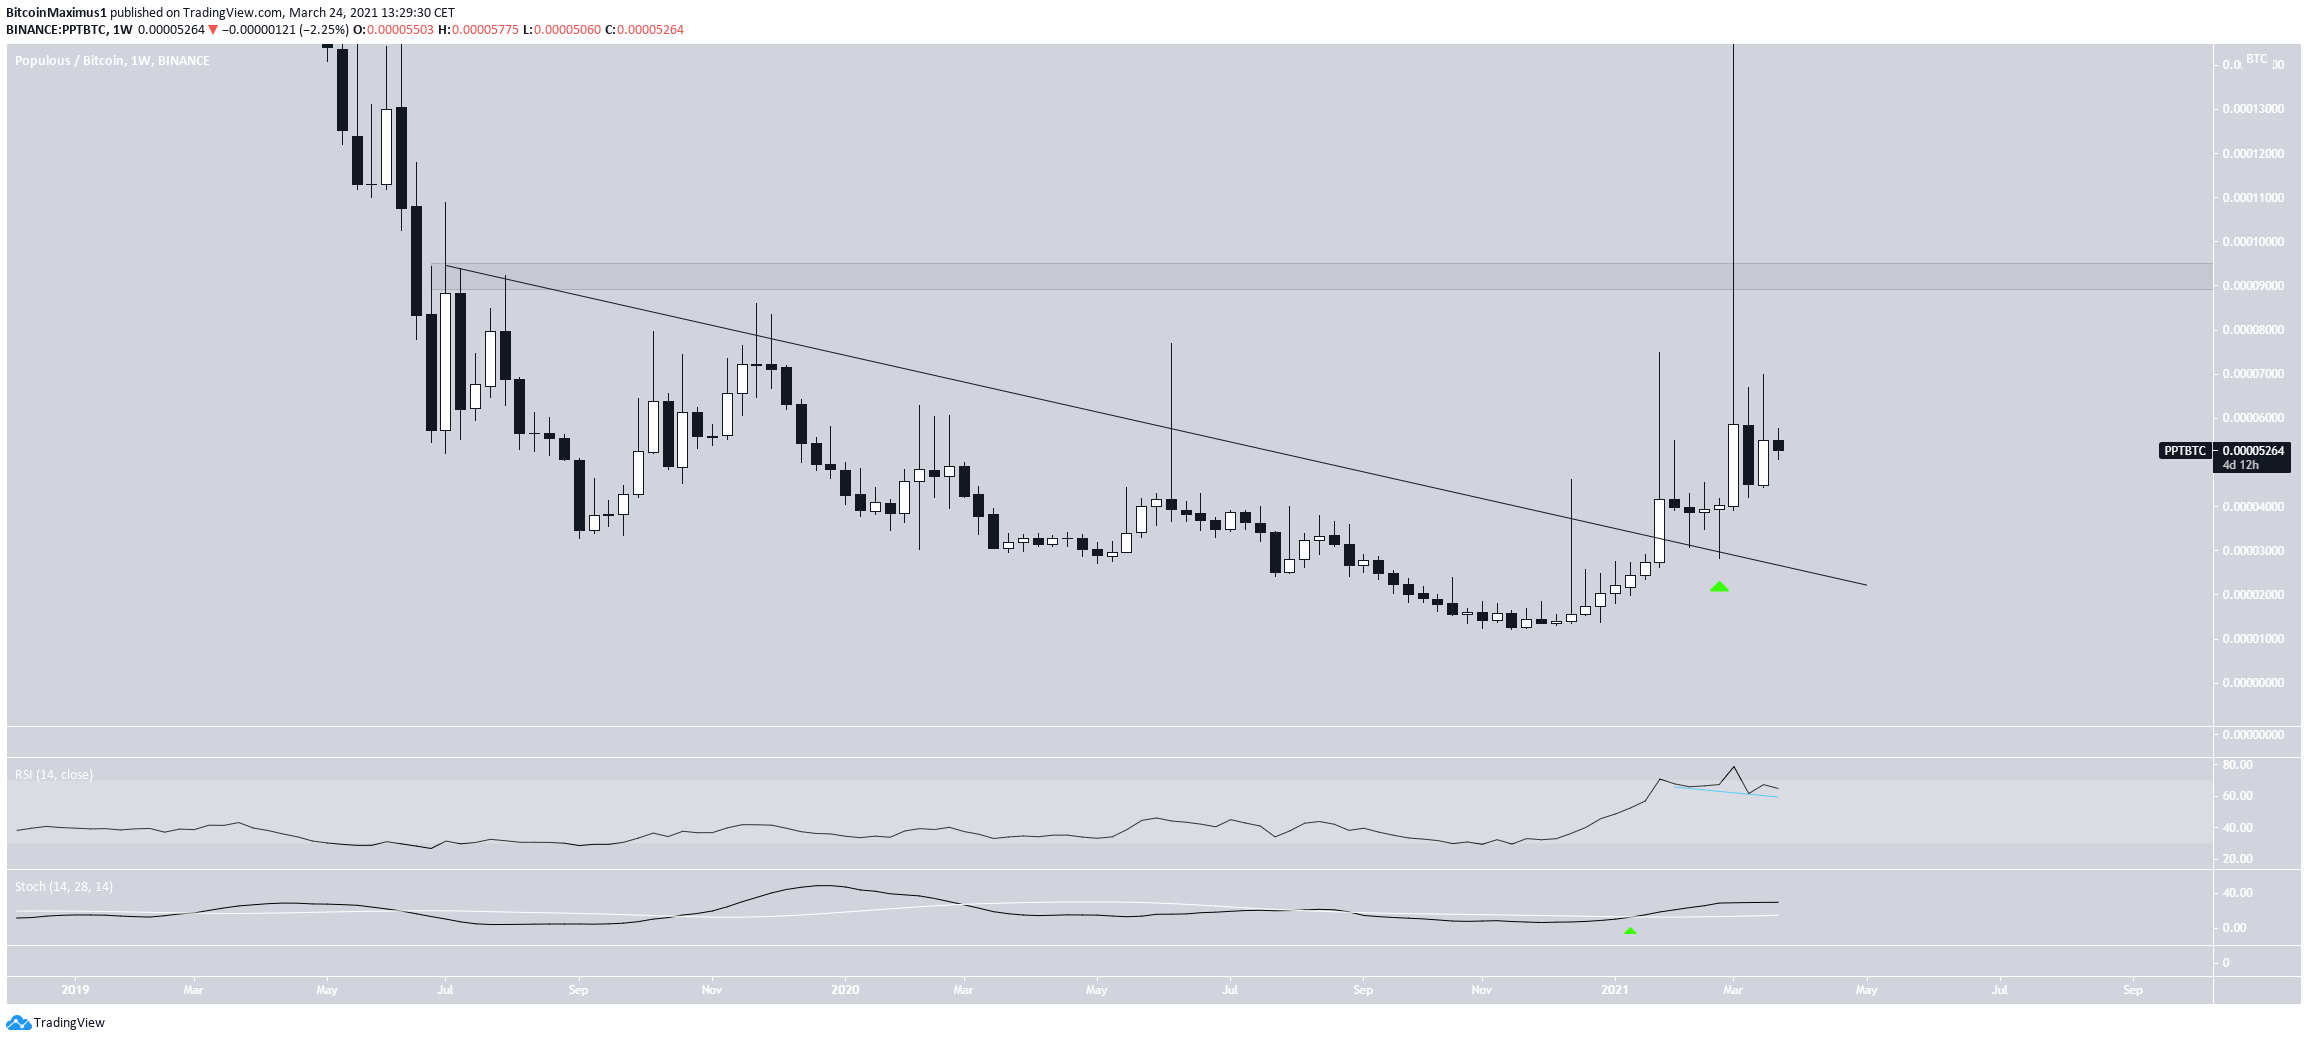
Populous (PPT) has broken out from a long-term descending resistance line.
Tomochain (TOMO)
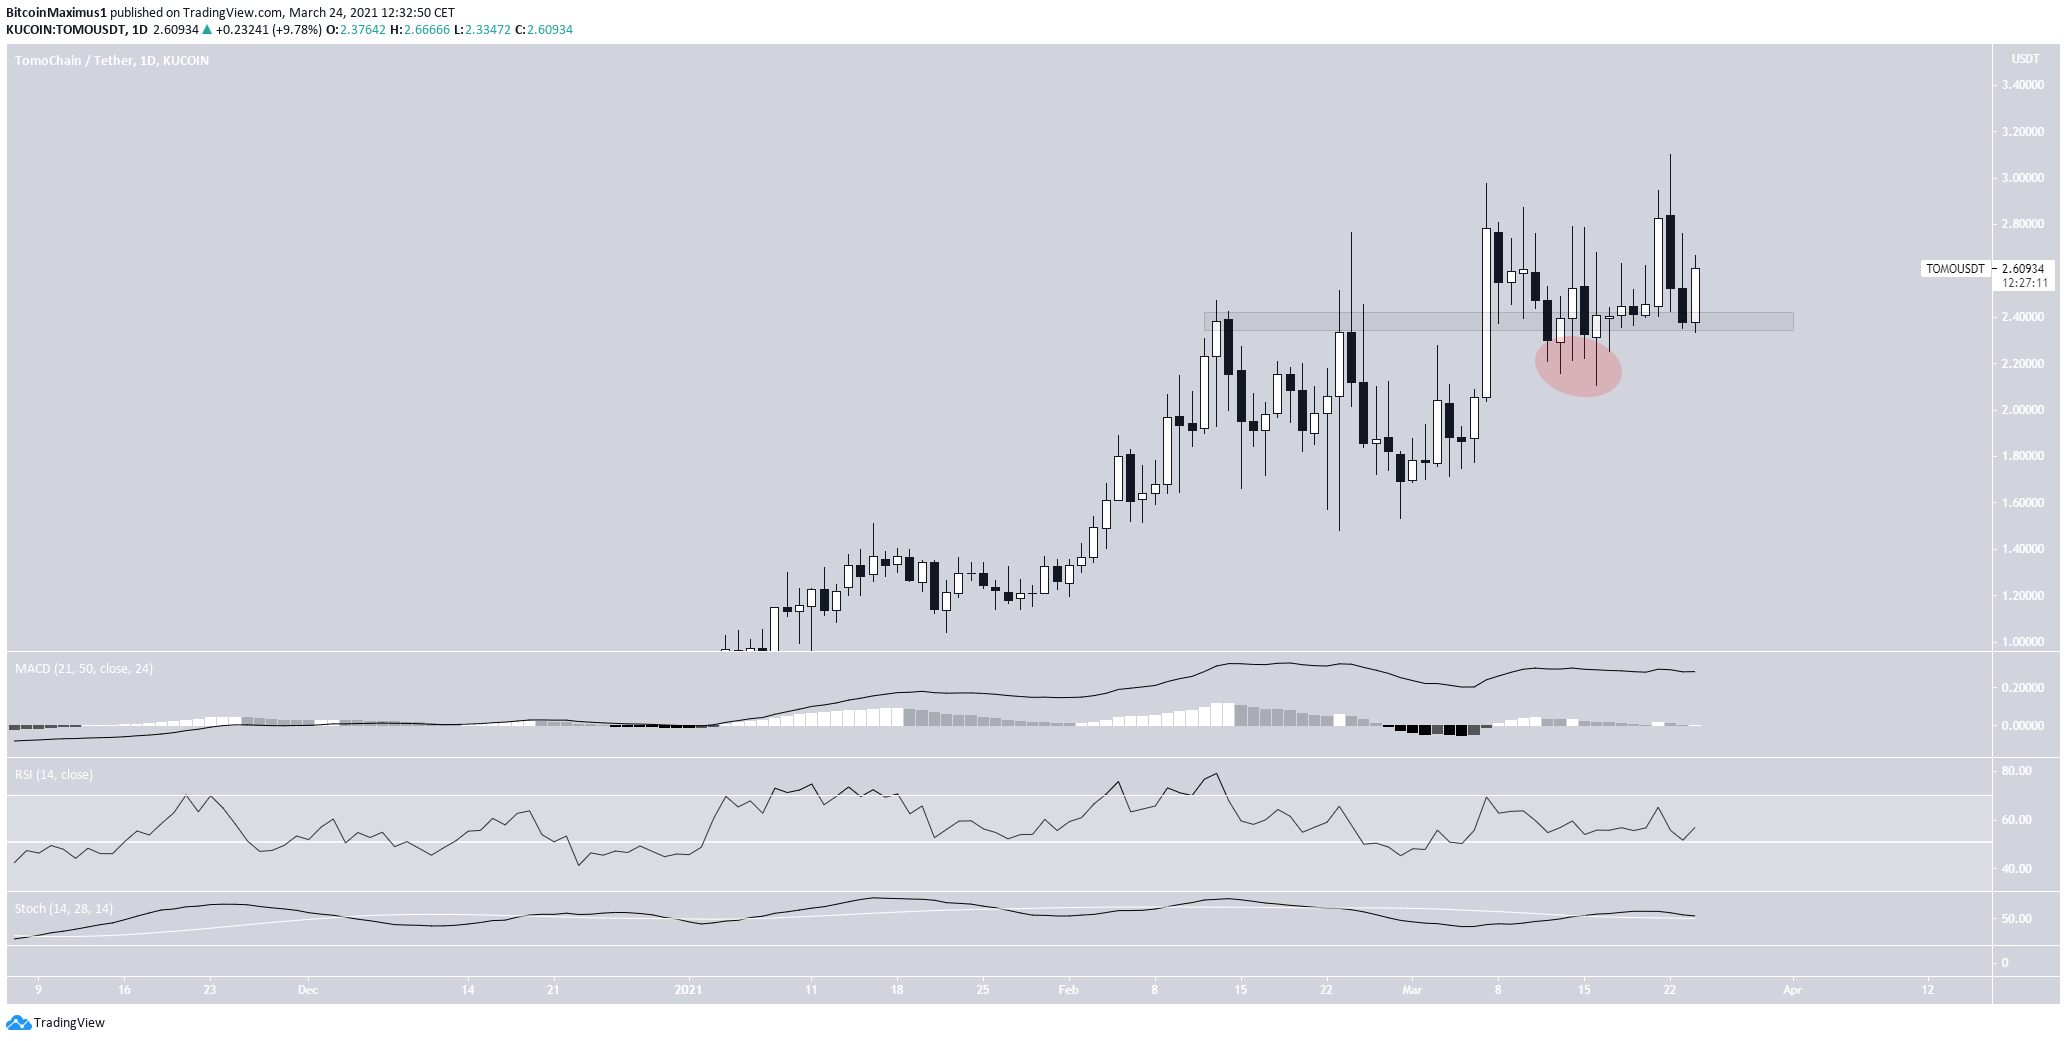
On March 7, TOMO broke out from the previous all-time high resistance at $2.35 and proceeded to reach a then all-time high price of $2.85.
Several days later, TOMO reached the current all-time high price of $3.09.
Currently, TOMO is trading just above the $2.35 area, having validated it as support. This is a bullish development.
Furthermore, TOMO has deviated below this level before reclaiming it, another bullish development.
However, technical indicators are relatively neutral.
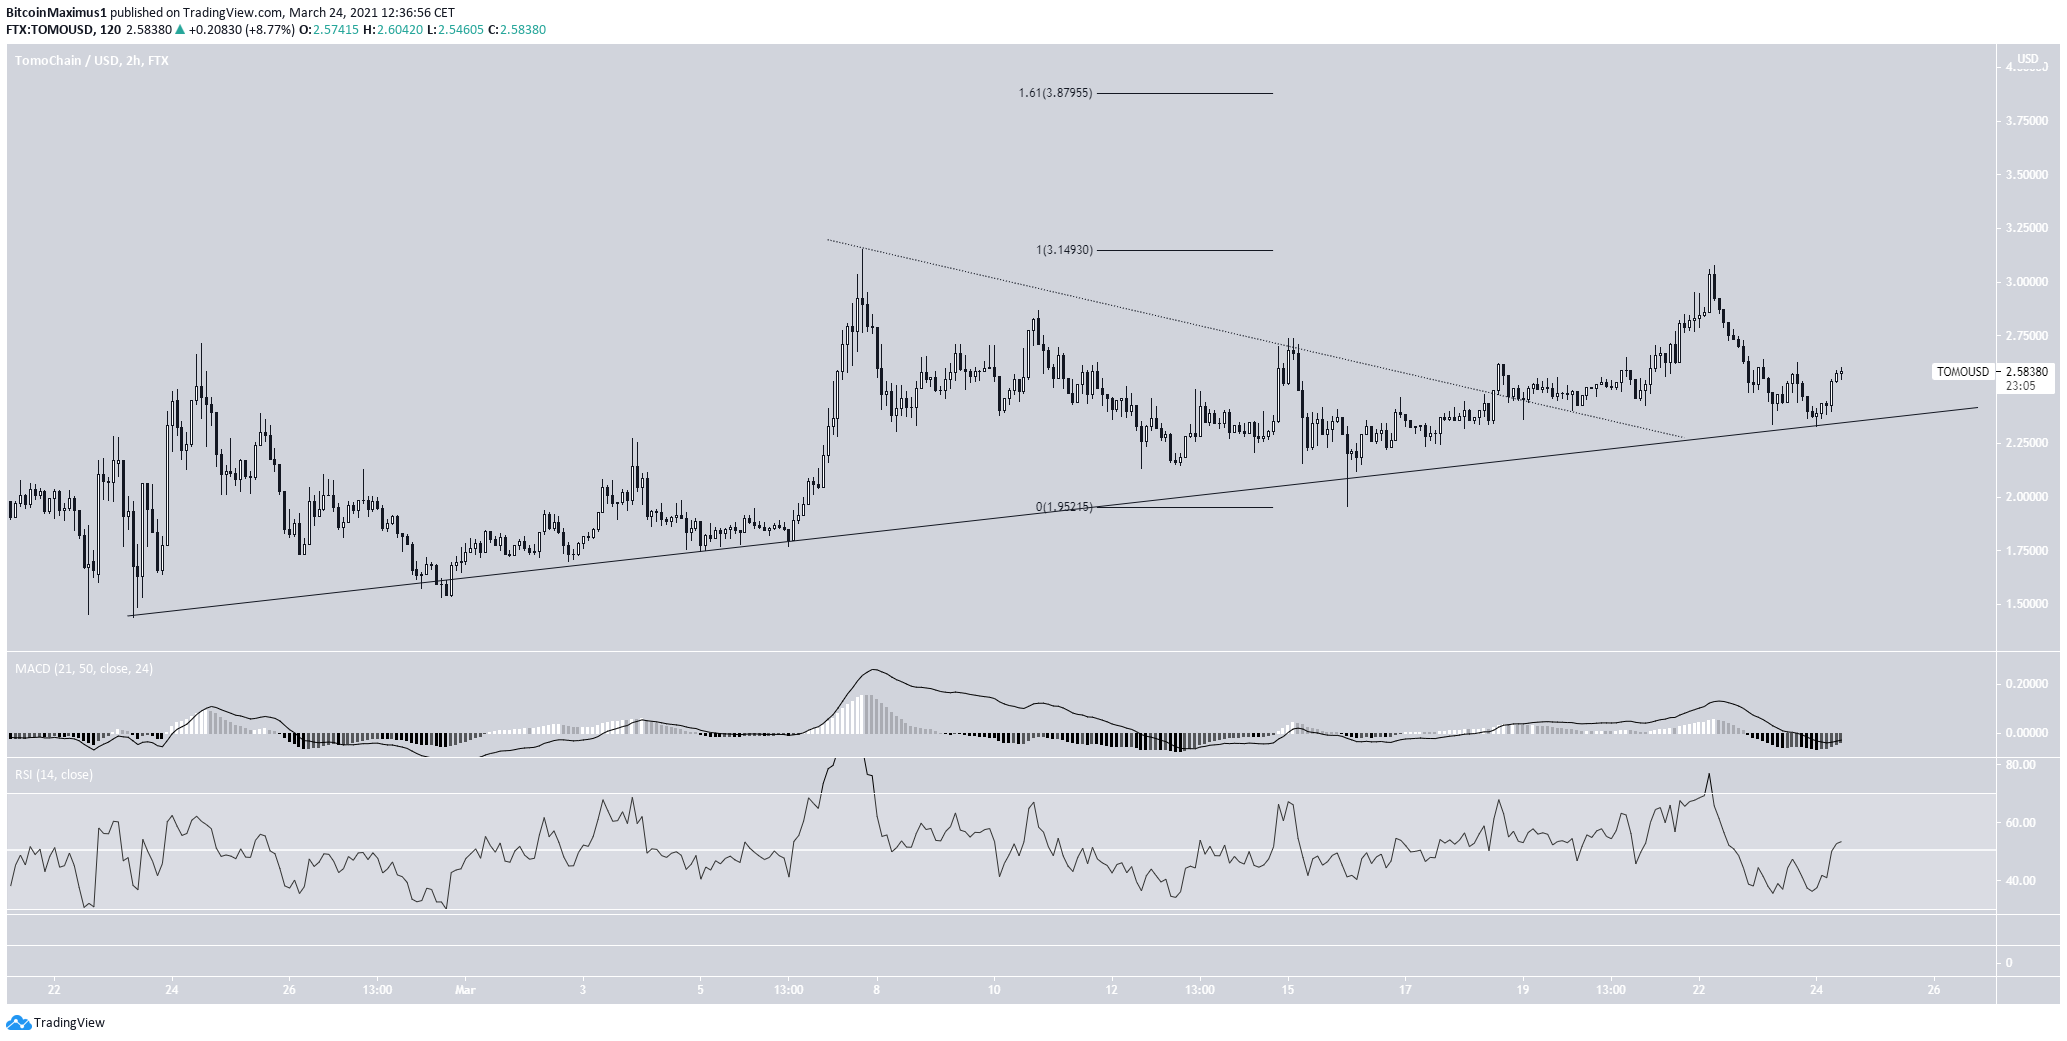
The shorter-term six-hour chart shows a breakout from a descending resistance line (dashed).
Furthermore, it shows that TOMO is also following an ascending support line. As long as it does not close below it (and the $2.35 area), the trend is considered bullish.
The two closest resistance levels are found at $3.10, the current all-time high price, and $3.88, the 1.61 external fib retracement.
TOMO is expected to reach at least one of them.
Highlights
- TOMO is trading above support at $2.35.
- It is following an ascending support line.
Theta Fuel (TFUEL)
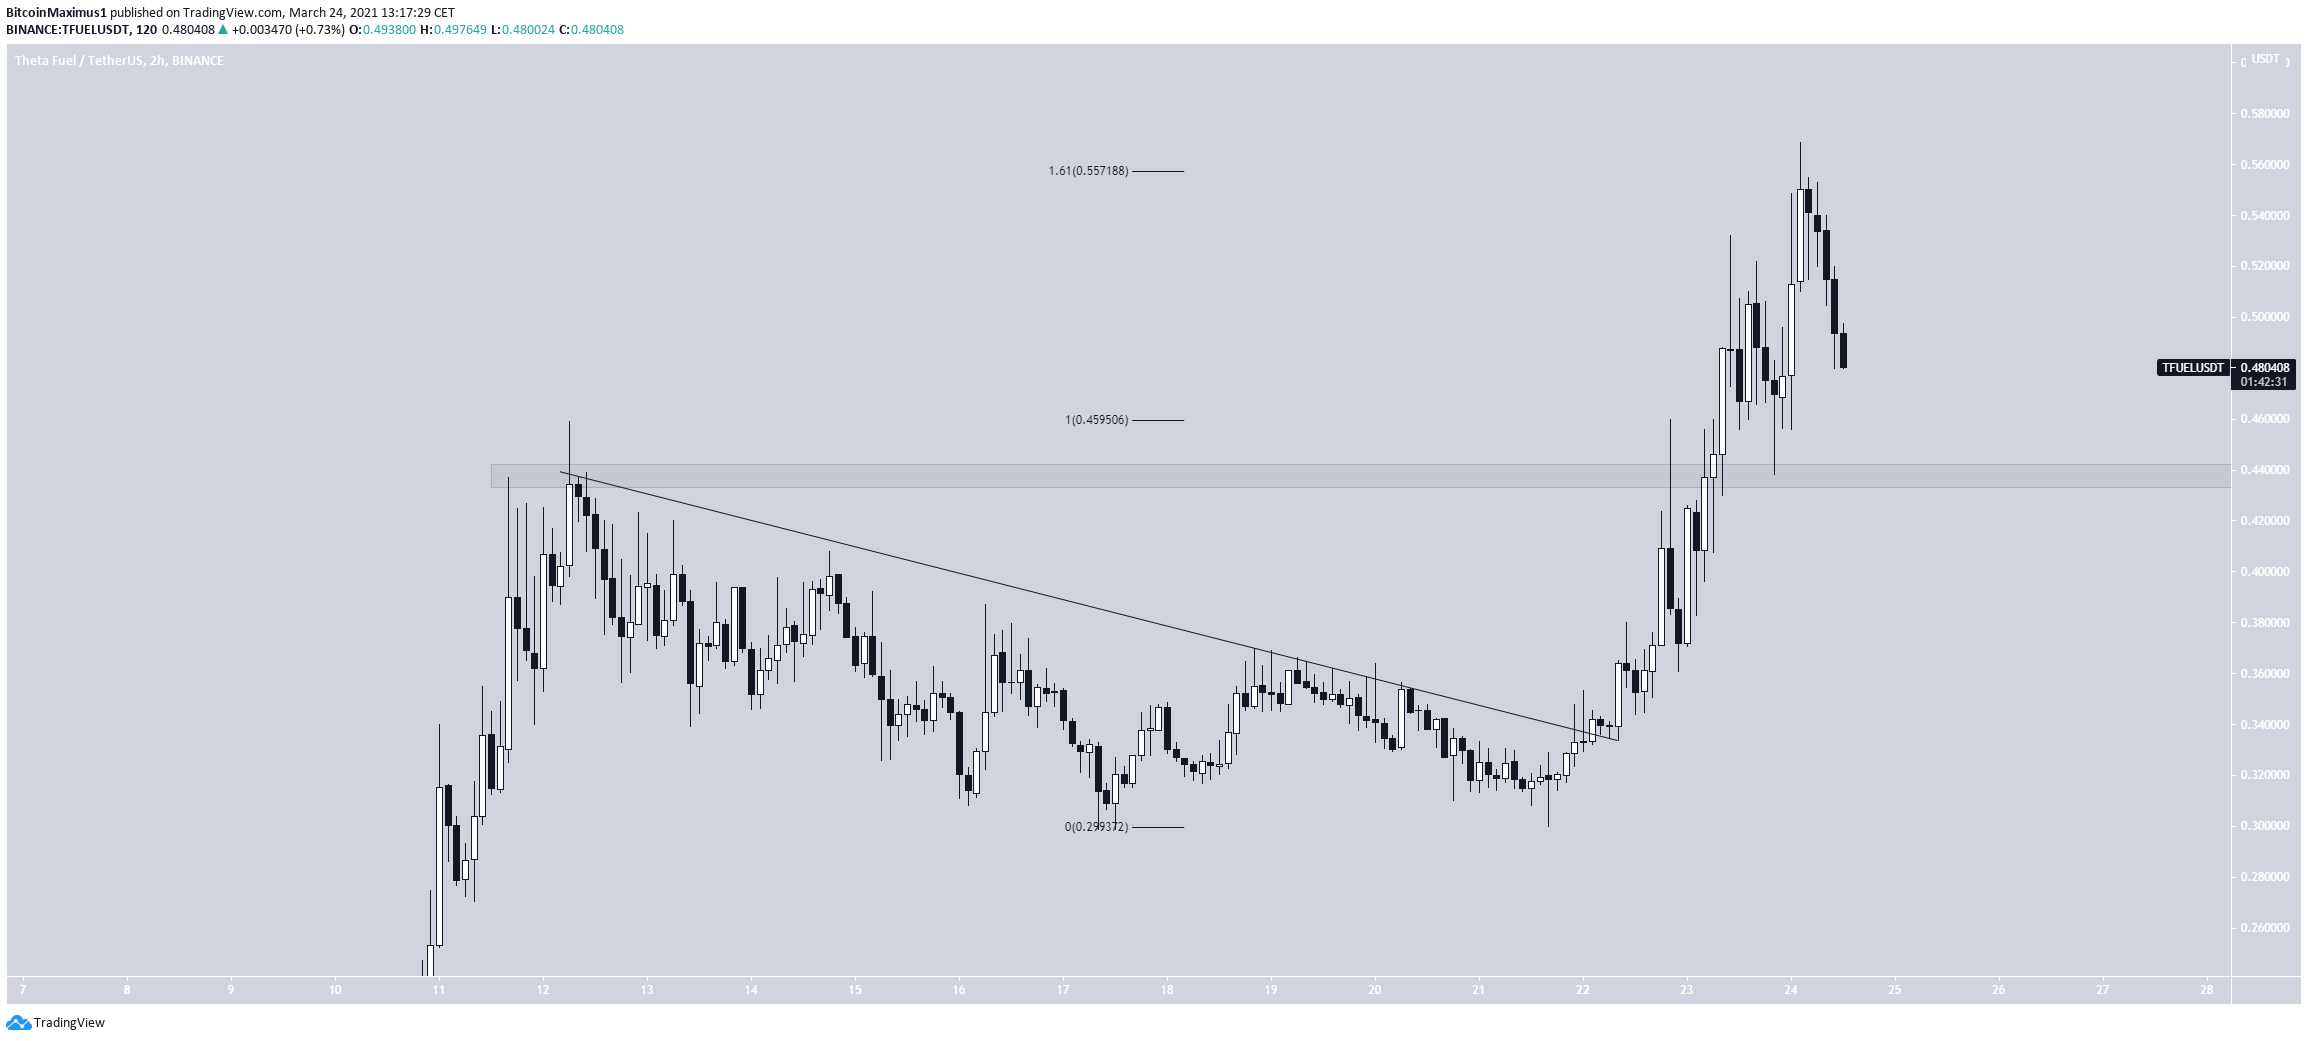
TFUEL began to decrease on March 12, once it reached a then all-time high price of $0.459.
Due to the overlap, the decrease looked corrective.
Shortly afterward, TFUEL managed to break out from its descending resistance line.
On March 24, it reached an all-time high price of $0.568. The token made the high right at the 1.61 external Fib retracement of the previous drop.
Therefore, TFUEL is expected to decrease towards the $0.44 area, which previously acted as the all-time high.
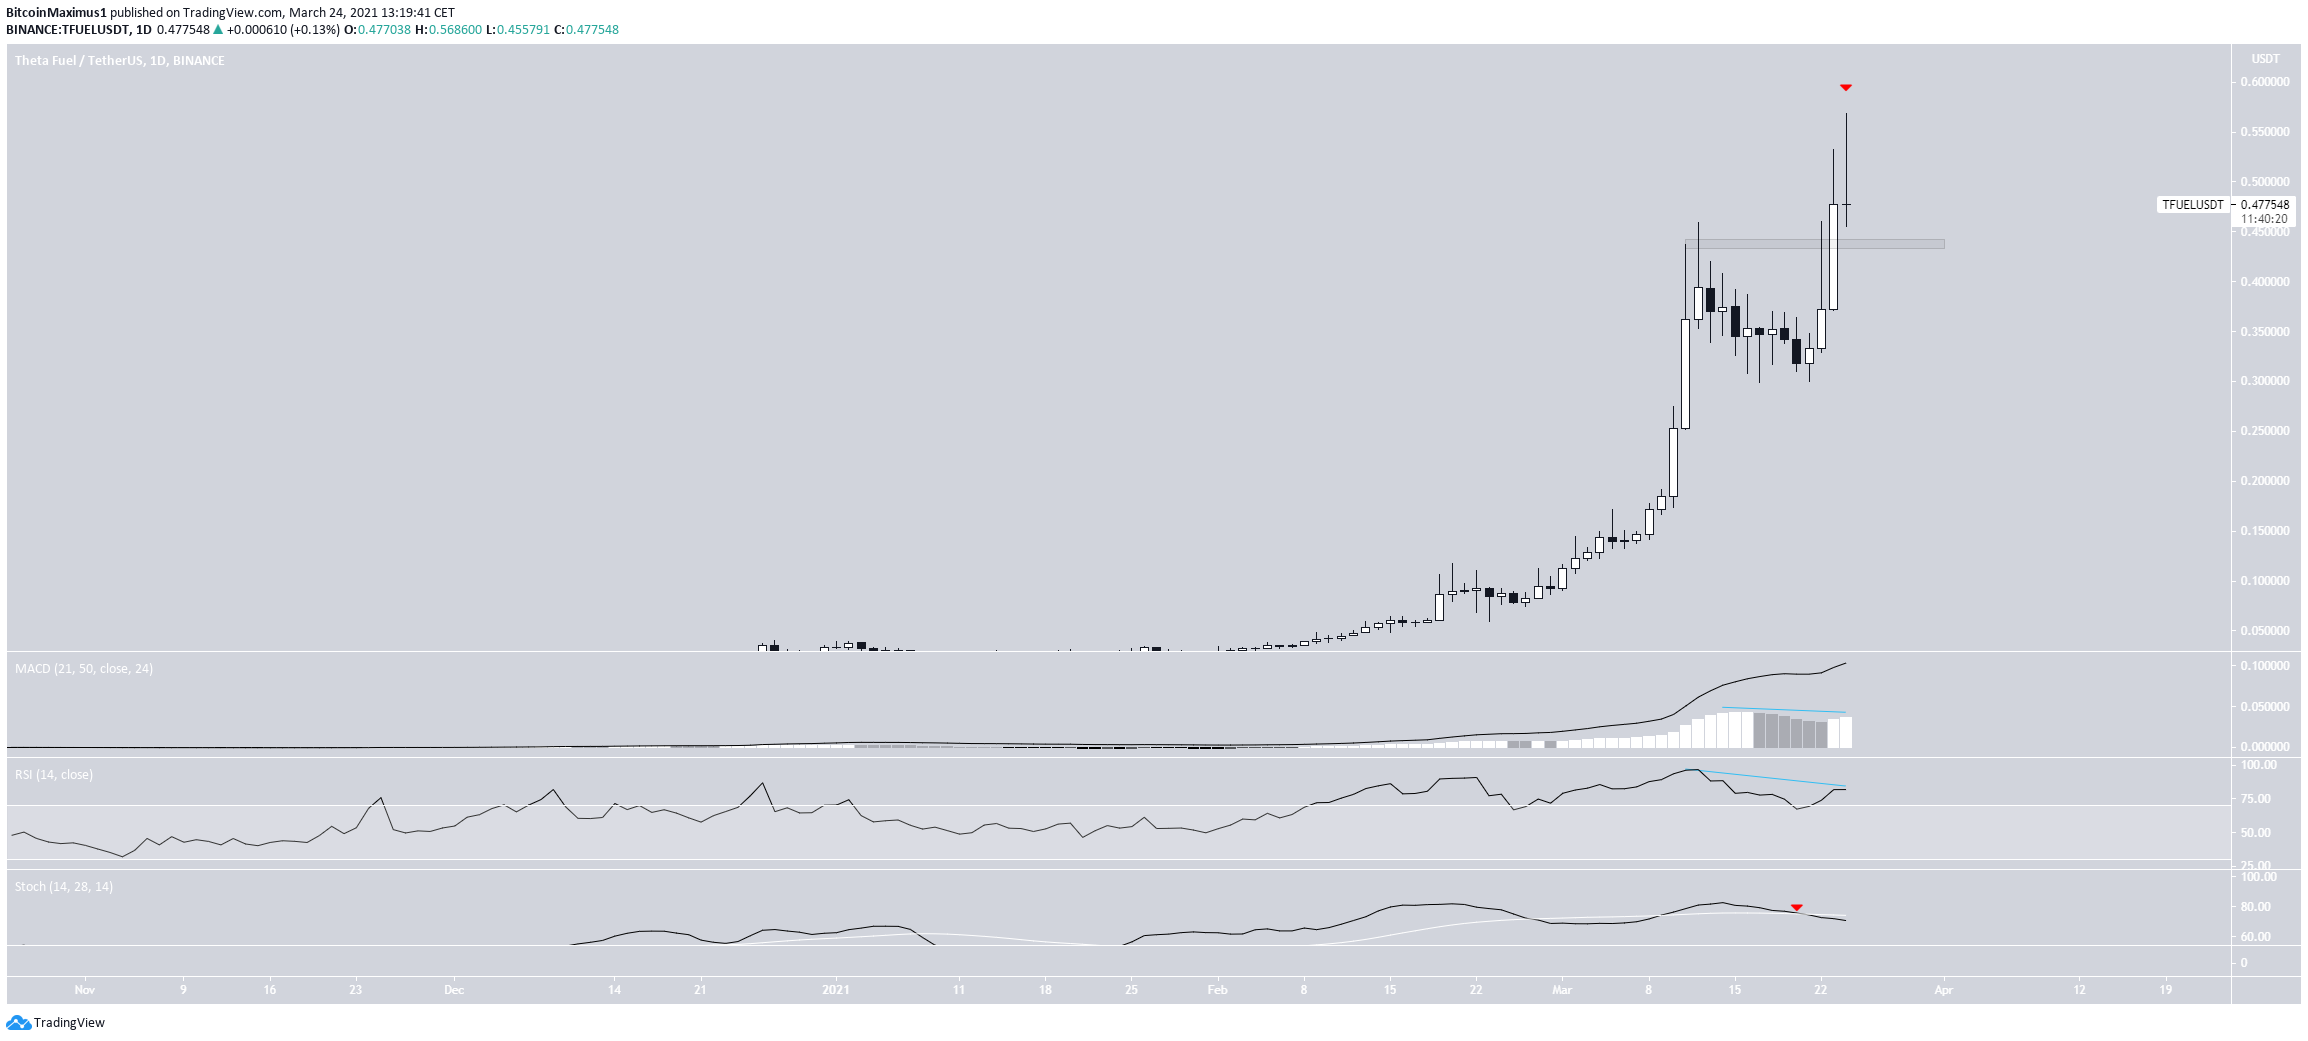
The daily chart looks more bearish. TFUEL is in the process of creating a shooting star candlestick. When coming after an upward trend, it is considered a bearish reversal sign.
Furthermore, both the MACD & RSI have generated bearish divergence. The Stochastic oscillator has made a bearish cross.
Therefore, while a bounce at the $0.44 area is expected, TFUEL may have reached the top of its upward movement.
- TFUEL has broken out from a descending resistance line.
- There is support at $0.44
Populous (PPT)
At the end of January, PPT/BTC broke out from a long-term descending resistance line, which had been in place for more than six months.
Afterwards, it validated it as support and has been moving upwards since.
The upward movement was preceded by hidden bullish divergence in the RSI. Furthermore, the Stochastic oscillator has made a bullish cross.
If PPT continues to increase, as is expected, it will find the next resistance area at 9200 satoshis.
Highlights
- PPT has broken out from a long-term descending resistance line.
- There is resistance at 9200 satoshis.
For BeInCrypto’s latest Bitcoin (BTC) analysis, click here.
