


The Tomochain (TOMO) price decreased considerably on Feb. 21-22 but regained all of its losses in the following two days to reach an all-time high price of $2.66 on Feb. 24.
While the trend is still bullish, TOMO is likely approaching the top of its current upward movement.
Current Movement
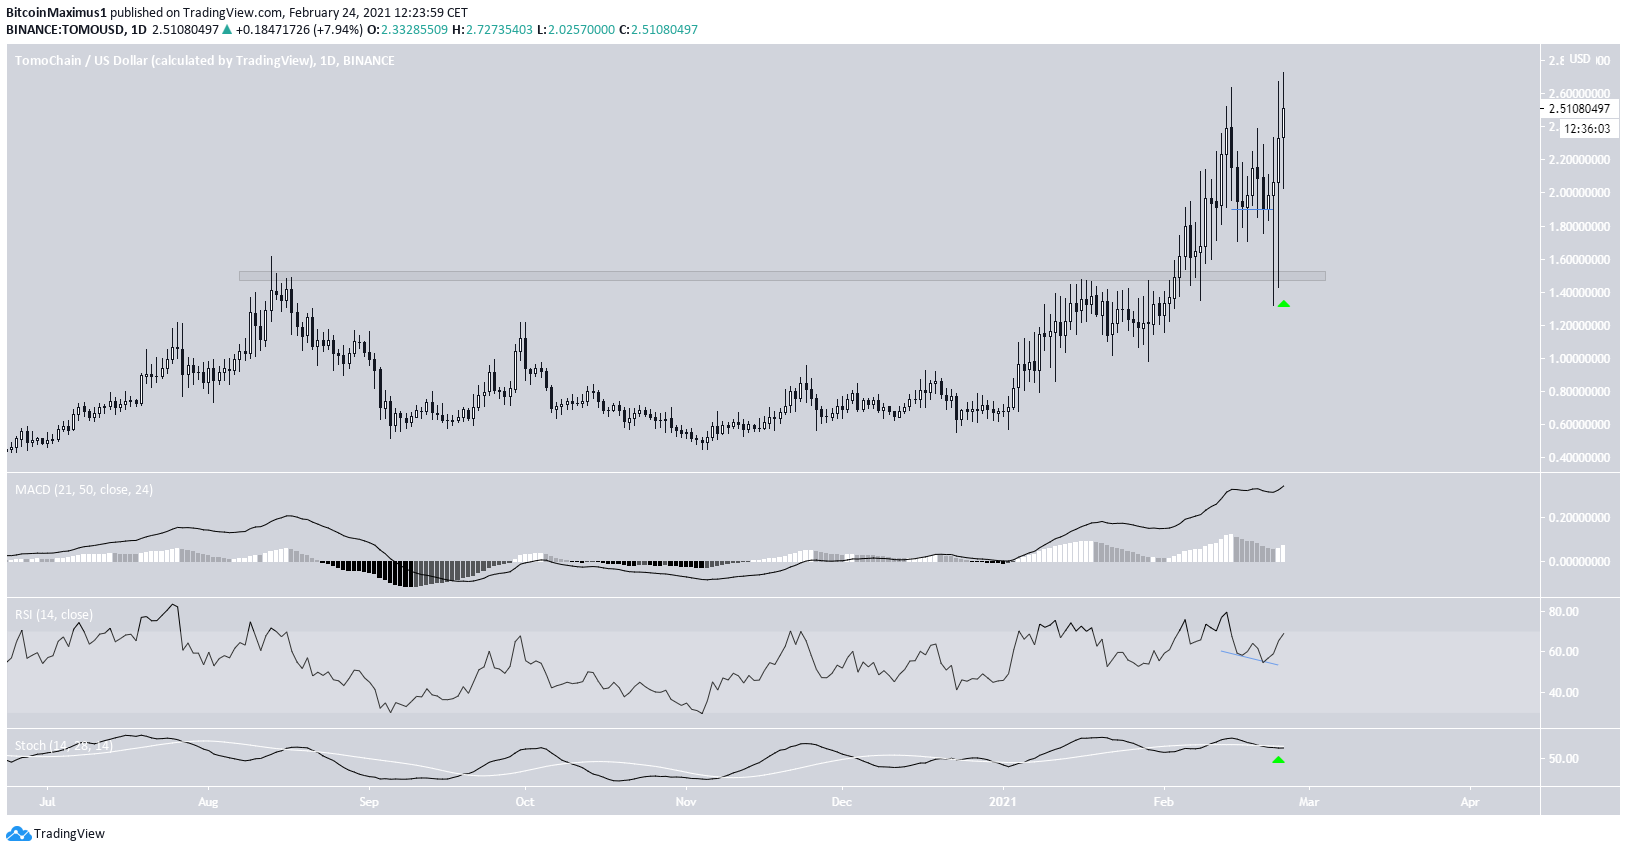
On Feb. 13, TOMO reached a high of $2.48 and began a downward move shortly afterward, culminating with a low of $1.44 on Feb. 22.
However, the decrease only served to validate the previous all-time high area of $1.50 as support. It then bounced. So far, TOMO has reached a new all-time high price of $2.66.
Technical indicators are bullish since the RSI has formed hidden bullish divergence and is increasing alongside the MACD. A bullish cross in the Stochastic Oscillator would confirm the bullish trend.
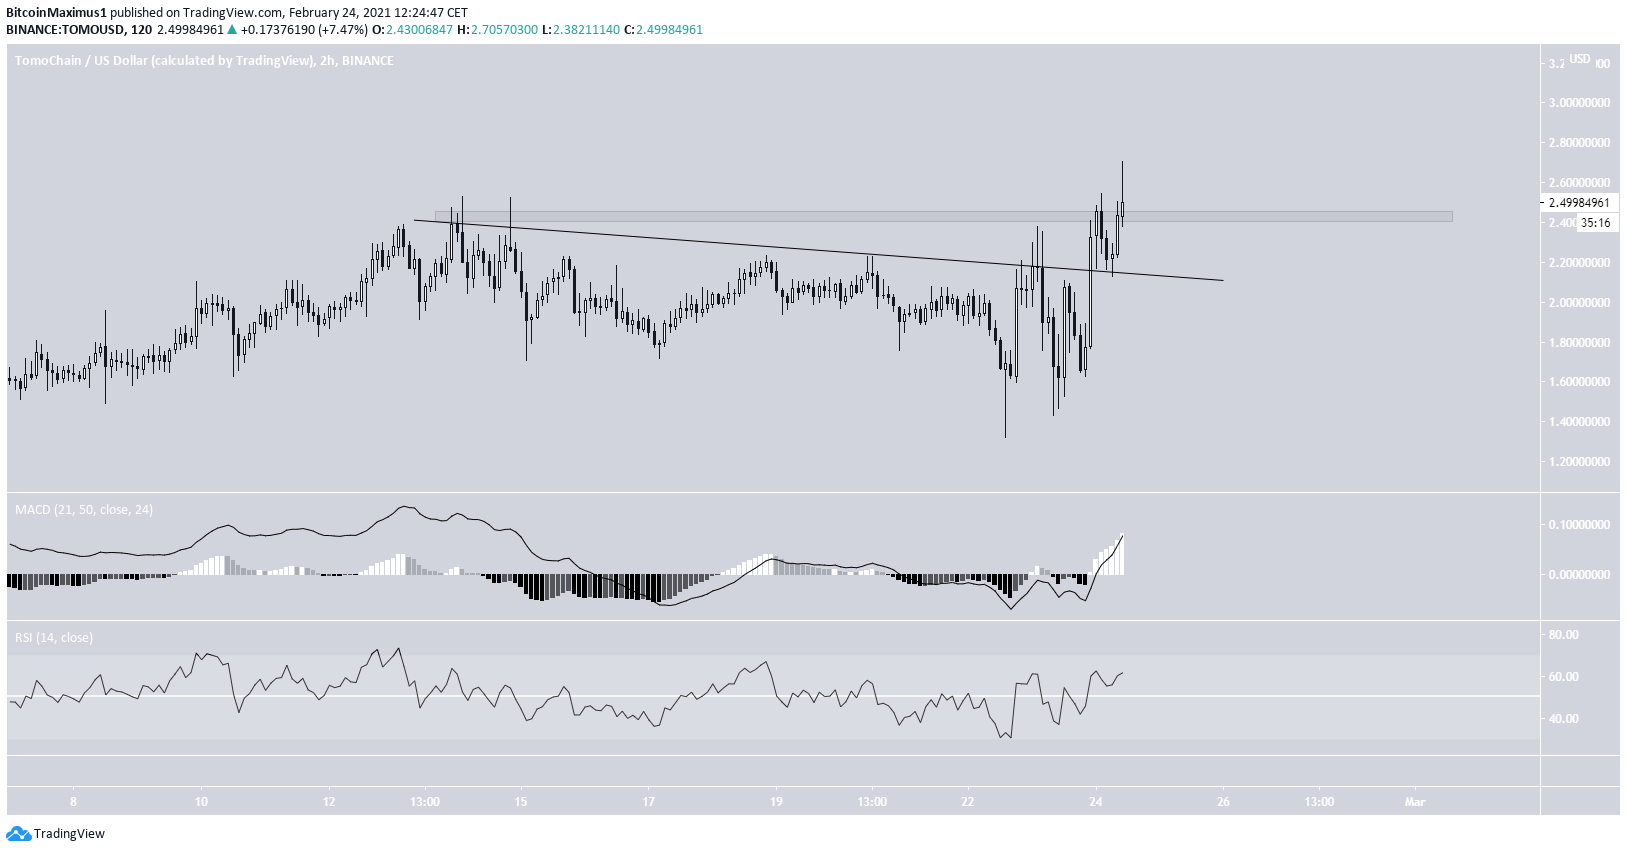
The short-term chart supports this outlook since it shows a breakout from a descending resistance line and its subsequent validation as support.
Since TOMO has already moved above the minor $2.40 resistance area, it should continue increasing, a possibility also supported by the bullish readings from the MACD and RSI.
Wave Count
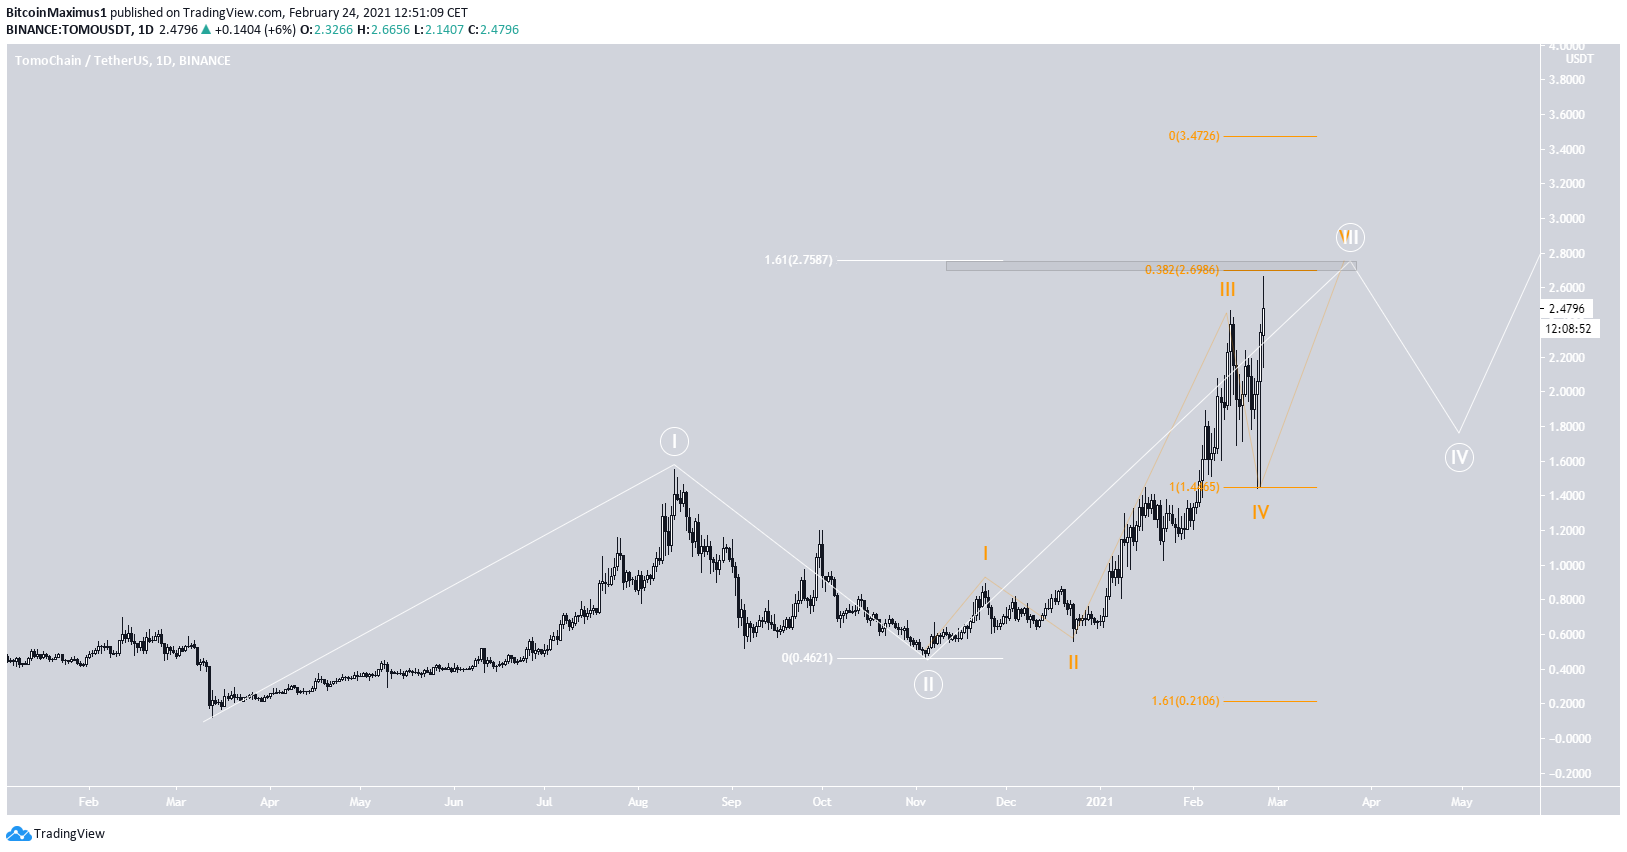
The wave count suggests that TOMO is in sub-wave five (orange) of a long-term wave three (white), which began on Nov. 5, 2020.
It has nearly reached a potential target for the top of the upward movement between $2.69-$2.75.
While the current move may extend towards the next likely target at $3.47, it seems as if it’s approaching the top of its upward movement.
TOMO/BTC
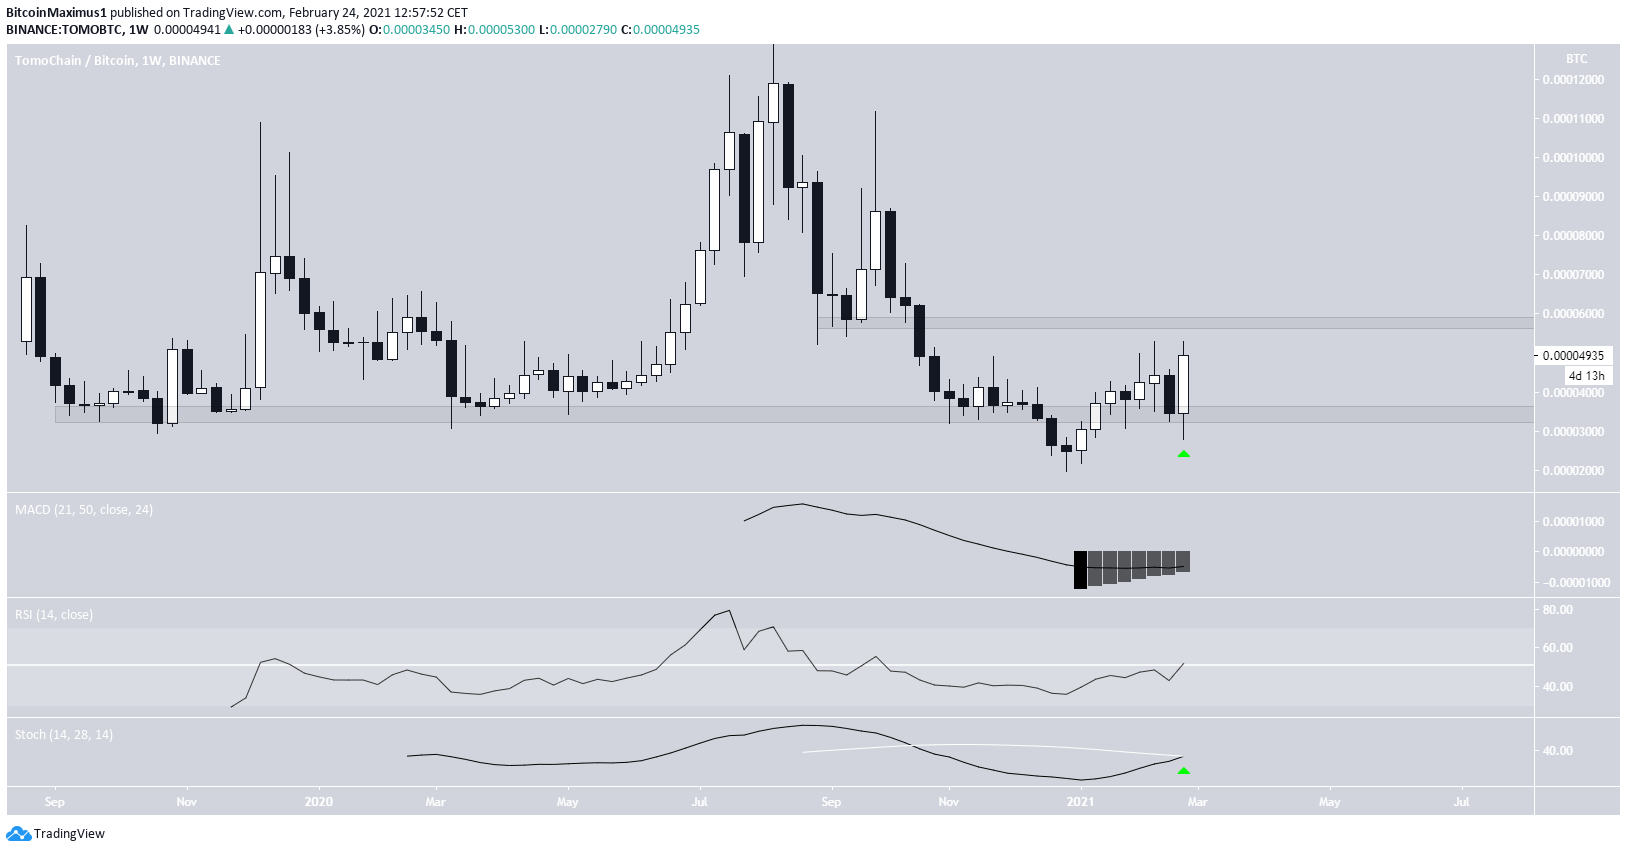
Cryptocurrency trader @AltcoinSherpa outlined a TOMO/BTC chart, which shows a reclaim of a long-term support level at 3,400 satoshis.
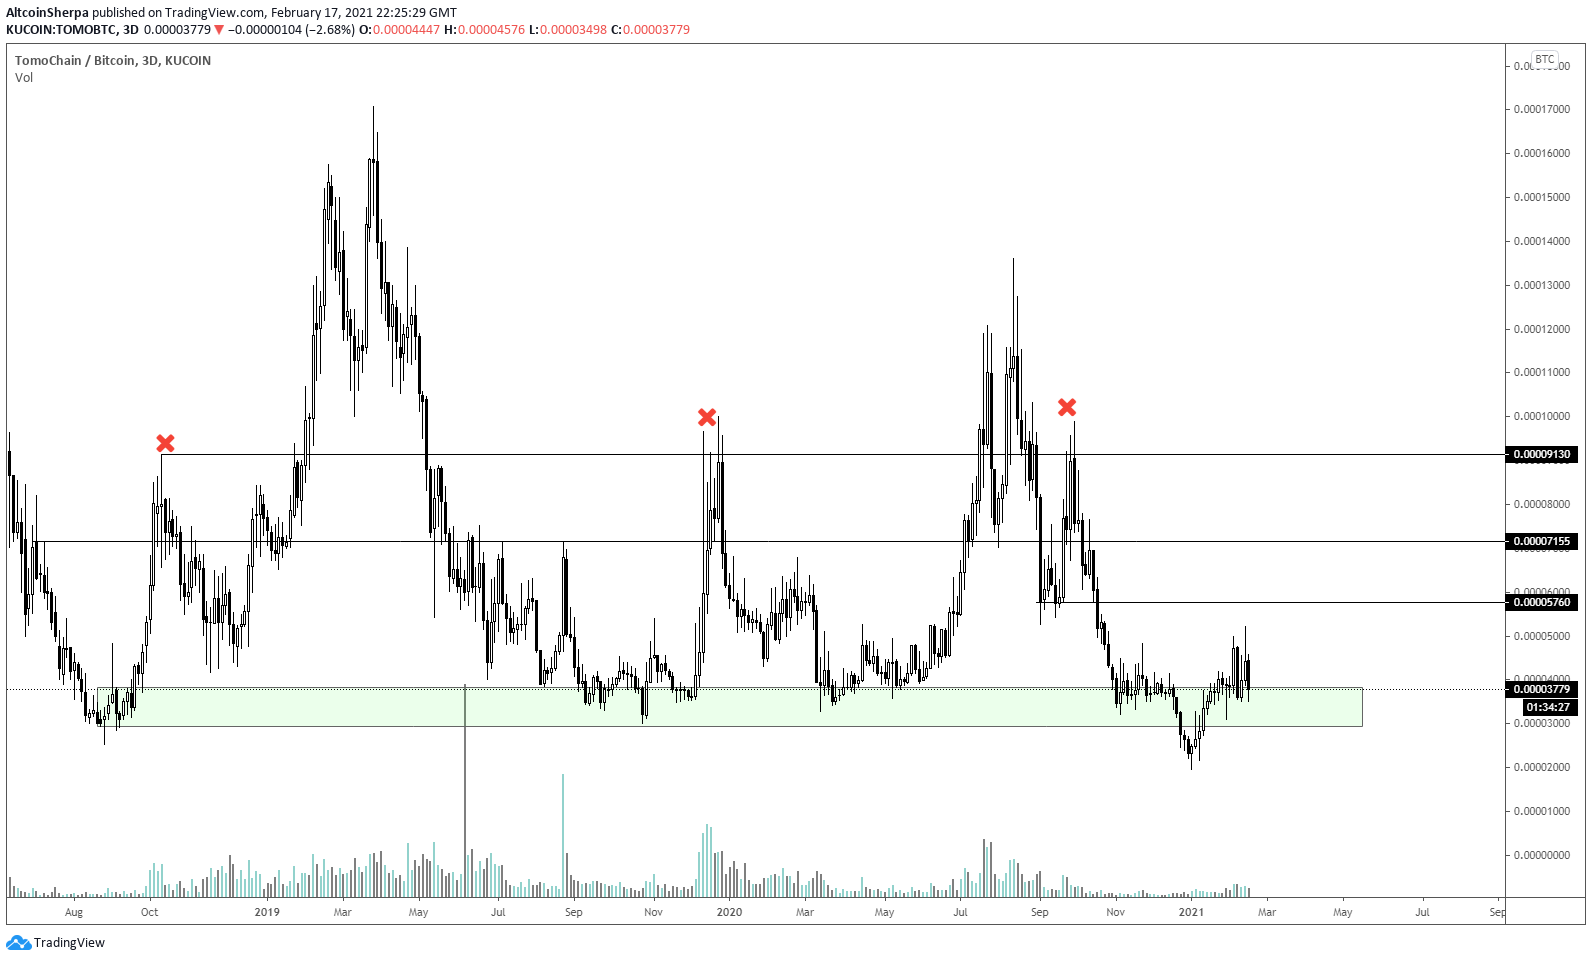
Since the tweet, TOMO has validated the level again and has begun to move upwards. While there is a resistance area at 6,000 satoshis, the path to further rallies is clear once it manages to clear this level.
Technical indicators are bullish and support the possibility that it reaches the 6,000 area and eventually breaks out.
Conclusion
To conclude, while the trend is still bullish, the upward move is likely nearing its conclusion. Meanwhile, due to the reclaim of the 3,400 satoshi area, the TOMO/BTC trend also appears to be bullish.
For BeInCrypto’s latest Bitcoin (BTC) analysis, click here.


