


TomoChain (TOMO) has broken out from a descending resistance line but was rejected from the $2.59 resistance area.
Both the BTC and USD pairs have bullish structures and are creating higher highs and higher lows.
TOMO breaks out
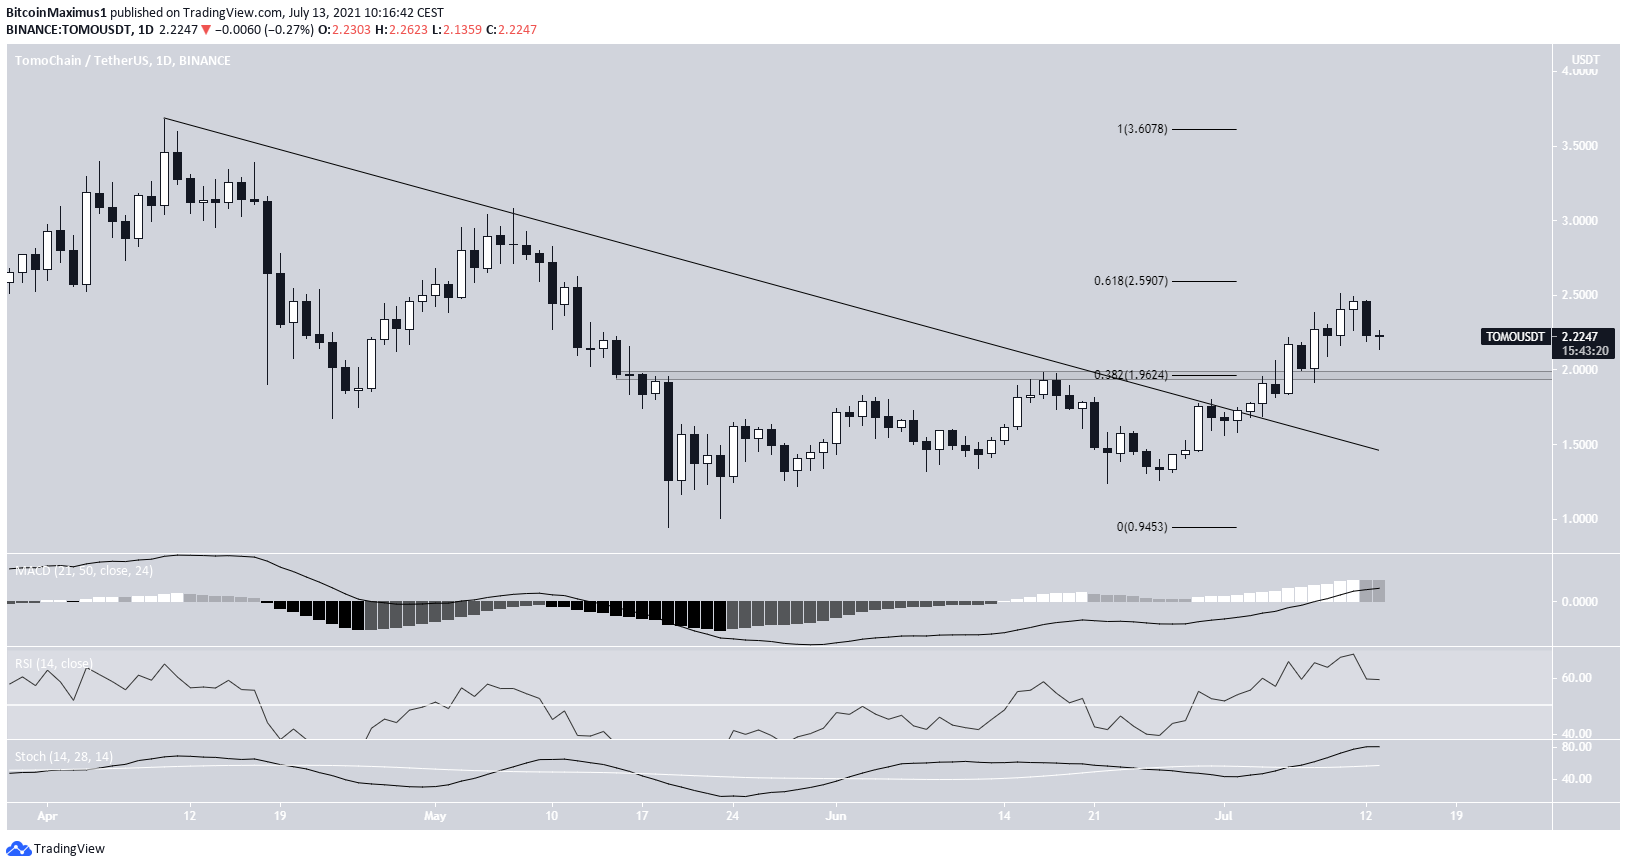
Tomochain had been following a descending resistance line since April 10, until it reached a low of $0.94 on May 19. It has been moving upwards since.
On July 2, TOMO broke out from a descending resistance line and reclaimed the $1.96 horizontal area shortly afterwards.
So far, it has reached a high of $2.51 on July 10.
While the $1.96 area is now expected to act as support, the $2.59 area (0.618 Fib retracement level) is expected to act as resistance.
Technical indicators are bullish. The RSI has moved above 50, the Stochastic oscillator has made a bullish cross, and the MACD is nearly positive.
Therefore, it’s likely that the trend is bullish. An increase above the $2.59 resistance area could trigger an upward movement towards the $3.60 highs.
Short-term movement
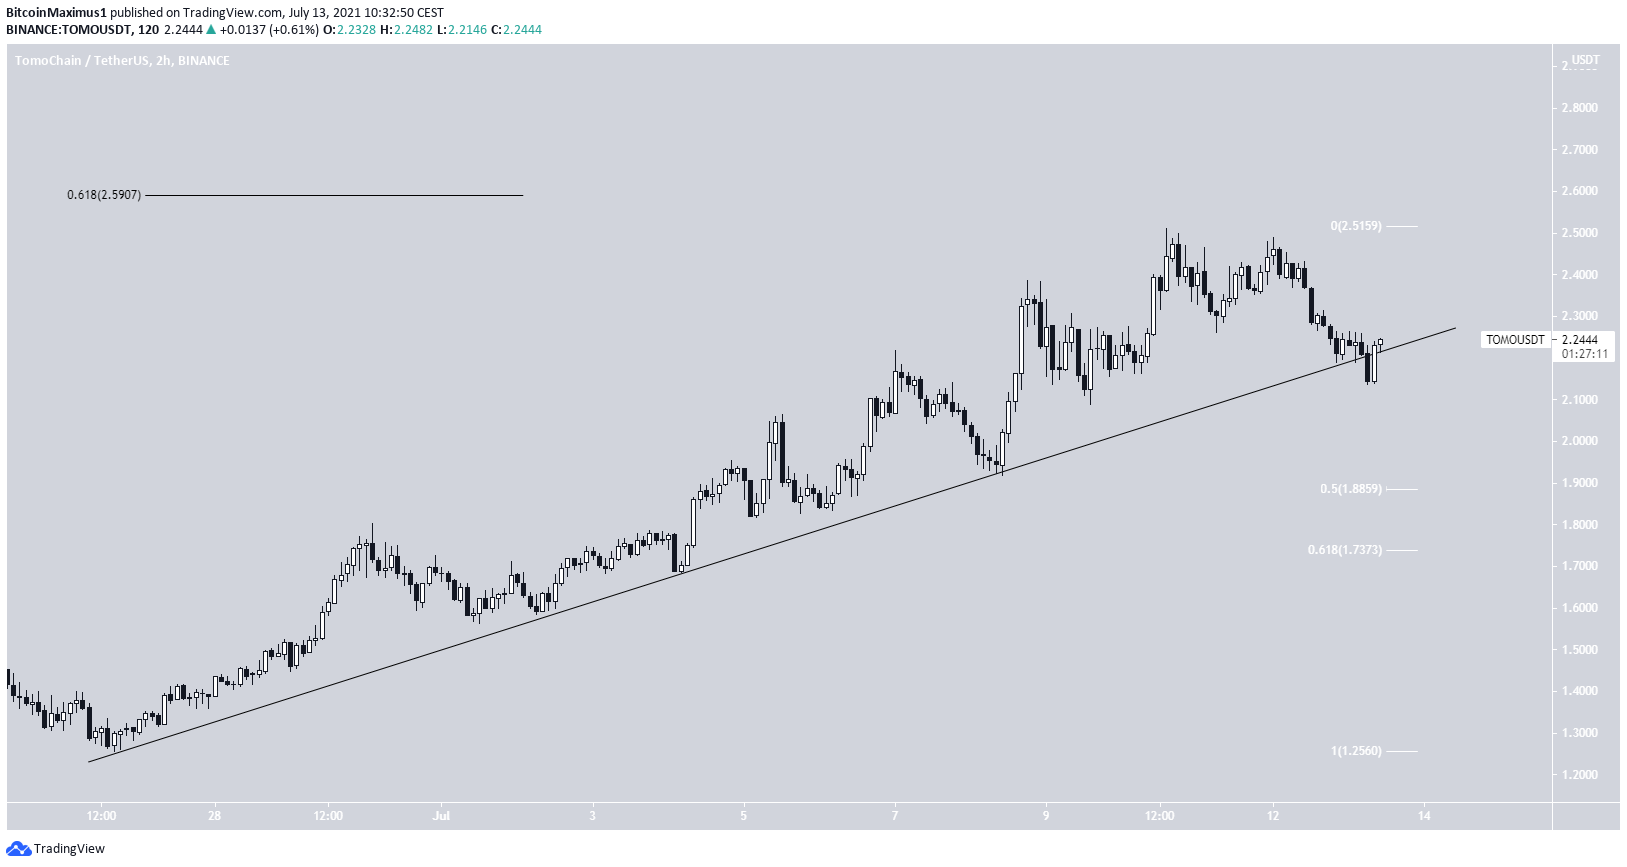
The two-hour chart shows that TOMO has been following a very steep ascending support line since June 26. It’s currently trading just above support line.
As long as it continues trading above it, the price is expected to move upwards and make another breakout attempt above $2.59.
Conversely, a close below the support line could likely take the price towards the $1.73-$1.88 support area.
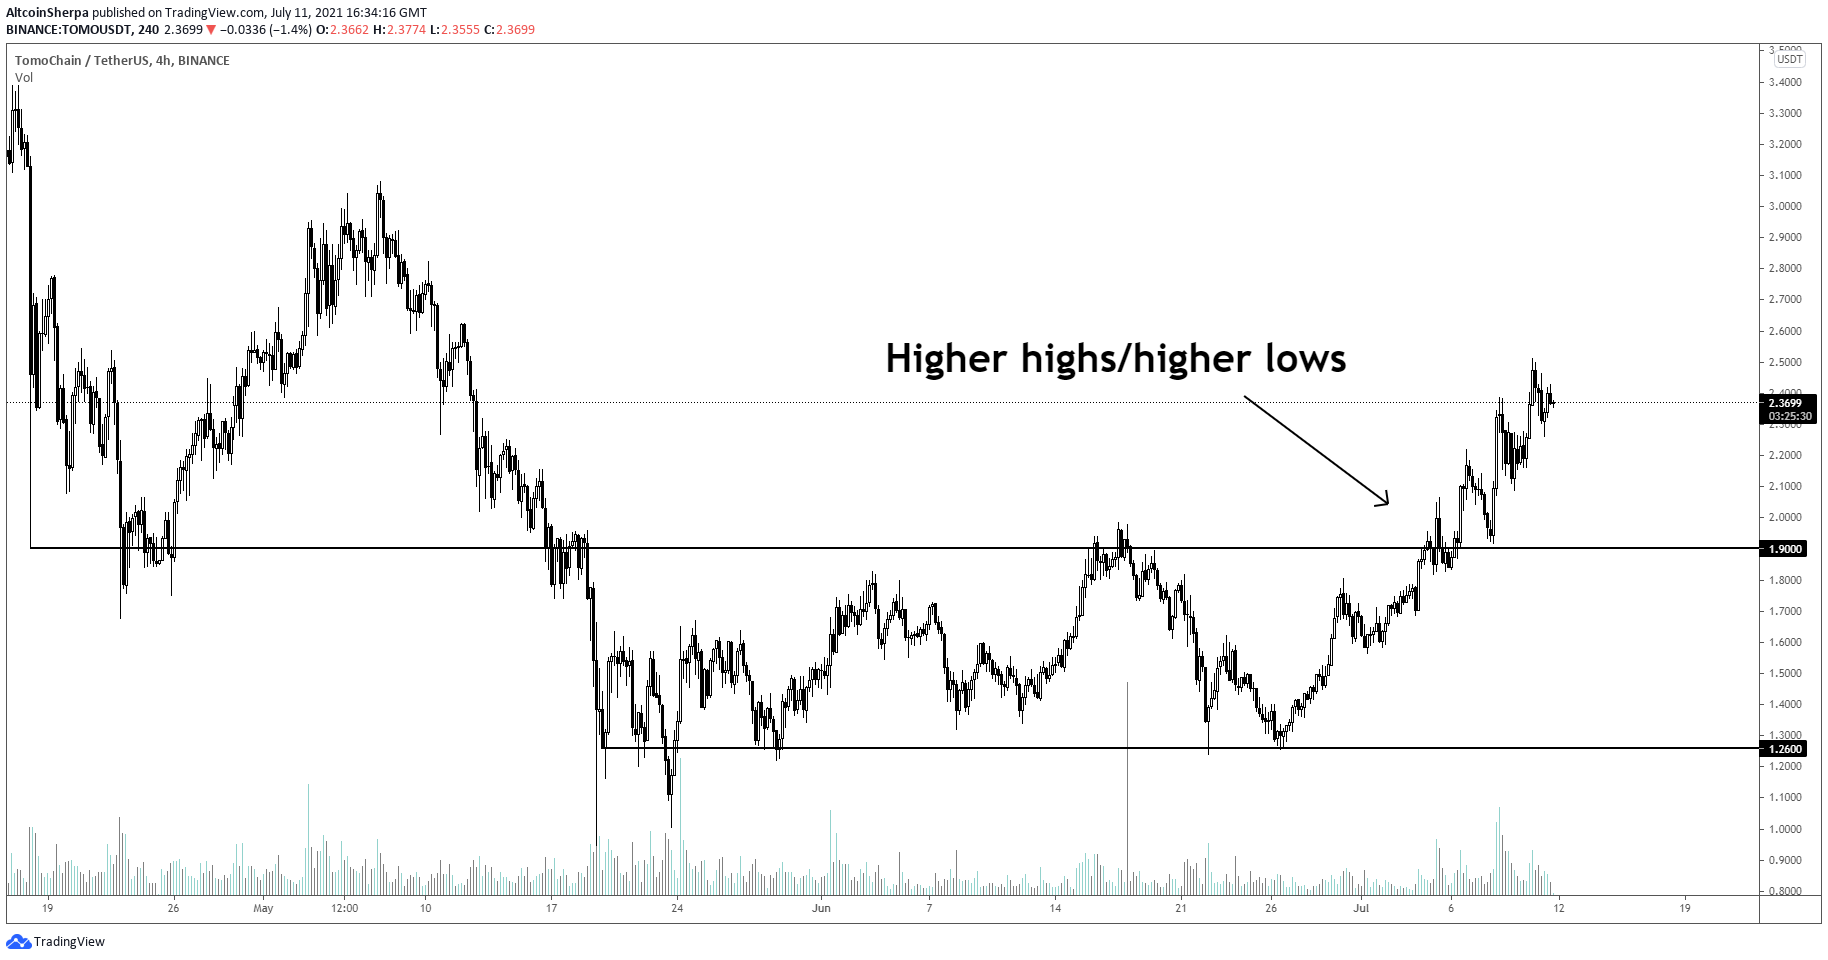
Cryptocurrency trader @Altcoinsherpa tweeted a TOMO chart, stating that the price is consistently making higher lows and higher highs. As seen above, these higher lows and highs have created the previously outlined ascending support line.
TOMO/BTC
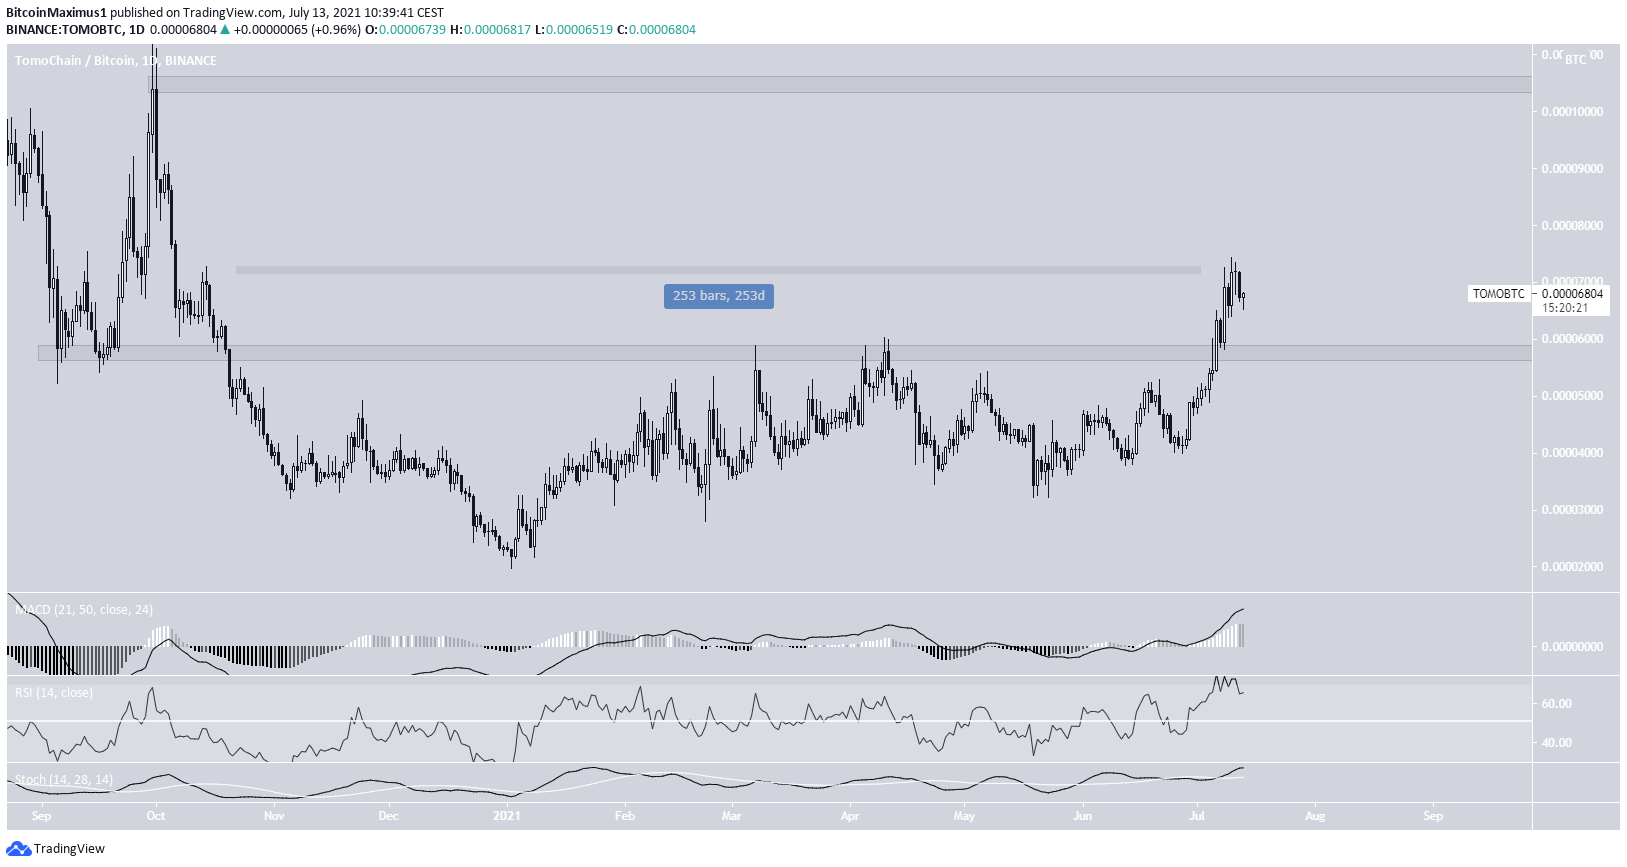
The TOMO/BTC pair looks decisively bullish.
After a 253 day period of consolidation below the 5,800 satoshi area, it has finally managed to break out on July 6. So far, it’s managed to reach a high of 7,435 satoshis.
Similar to the USD pair, technical indicators are bullish. The MACD is positive, the RSI is above 70, and the Stochastic oscillator has made a bullish cross.
The next resistance is found at 10,500 satoshis.
For BeInCrypto’s latest bitcoin (BTC) analysis, click here.


