
Tomochain (TOMO) has been moving upwards since May 19 and has reclaimed the $1.50 support area in the process.
It has nearly reached a crucial horizontal and diagonal resistance level, from which a breakout is expected.
Bounce at long-term support
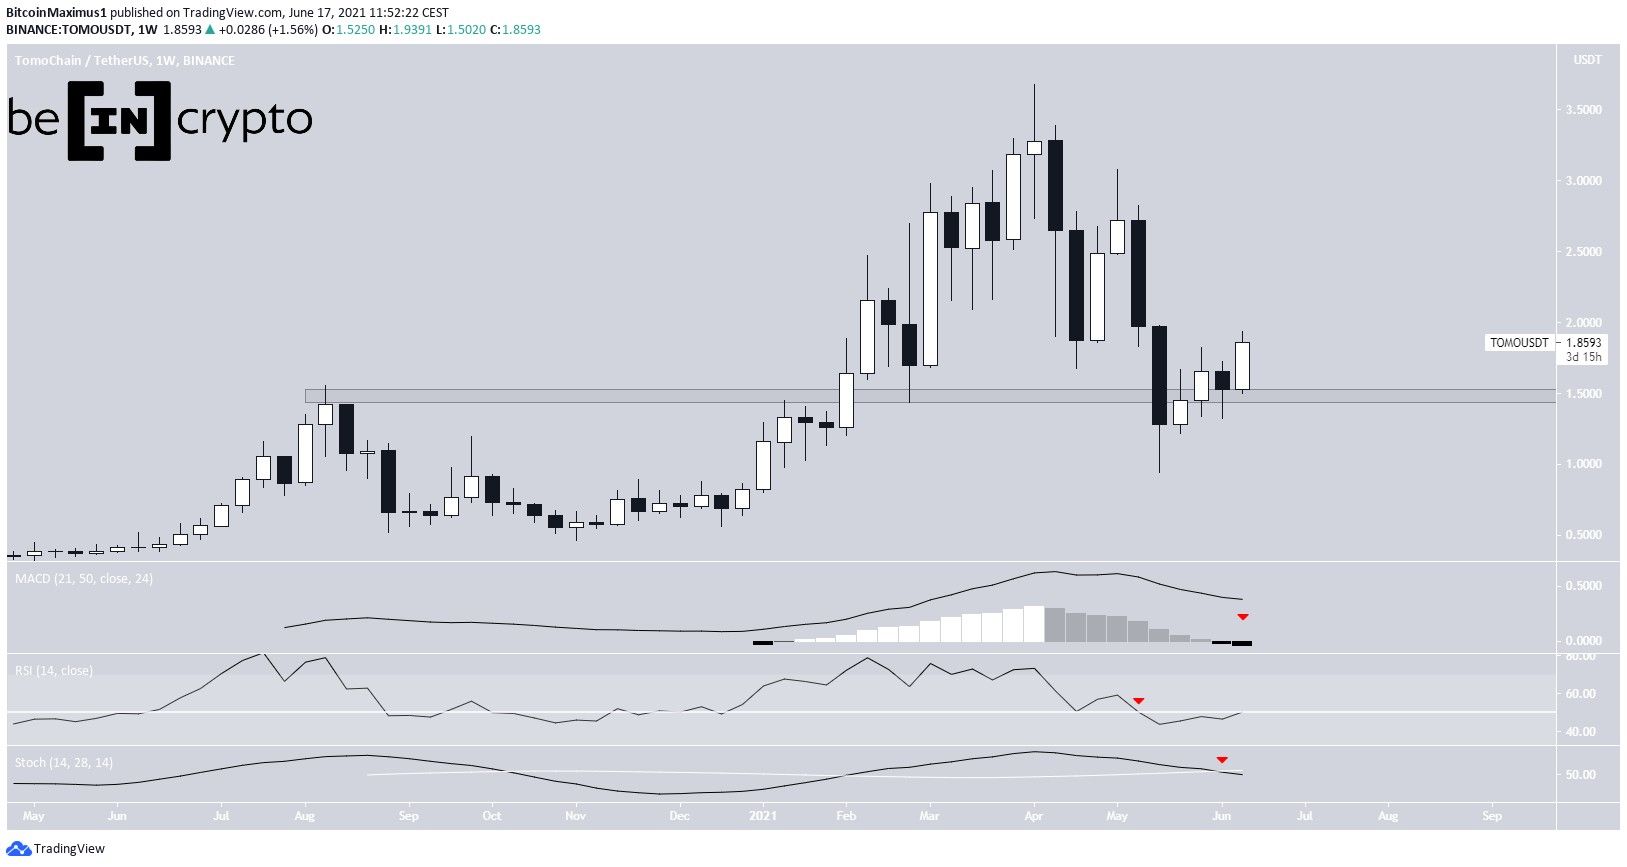
TOMO has been moving downwards since April 10, when it reached an all-time high of $3.67. The decrease continued until a low of $0.94 was reached on May 19.
However, the token bounced almost immediately afterwards and has been moving upwards since. The ongoing upward movement caused a reclaim of the $1.45 support area, a level which had previously acted as resistance on Aug. 2020.
Despite the ongoing increase, technical indicators in the weekly time-frame are bearish. The RSI has fallen below 50, the Stochastic oscillator has made a bearish cross and the MACD histogram is negative (red icons).
Therefore, it is likely that the long-term trend is bearish.
Will TOMO break out?
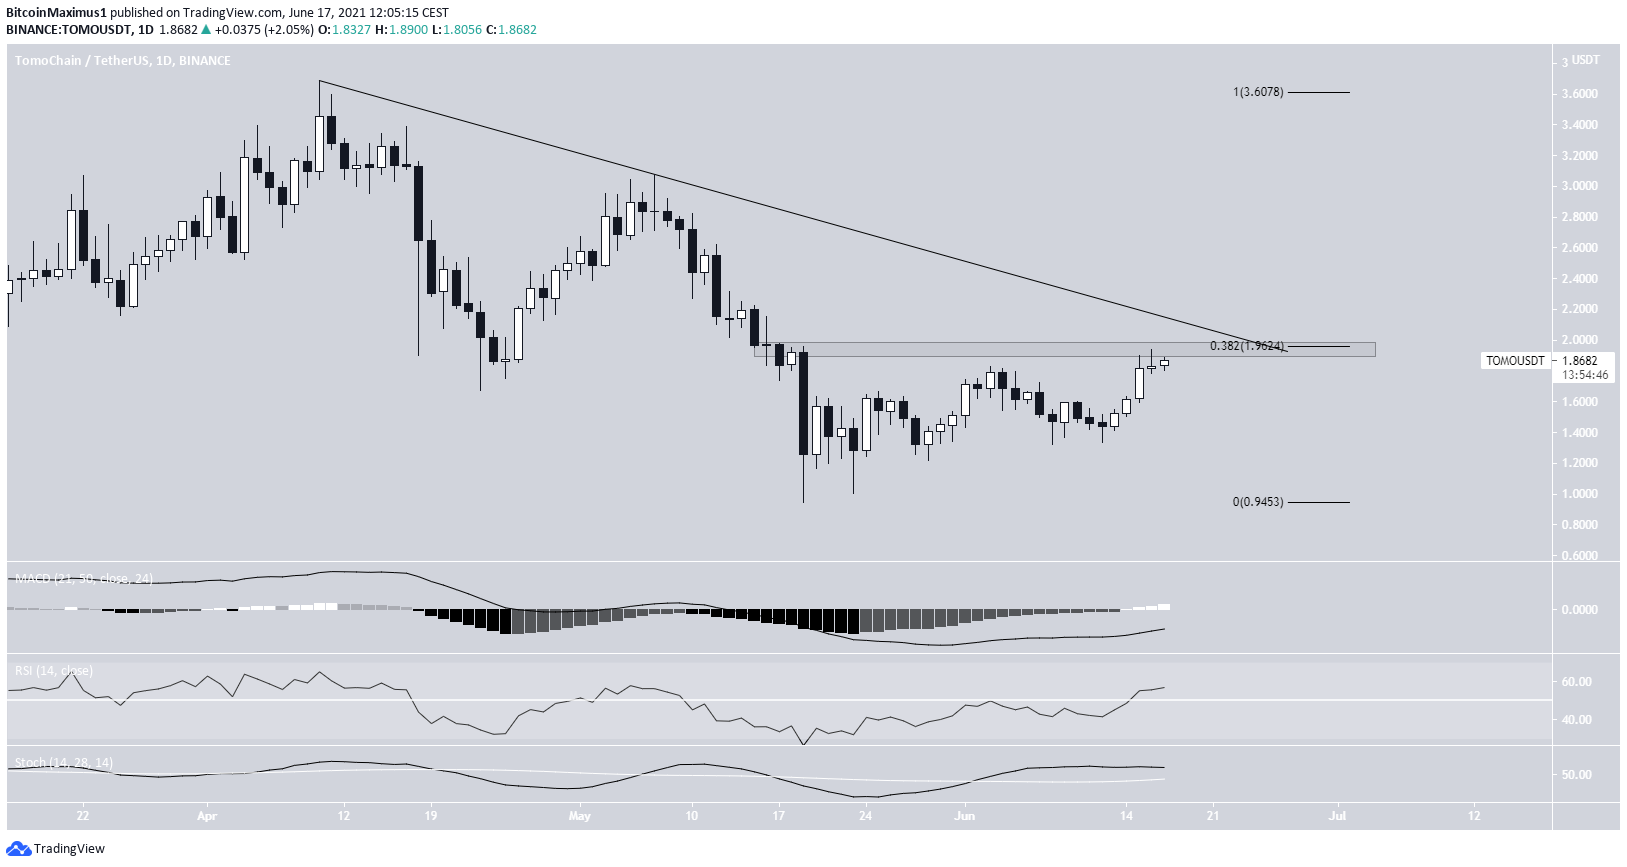
The daily chart provides a bullish outlook. TOMO has created three higher lows since the May 19 drop and has nearly reached the $1.96 area.
The $1.96 area is the 0.382 Fib retracement level and a horizontal resistance area. In addition, it coincides with a descending resistance line in place since the aforementioned high.
Therefore, until a breakout occurs, the trend cannot be considered bullish.
However, the MACD, RSI & Stochastic oscillator all point to a continued upward movement and eventual breakout. The RSI has crossed below 50 and the Stochastic oscillator & MACD are both increasing.
Therefore, an eventual breakout is expected.
TOMO/BTC
Cryptocurrency trader @CryptoMichNL outlined a TOMO/BTC chart, stating that the price could continue increasing towards the yearly highs near 5,850 satoshis.
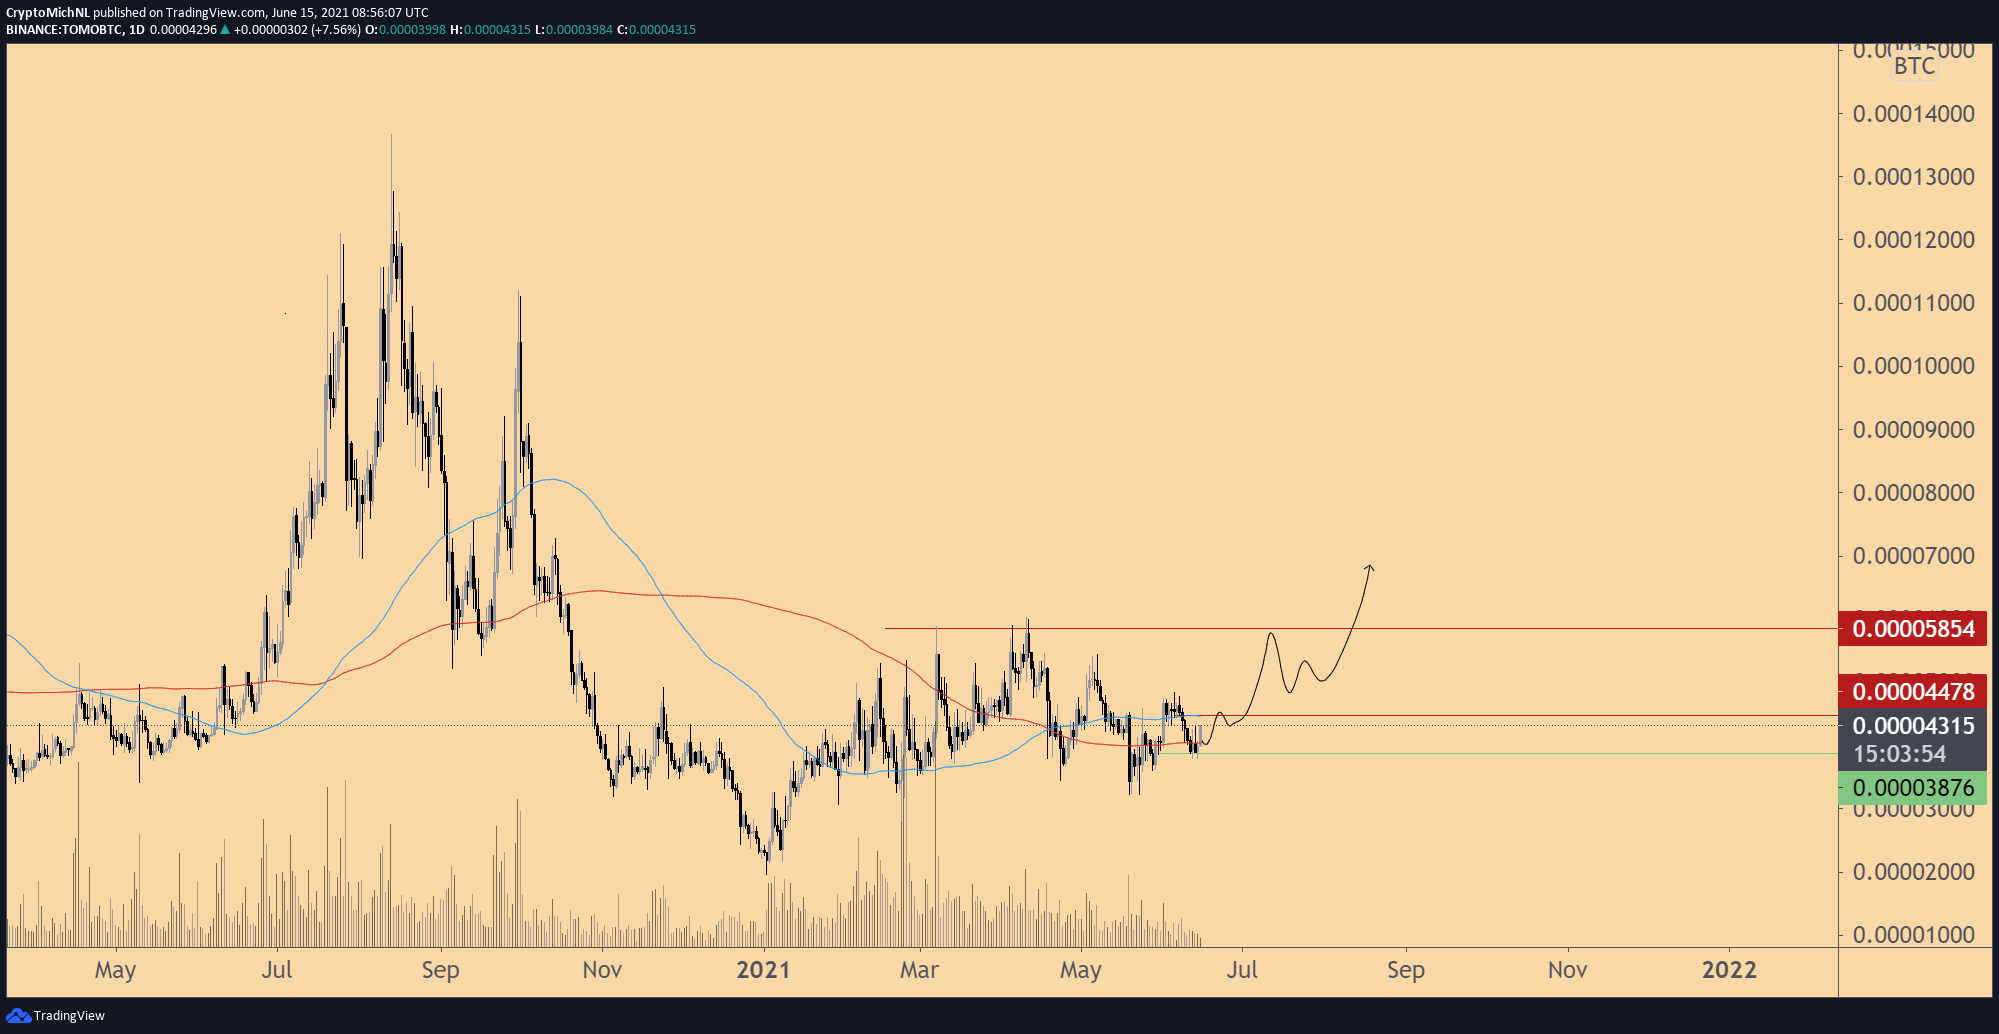
After deviating (red circle) below the all-time low 3,400 satoshi horizontal support area, TOMO/BTC has reclaimed it and validated it as support once more. It is now facing resistance at 5800 satoshis.
Furthermore, the token has broken out from a descending resistance line. In addition to this, technical indicators in the daily time-frame support the continuation of the upward movement.
Therefore, an increase towards the 5,800 satoshi area and potential breakout is likely. Due to the lack of overhead resistance, the latter could trigger a sharp upward movement.

For BeInCrypto’s latest bitcoin (BTC) analysis, click here.
