


As the broader crypto market starts the new trading week on a positive note, Celestia’s native coin, TIA, is today’s top gainer. The altcoin trades at $1.65, up 12% over the past day.
Technical indicators point to strong demand from spot traders, hinting at the possibility of an extended rally in the short term. This analysis explains why.
Strong Spot Demand Sends TIA Soaring
With today’s trading session already underway, TIA’s Elder-Ray Index has posted a green histogram bar, indicating mounting buying pressure in the market. As of this writing, this indicator, which tracks the strength of buyers and sellers, is at 0.150, its highest value since May 14.
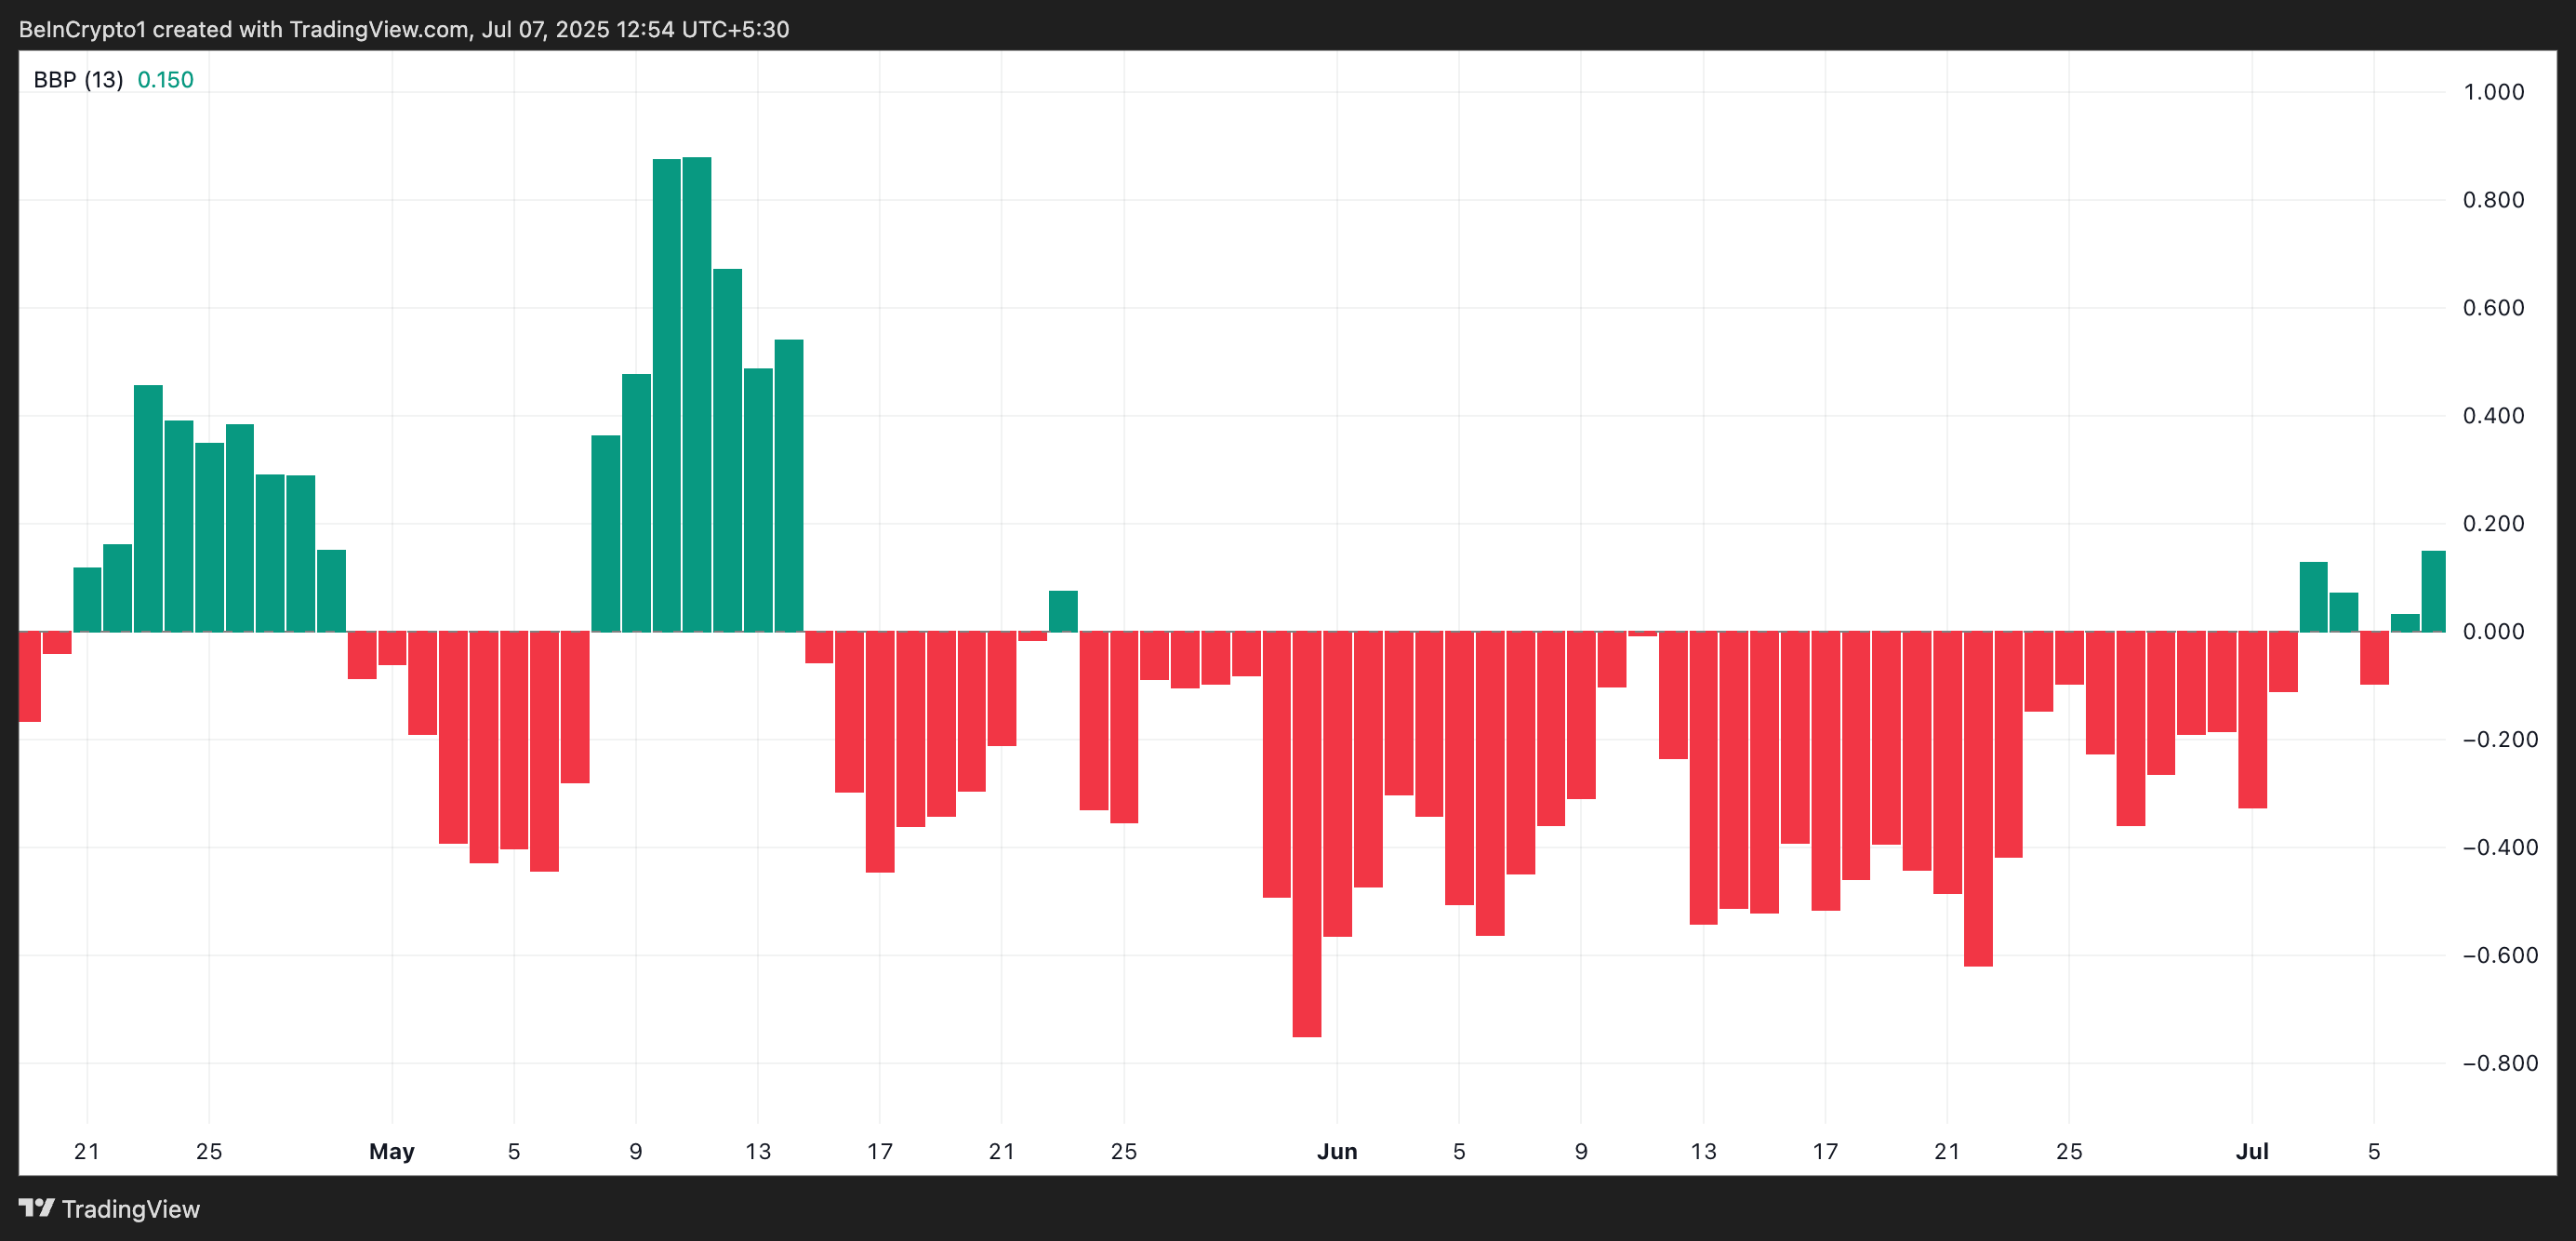
The Elder-Ray Index measures the strength of buyers and sellers by comparing current prices with an exponential moving average (EMA). When its value is positive, bulls (buyers) dominate the market, and there’s upward pressure on the asset’s price.
Traders view this as a bullish signal and could prompt them to accumulate more TIA coins, increasing the upward pressure on its price.
Further, readings from TIA’s Parabolic Stop and Reverse (SAR) indicator show that it has now formed dynamic support below the coin’s current price level. While TIA trades at $1.64, the indicator forms a support floor for its price at $1.42, indicating sustained interest from buyers.
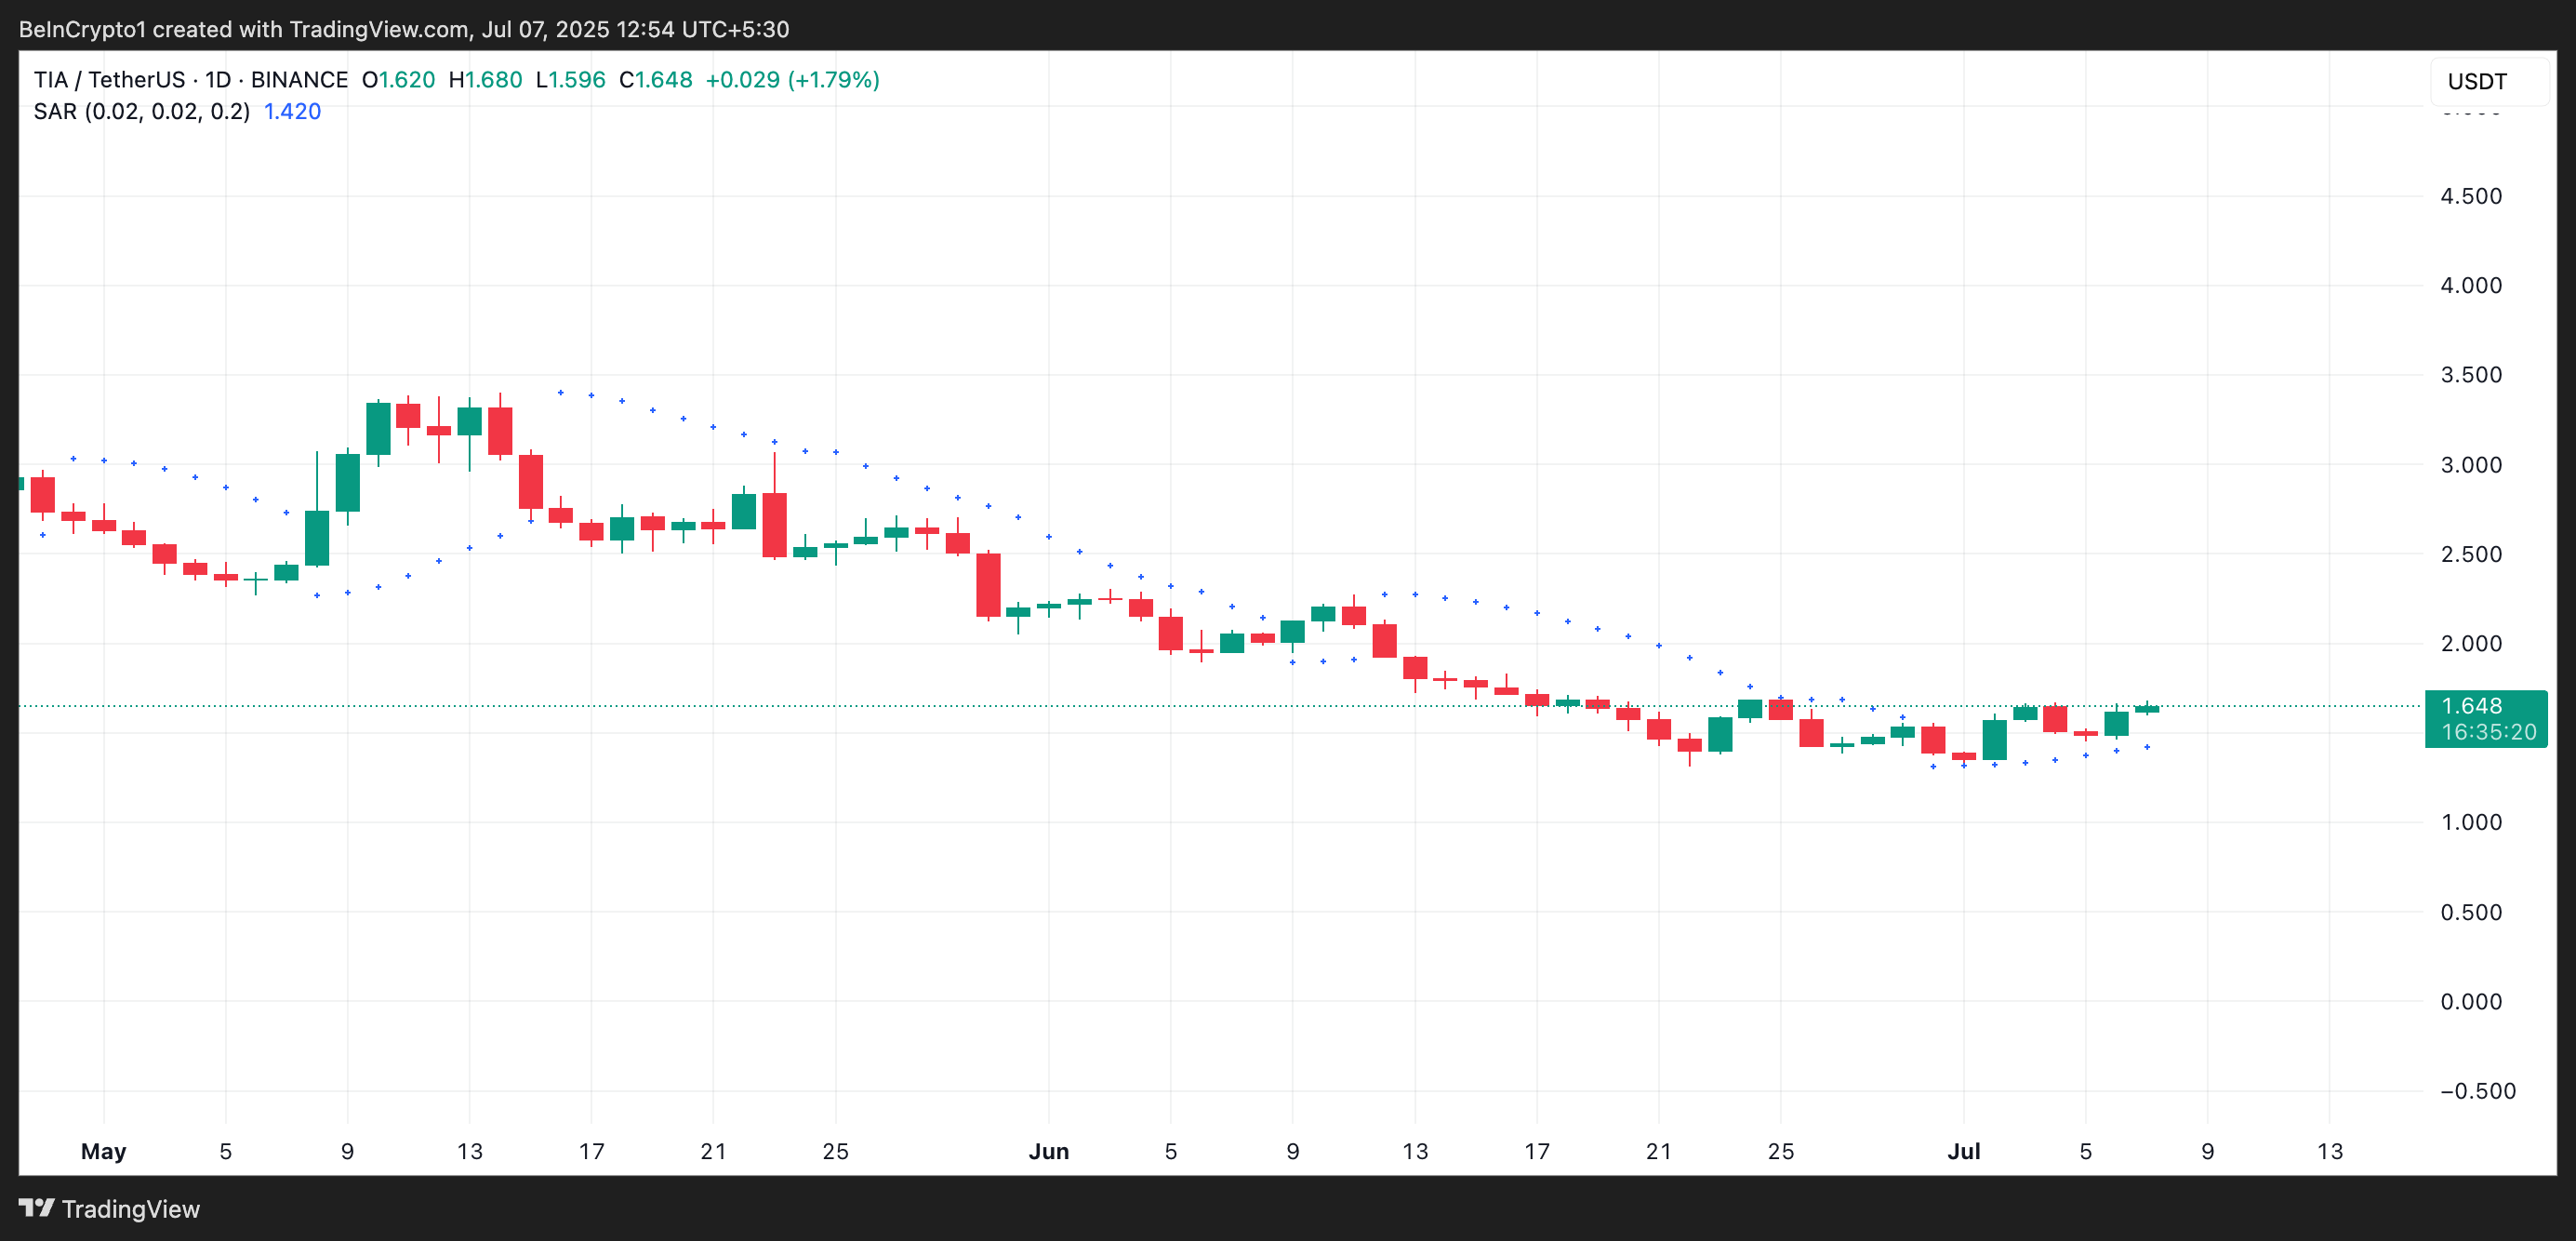
An asset’s Parabolic SAR indicator identifies potential trend direction and reversals. When its dots are placed under an asset’s price, it indicates it is witnessing bullish momentum, and its price could continue to rally if buying persists.
TIA Bulls Target $2 as Momentum Builds—But Risks Linger
With upward momentum building, TIA could reclaim the key psychological level of $2 soon if the current trend holds. A break above the $2 price level could pave the way for a further rally toward $2.27.
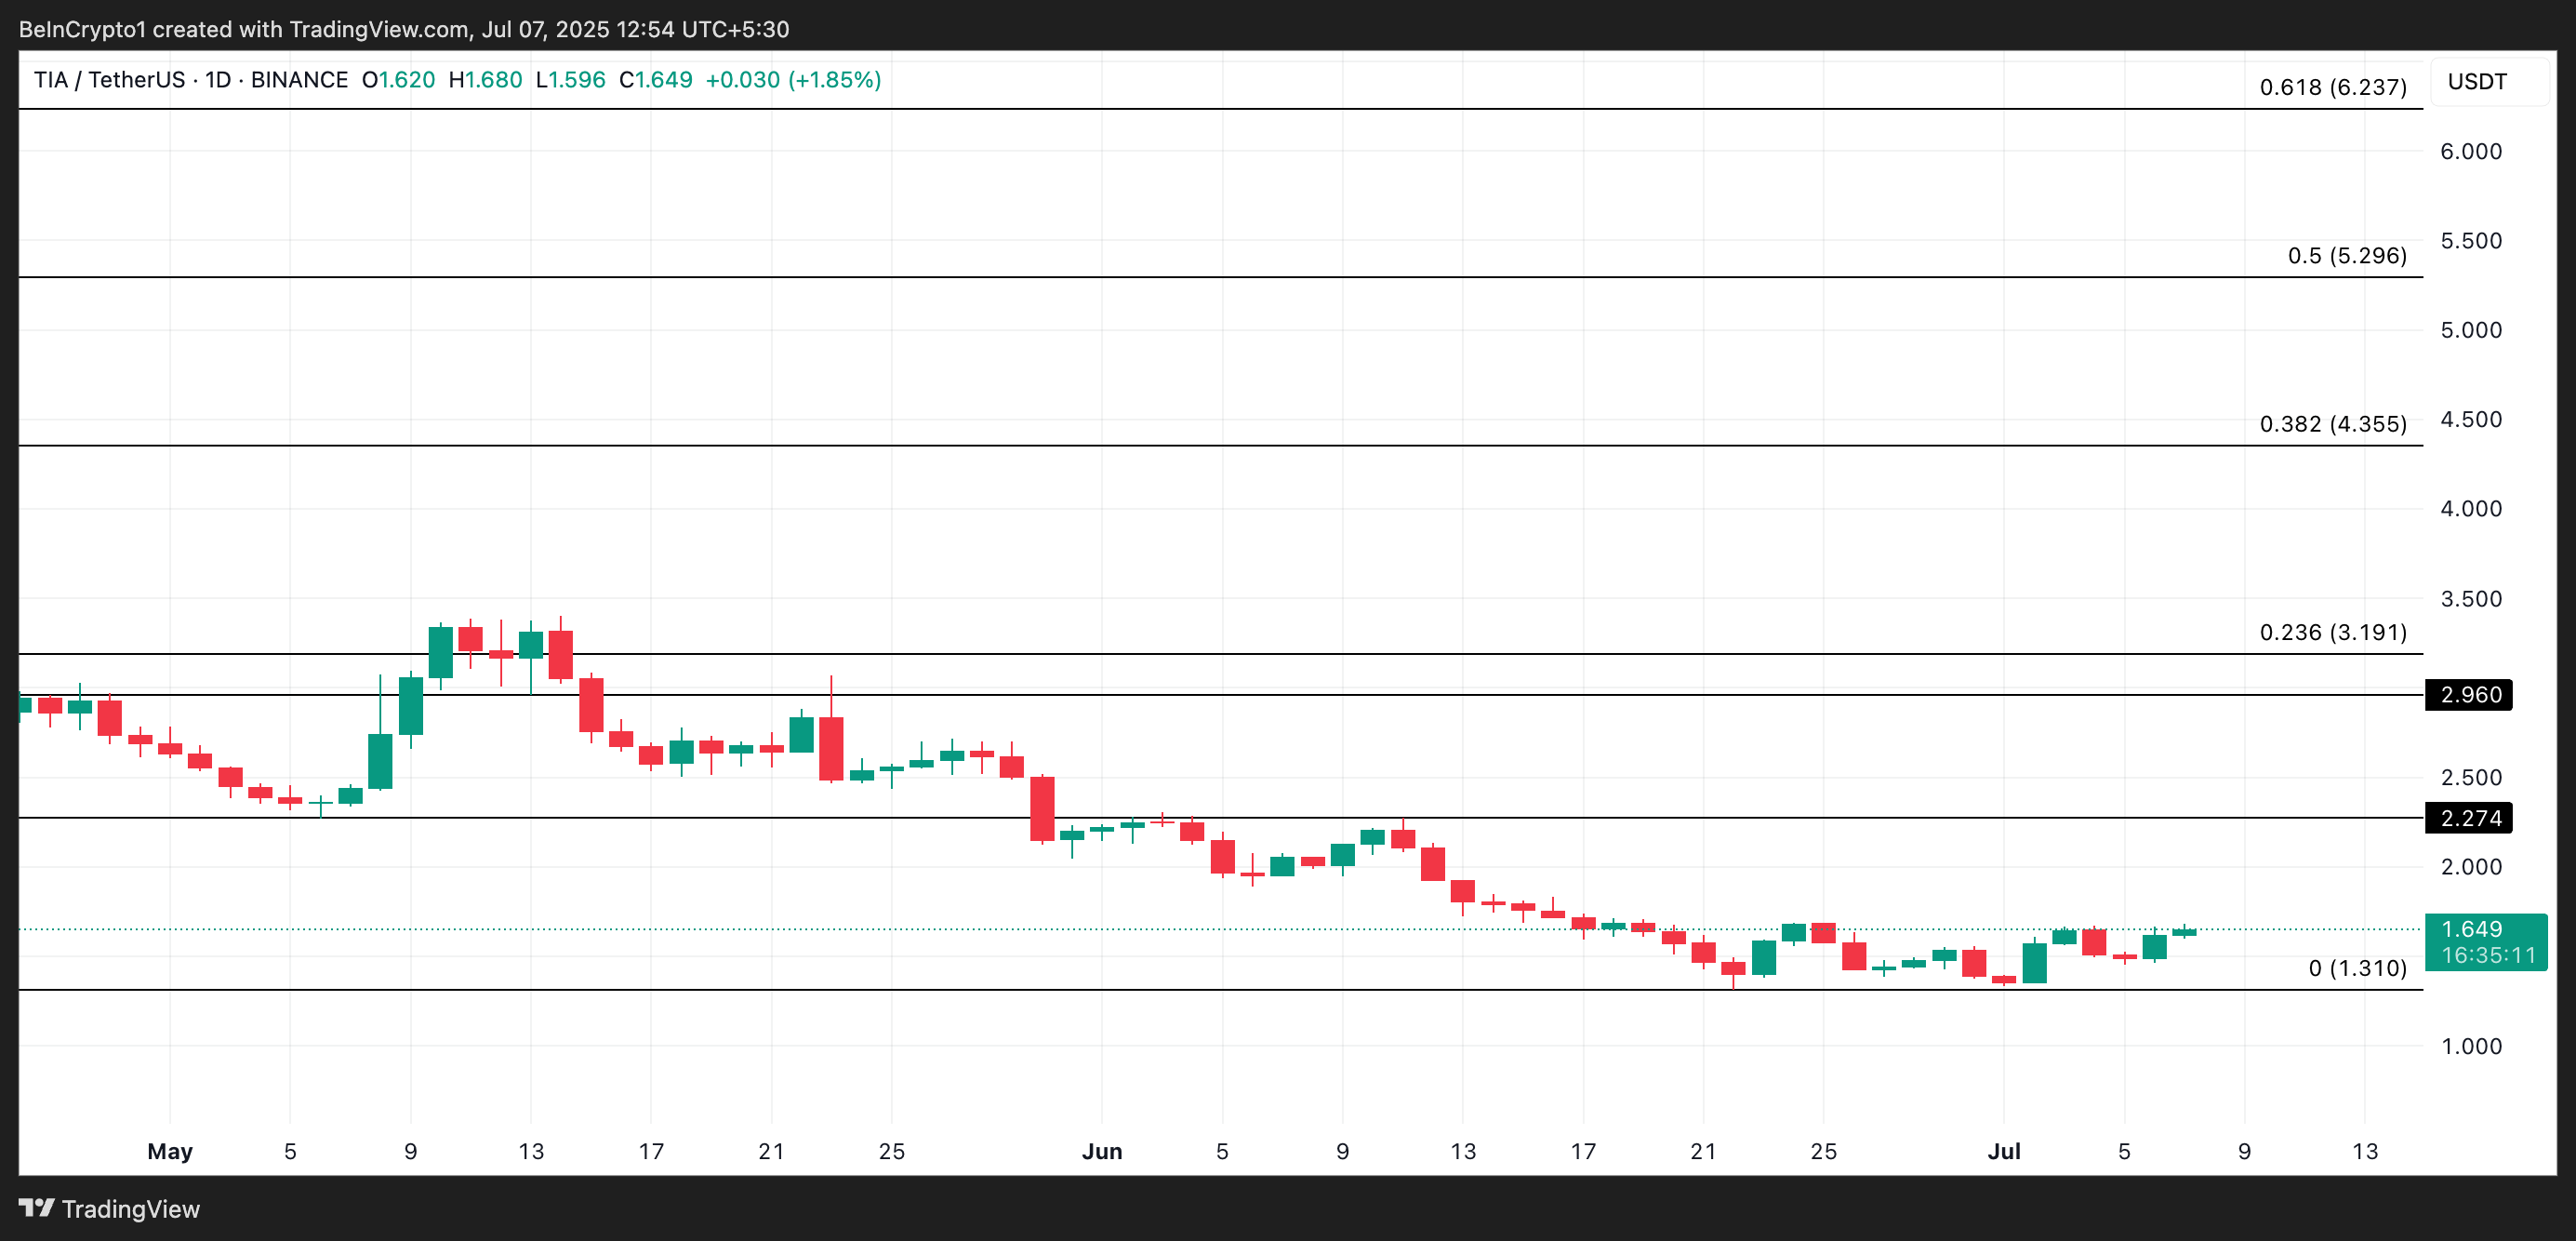
However, a bearish shift in market sentiment could invalidate this bullish outlook. If selling pressure climbs and demand dips, TIA could shed recent gains and plummet to $1.31.


