The Bitcoin price has been decreasing since June 2 and broke down from a long-term support line on June 11. The price has likely begun a corrective period, the shape of which is not yet confirmed.
1. W-X-Y Correction
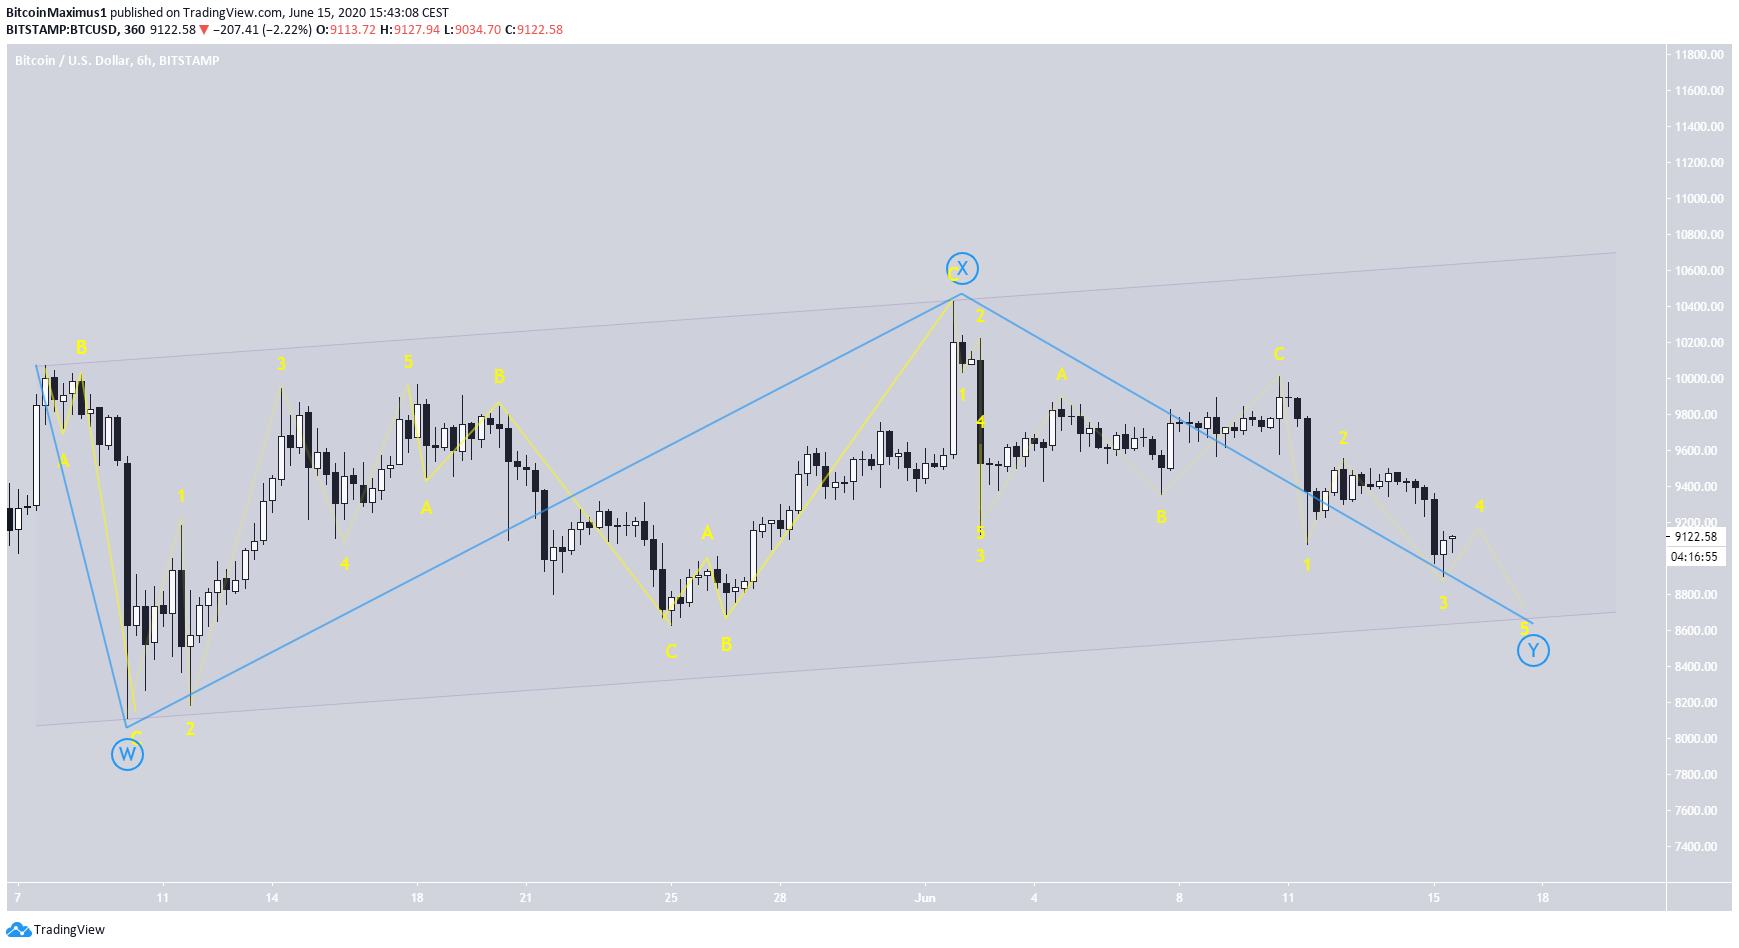
The first possibility we are going to analyze is the W-X-Y correction. This type of corrective move suggests the previous impulsive move ended with a high that was reached on May 7 at $10,074. The price has been correcting ever since.
In a W-X-Y correction, wave X connects two A-B-C corrective patterns, which are labeled as waves W and Y. These waves should be different. The sub-wave count for wave W is 3-3-5 (flat) while that for wave Y is 5-3-5 (zigzag), fitting with the rule.
Also, the X wave seems to have a 3-3-3 wave count, which discounts the possibility of this being an A-B-C correction (more on this in the next section). The X wave went above the original high on May 7, but this is uncommon (although unheard of) and does not break the rules.
As for the bottom of wave Y, the movements in such corrections are often contained within two parallel lines, one which connects the bottom of wave A and top of wave X so that that wave Y would end near $8600.
2. A-B-C Correction
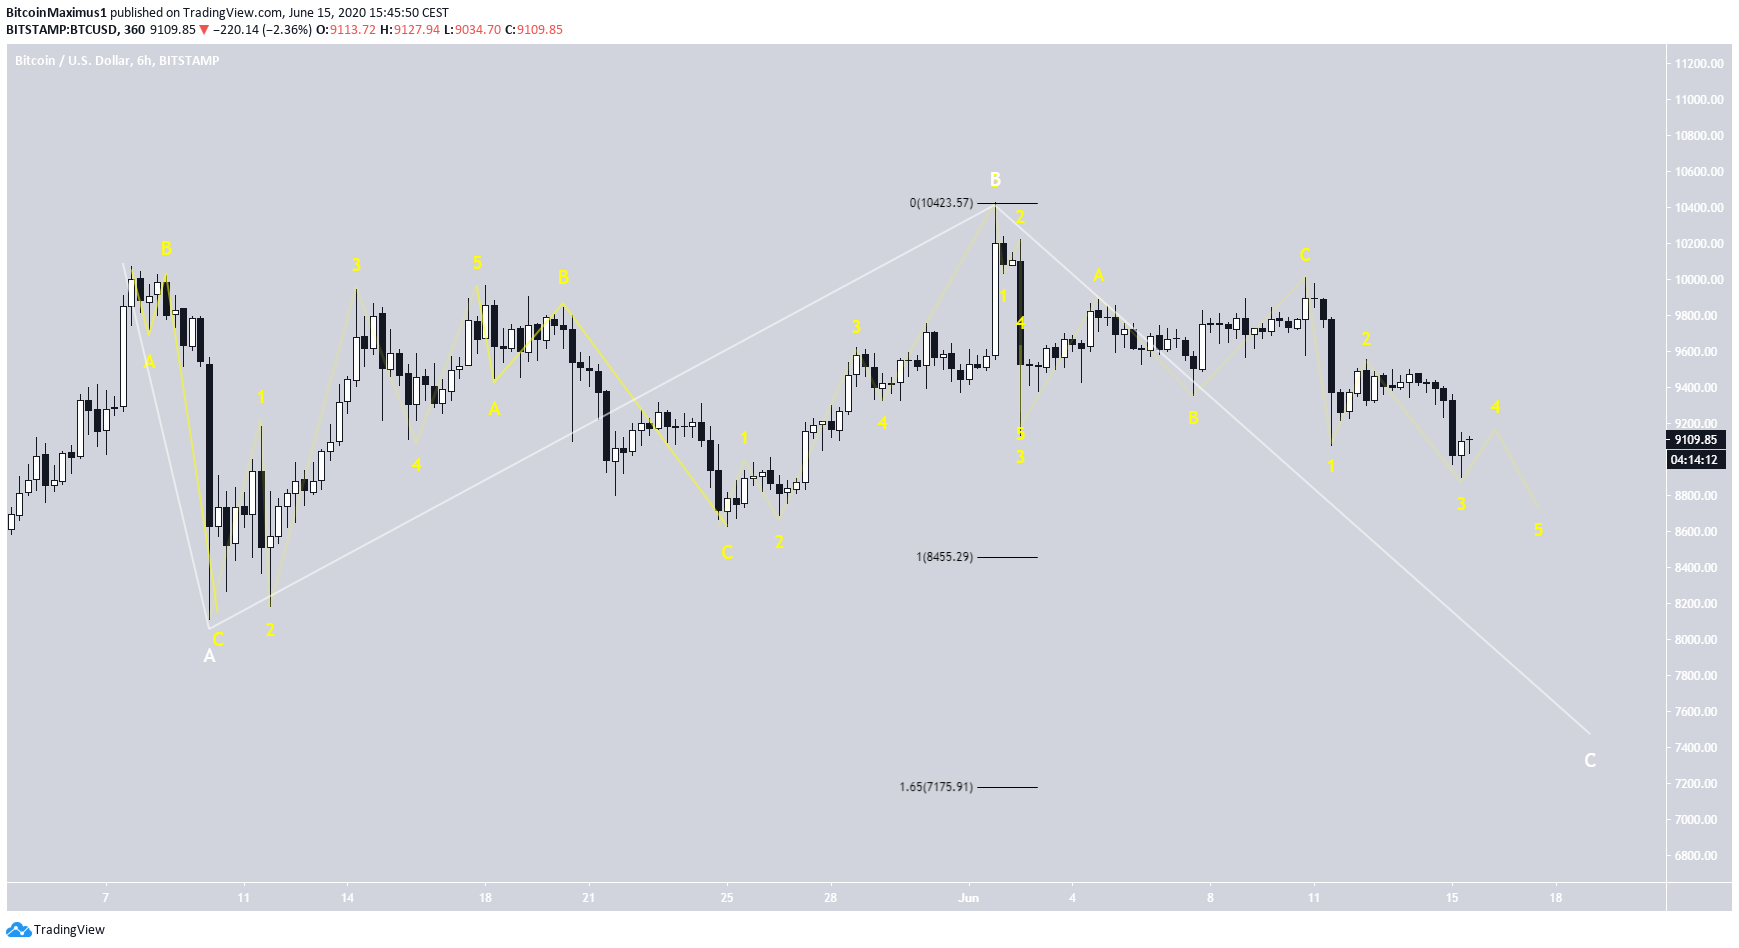
The difference between the A-B-C and the W-X-Y correction is the B wave. In the A-B-C version, the B wave is either a flat or a zigzag. Observe below the outline of a zigzag for wave B.
In this case, the B wave is extended, going beyond the beginning of wave A. This is known as an ”Expanded Flat” correction.
In this case, the C wave would likely be between the 1 – 1.65 Fib level of wave A, giving us a target somewhere between $7,200 – $8,450 for the end of the Y wave.
Well-known trader @mesawine1 also believes that the bullish bias for BTC is gone, and the price is heading lower. He notes:
However #bitcoin has lost it’s bullish edge with this move.
3. Wave A
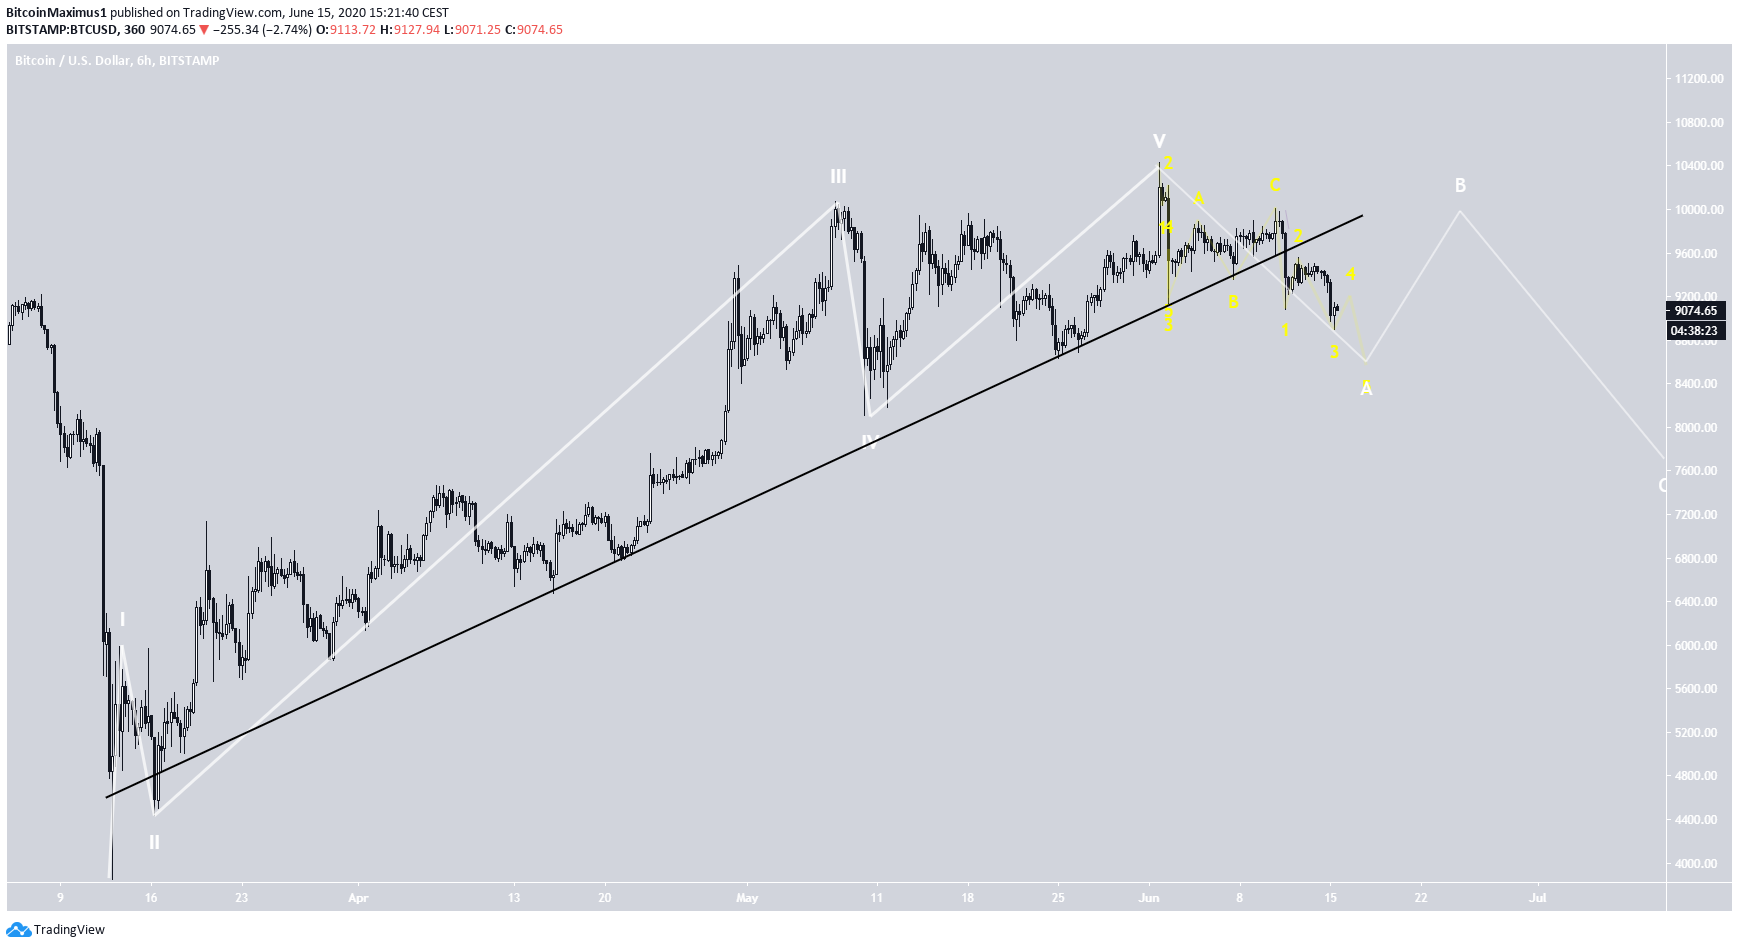
The final wave count we are going to analyze suggests that the five-wave impulse move preceding this correction ended on July 2 instead of May 7. In this case, we are still in the A wave, which is shaping up to be a zigzag (5-3-5).
However, the price has not yet even completed the A wave, so we cannot hypothesize on the shape of the longer-term correction. After this wave is finished, the larger B wave could go anywhere between the 0.38 – 0.79 Fib levels of this entire downward move.
The target range would be between $9,400 and $10,000, but this is dependent on where Wave A ends. Due to its impeccable fit with the Wyckoff distribution and the late breakdown from the rising support line, this seems to be the more likely possibility.
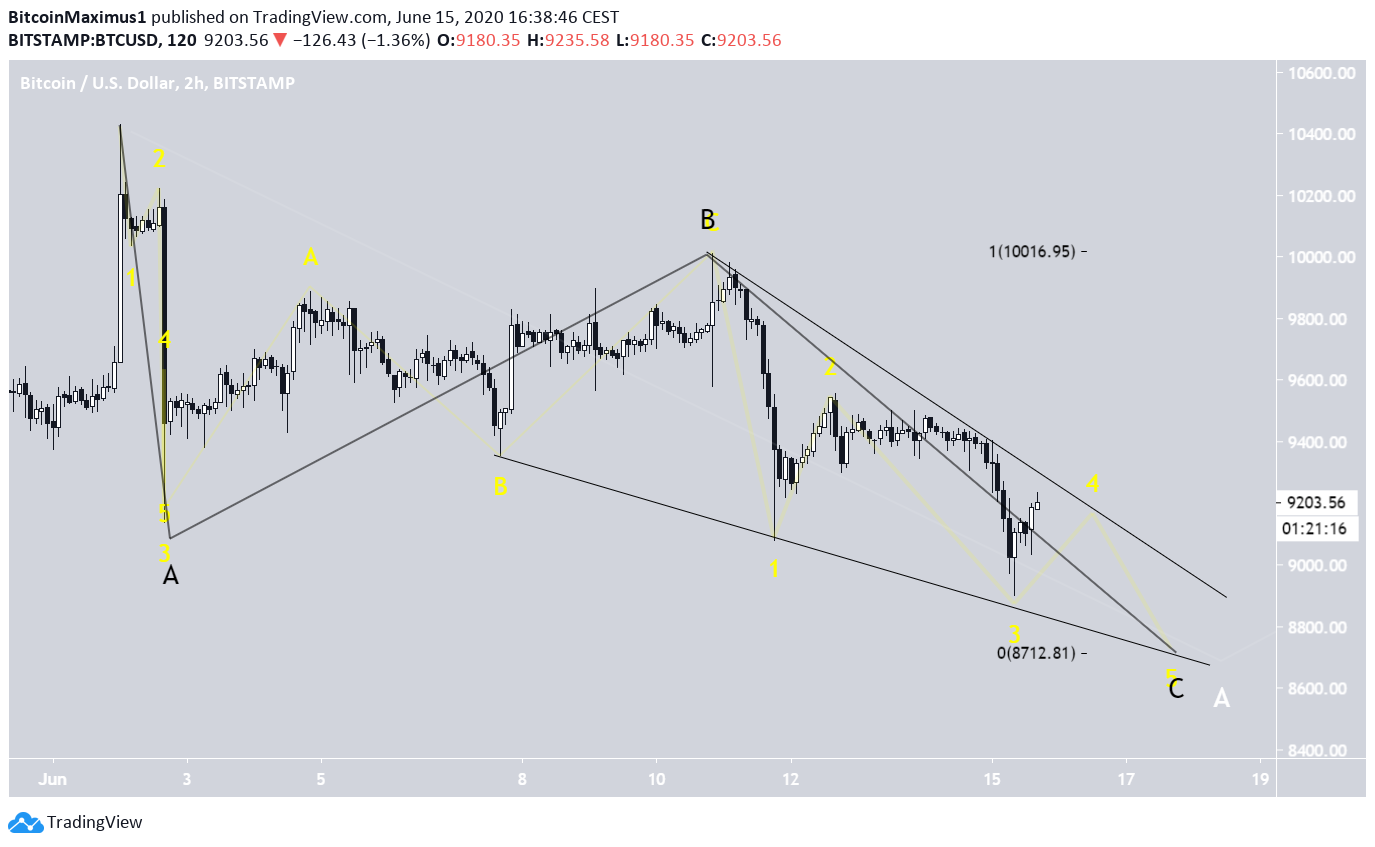
The short-term chart also fits with this possibility. The price is completing the final portion of the A wave, which is a zigzag correction. In such cases, the A and C waves often have the same length, which gives a target of $8,700 for the end of the C wave.
In addition, this target fits with the descending support line of the wedge. Furthermore, it looks as if the C wave is an ”ending diagonal”, which fits with the shape of this wedge.