The prices of ONT, XLM, and ATOM have reclaimed long-term support levels. While ONT still faces significant overhead resistance, the road upwards for XLM and ATOM is relatively clear.
The ADA price has increased considerably since the March 13 bottom with an impressive gain of 373%. While numerous other altcoins have posted similar gains, most majors are lagging behind.
Cryptocurrency trader @CryptoMichNL believes that other majors will follow ADA, mentioning three of them in particular:
It doesn’t seem unreasonable to see majors follow $ADA. Cardano rallied towards May highs around $0.10.
I wouldn’t be surprised if $ONT hits $1.25-1.85 either, or $XLM hits $0.14, or $ATOM hits $5. Expecting more majors to start pulling over and run from here.
In this article, we’ll take a closer look at the prices of ONT, XLM, and ATOM and determine their potential for future gains.
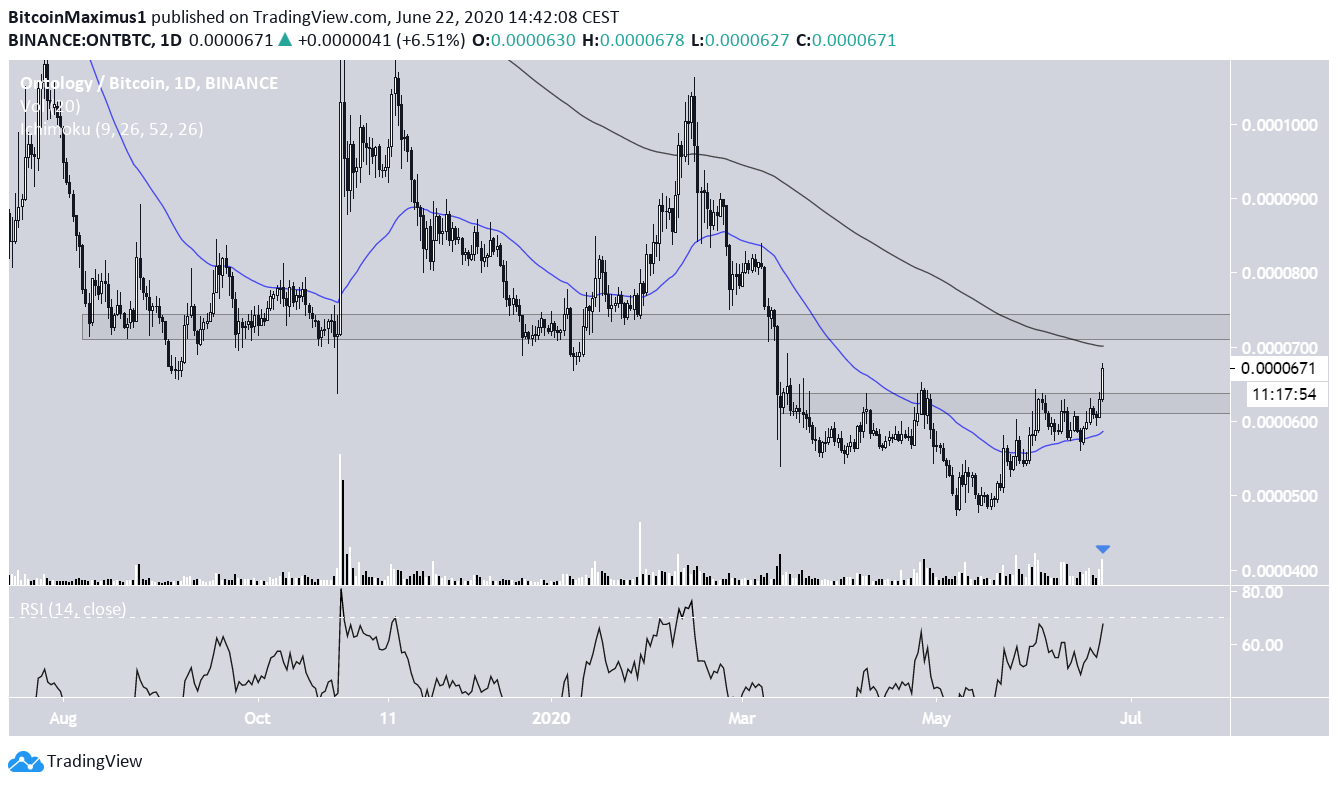
Ontology (ONT)
The ONT price has been increasing since May 7, when it reached a low of 473 satoshis. Recently, the price moved above the 50-day moving average (MA) and is currently in the process of moving above the 625 satoshi resistance area. It’s also doing so on considerable volume.
While all these are bullish signs, the price is still facing very strong resistance from the 200-day MA and the 735 satoshi resistance area. The latter is particularly important, since it acted as support since August 2019, before finally breaking down in March 2020.
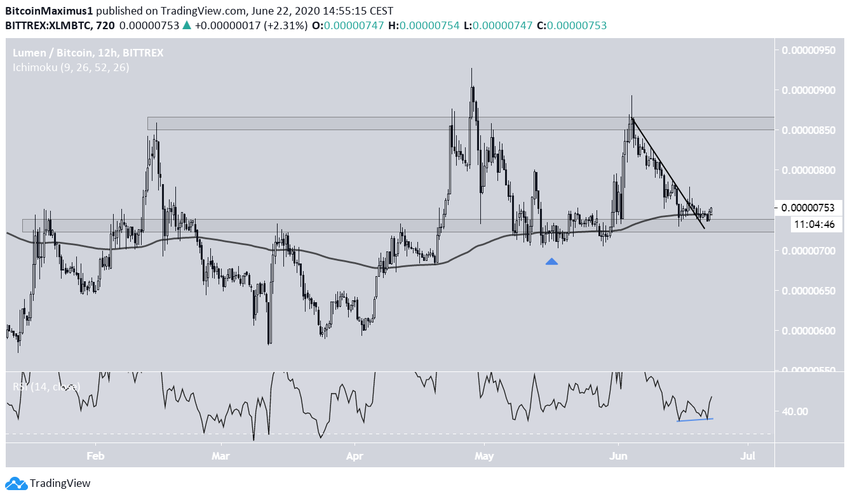
Stellar (XLM)
The XLM price has been declining alongside a descending resistance line since June 4. However, the price broke out on June 18 and has possibly made a double bottom. The resulting cup and handle pattern is considered a bullish reversal move.
Furthermore, the price is sitting at a confluence of support levels: the 725 satoshi support area and the 100-day MA, which has been a relatively good predictor of the trend since January.
The May decrease below this area and subsequent pump and reclaim of support makes it likely that the price will hold above here and soon begin moving upwards.
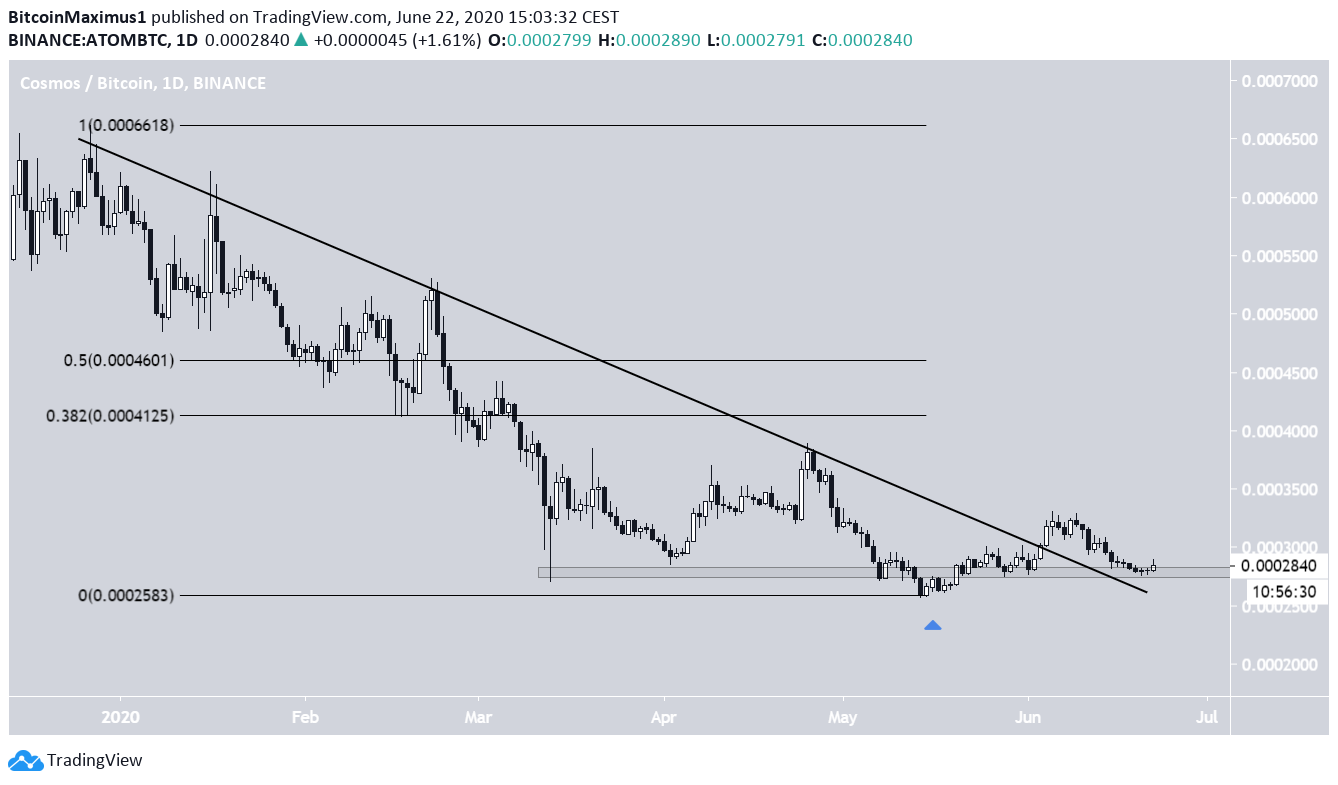
Atom (ATOM)
The ATOM price has been declining since December 27, 2019, alongside a descending resistance line. However, the price broke out at the beginning of June and reclaimed the 28,000 satoshi support area.
If the support area holds, ATOM is likely to begin a long-term bullish trend. In that scenario, the closest resistance levels would be found between 41,2500 and 46,000 satoshis, the 0.382, and 0.5 Fib levels of the entire decline.