

The LTC, OCEAN and ADA prices have already broken out above long-term resistance lines. It is likely that the increase will continue throughout February.
A considerable number of altcoins have posted significant increases in the month of January. In lieu of this, we are going to take a look at three coins that have already broken out and have the potential for massive gains in the month of February. These are:
- Litecoin (LTC)
- Cardano (ADA)
- Ocean Protocol (OCEAN)
OCEAN
The OCEAN price has been gradually increasing along an ascending support line for the past 176 days. On January 16, the price broke out above a descending resistance line. The price has broken out above similar descending resistance lines twice prior, initiating upward moves with a magnitude of 144% and 86%, respectively. If the current move were to have a magnitude of 110% (average of the two prior increases), the price would reach a high of 890 satoshis.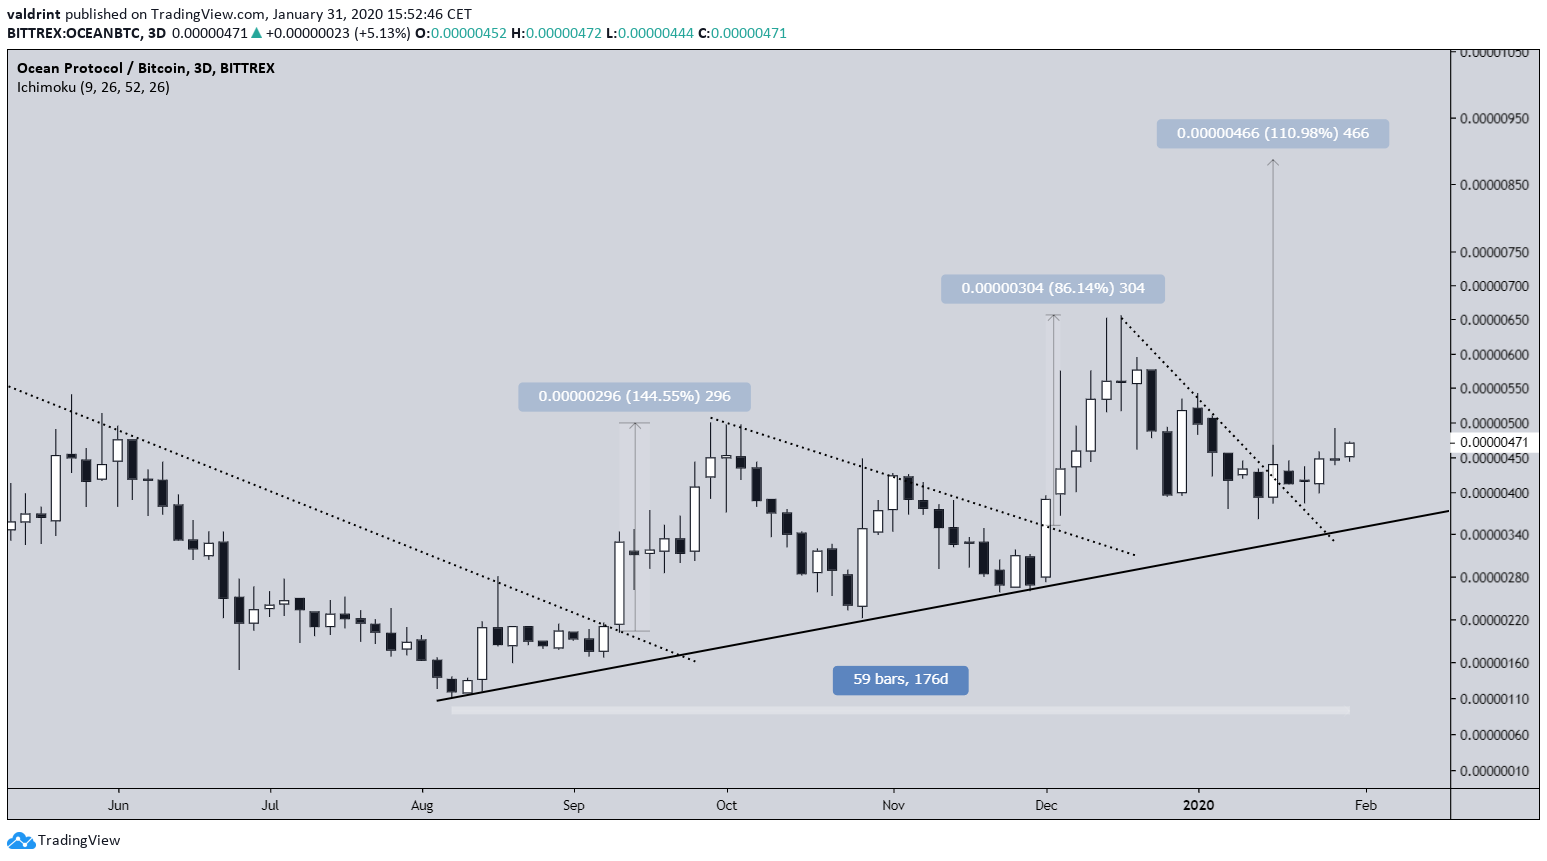 The 3-day RSI supports the aforementioned price increase. During the time the price broke out from the resistance line and validated it as support, the RSI bounced at the 50-line and is currently moving upwards, confirming that the price is in a bullish trend.
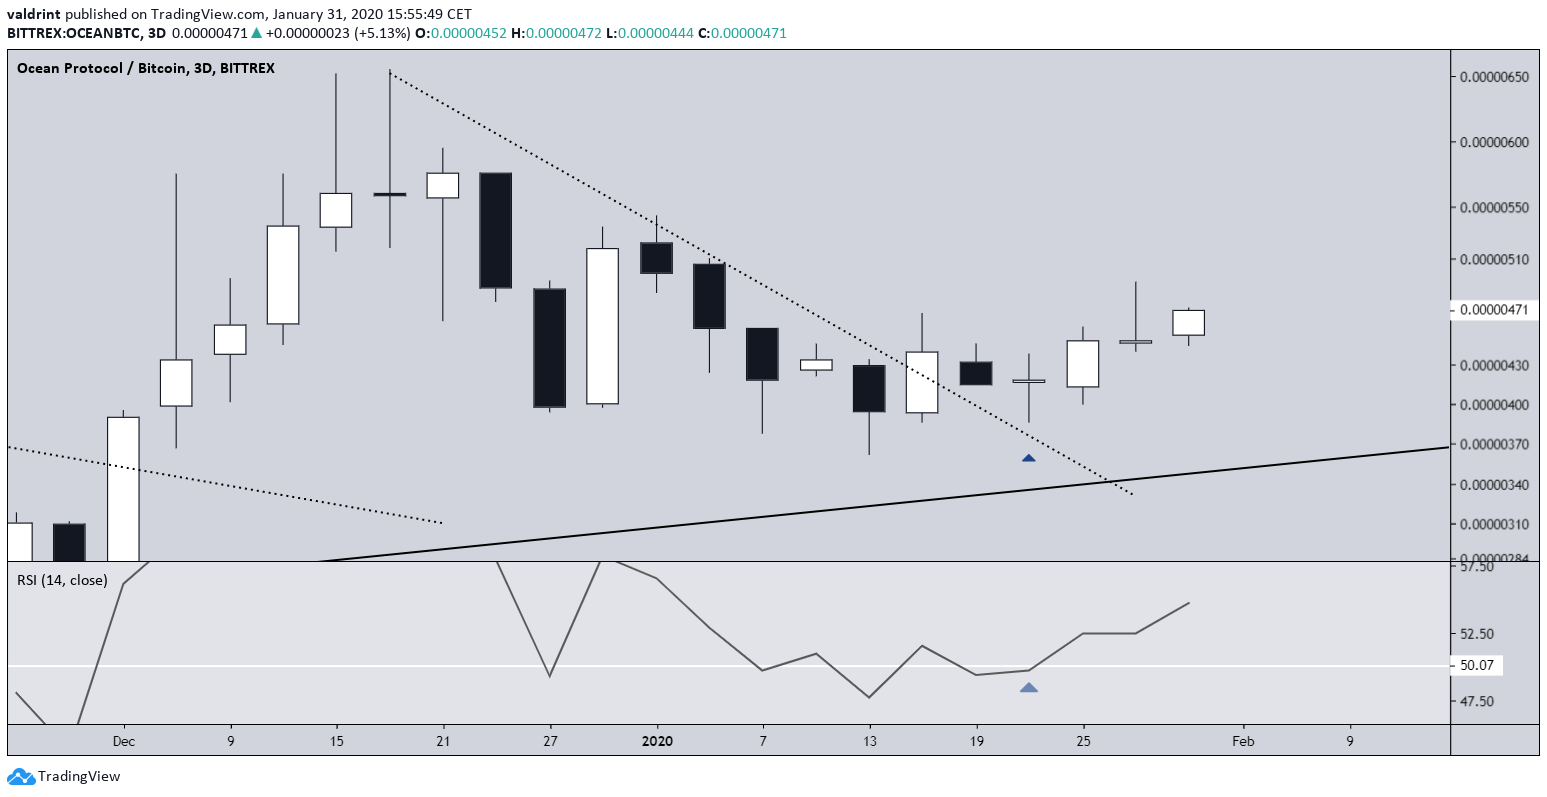 Compared to the two previous upward moves, the current one has been much more gradual, having already been transpiring for 18 days, the entire length of the second upward move.
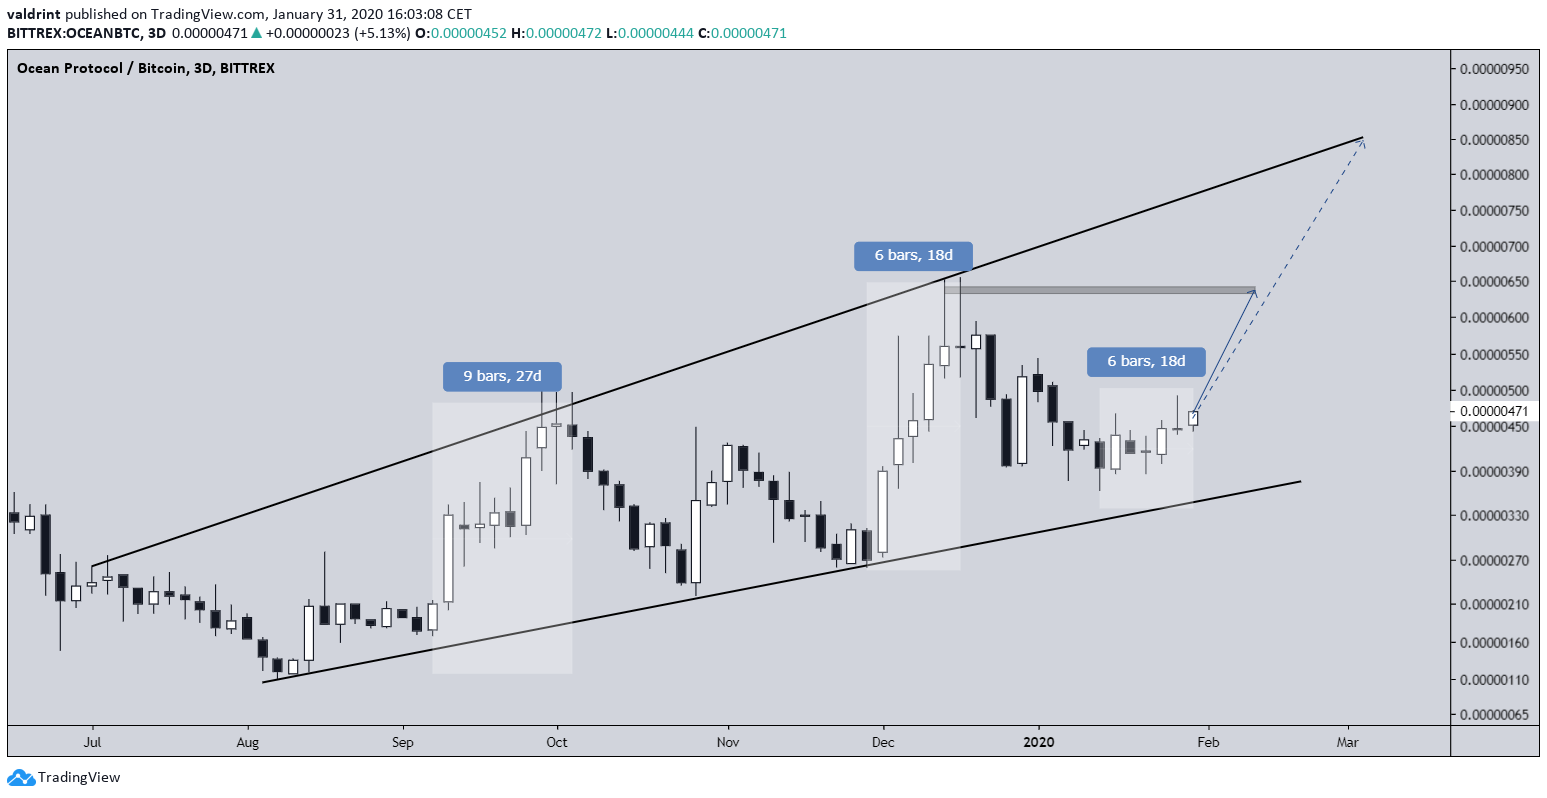
Therefore, it is entirely possible that the rate of increase picks up, and the price reached the local high of 640 satoshis within the next week.
For the end of February, our optimistic target is given at 840, validating the possible ascending resistance line in place since July 3, 2019.
Compared to the two previous upward moves, the current one has been much more gradual, having already been transpiring for 18 days, the entire length of the second upward move.
Therefore, it is entirely possible that the rate of increase picks up, and the price reached the local high of 640 satoshis within the next week.
For the end of February, our optimistic target is given at 840, validating the possible ascending resistance line in place since July 3, 2019.
OCEAN Conclusions
- OCEAN has broken out above a resistance line.
- The RSI supports upward movement.
- Intermediate target of 640.
- It could reach 840 by the end of February.
Litecoin
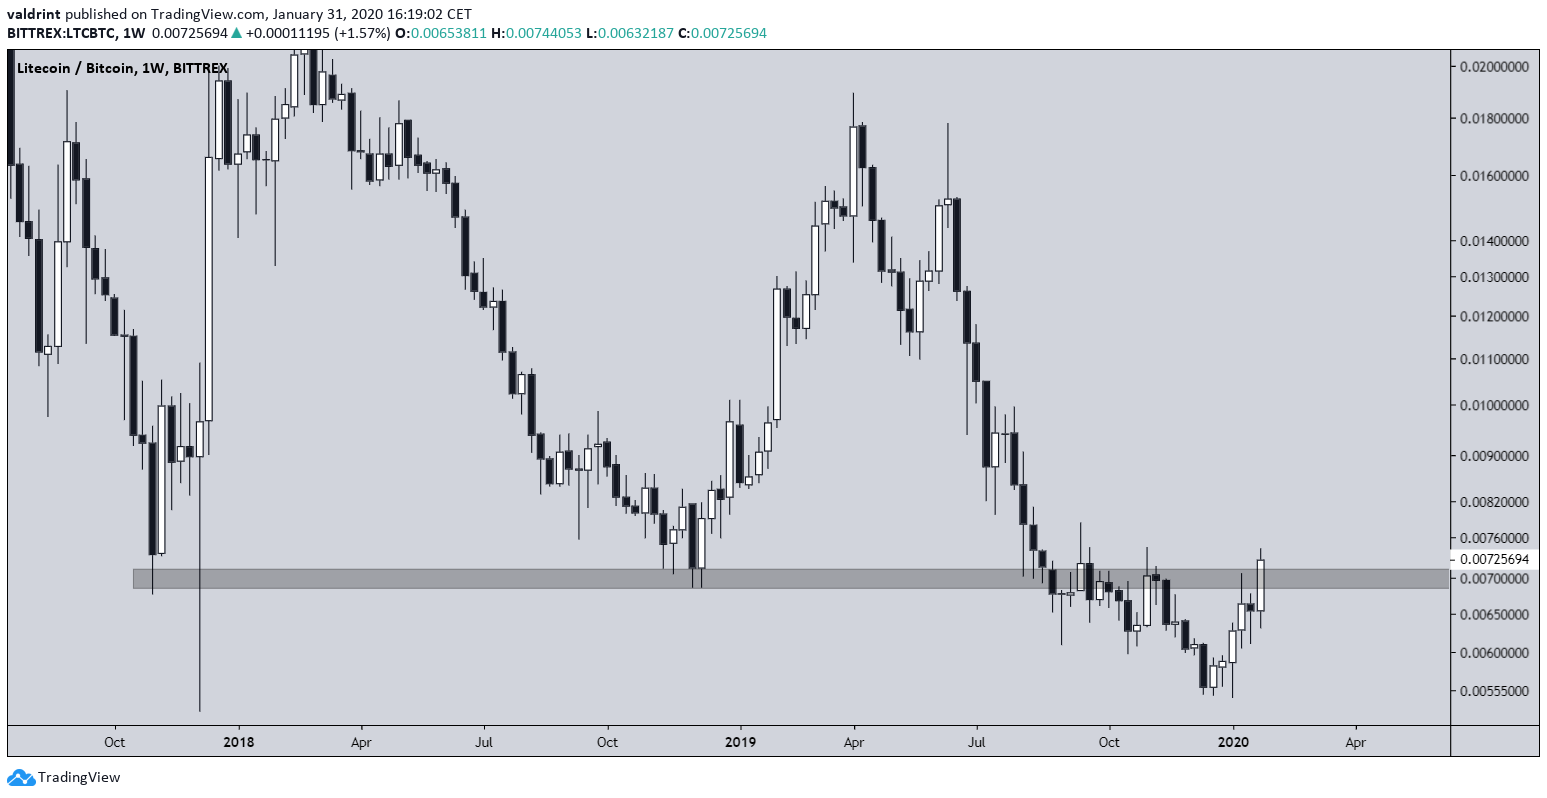
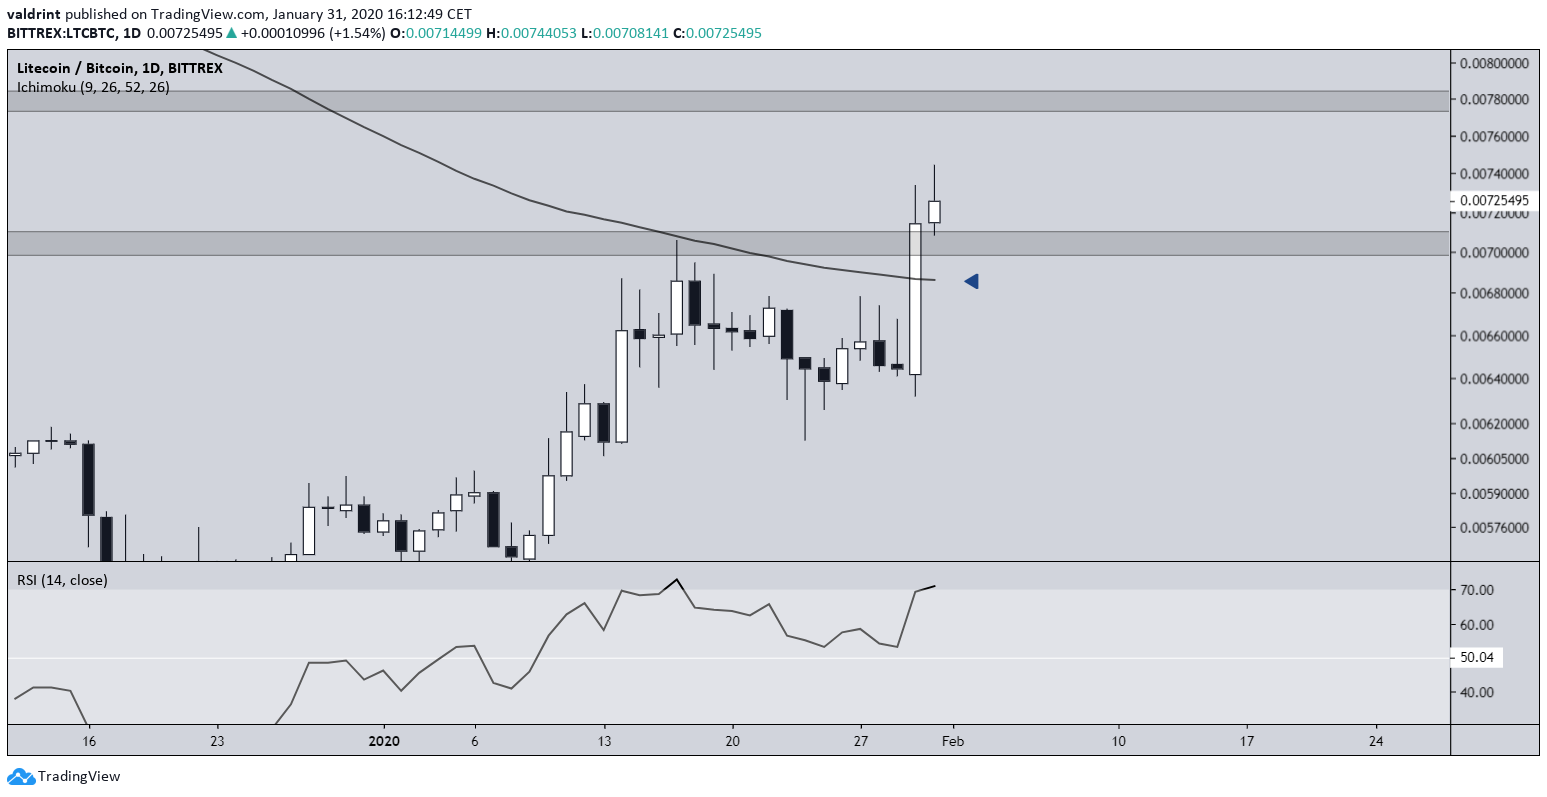
The Litecoin price broke out from a long-term descending resistance line on January 14. Afterward, it created a symmetrical triangle, which acted as a continuation pattern and caused another breakout. At the time of writing, the LTC price had created a bullish engulfing candlestick and was in the process of moving above the ₿0.0071 resistance area, heading for the top of the resistance line at ₿0.0078.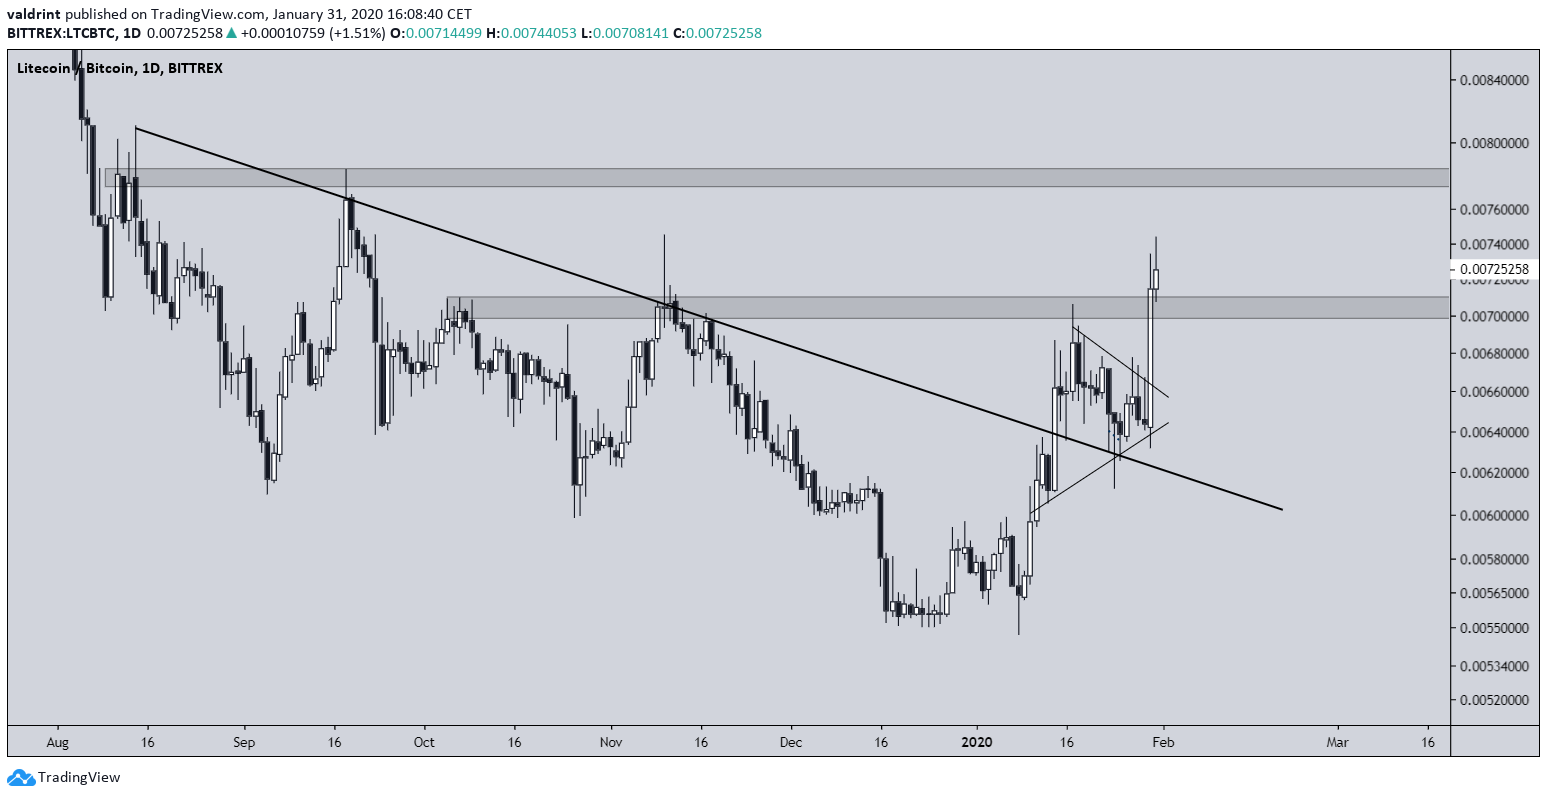 The significance of the ₿0.0071 area cannot be overstated since it was the catalyst for two upward moves in 2017 & 2018. If the price were to reclaim it, we could say with confidence that it is in an upward trend and could initiate similar upward moves.
 Besides the resistance area, the Litecoin price has just moved above its 200-day moving average (MA). While the RSI has generated some bearish divergence, it is relatively insignificant in amount. On the other hand, it bounced strongly at the 50 line, suggesting that LTC is in an upward trend.
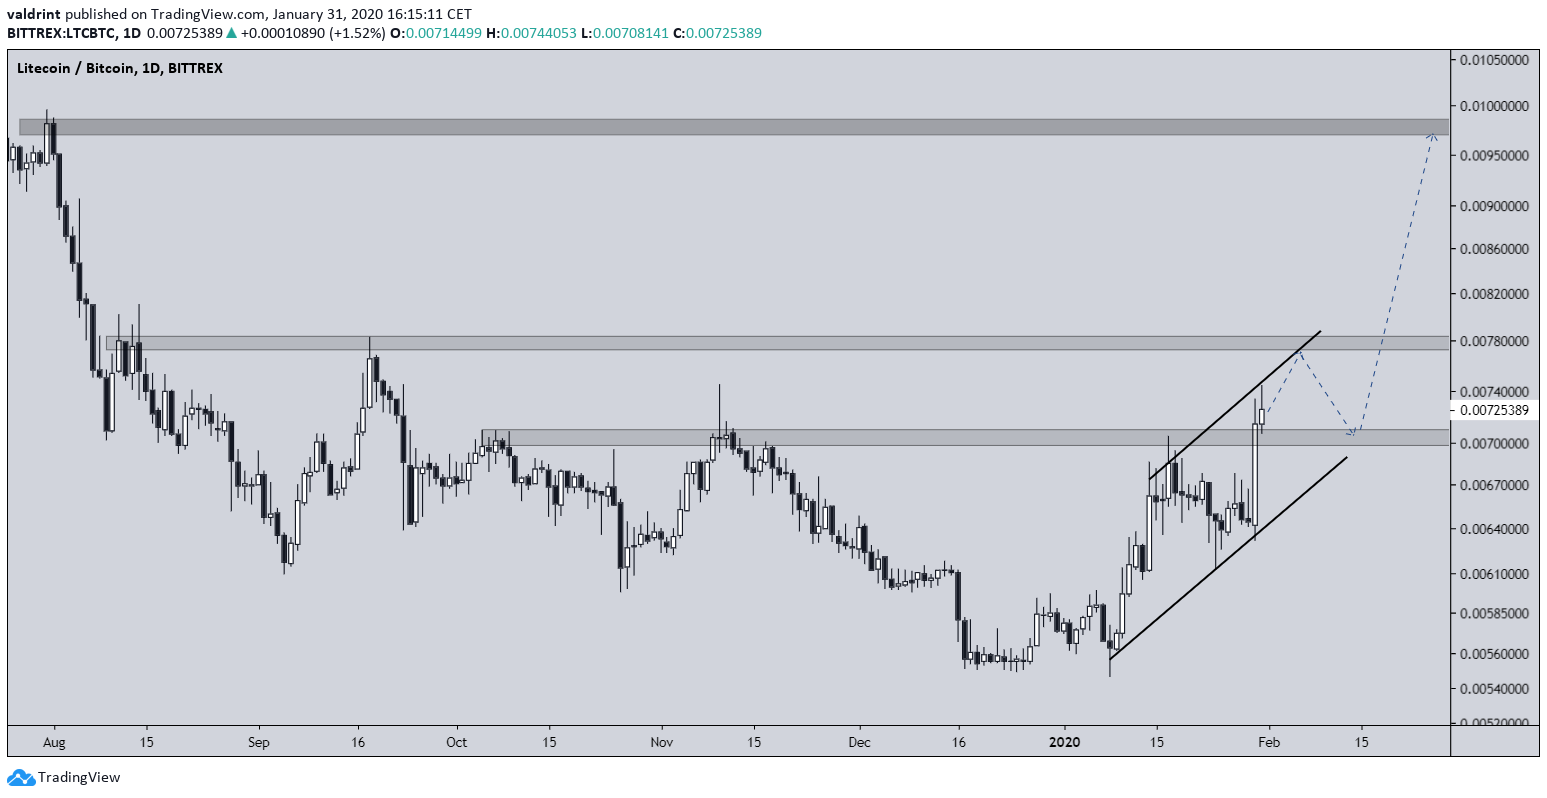
 As for the future movement, we can outline them by using the possibly ascending channel the price is trading in. If it were to return to validate the ₿0.0071 area once more, providing an ample opportunity to enter the trade for a profit of nearly 40% if the price gets to the next target of ₿0.01.
Litecoin Conclusions
- Litecoin has broken out above a long-term resistance line.
- The price has moved above its 200-day moving average
- Short-term target of ₿0.0078.
- Long-term target of ₿0.01.
Cardano
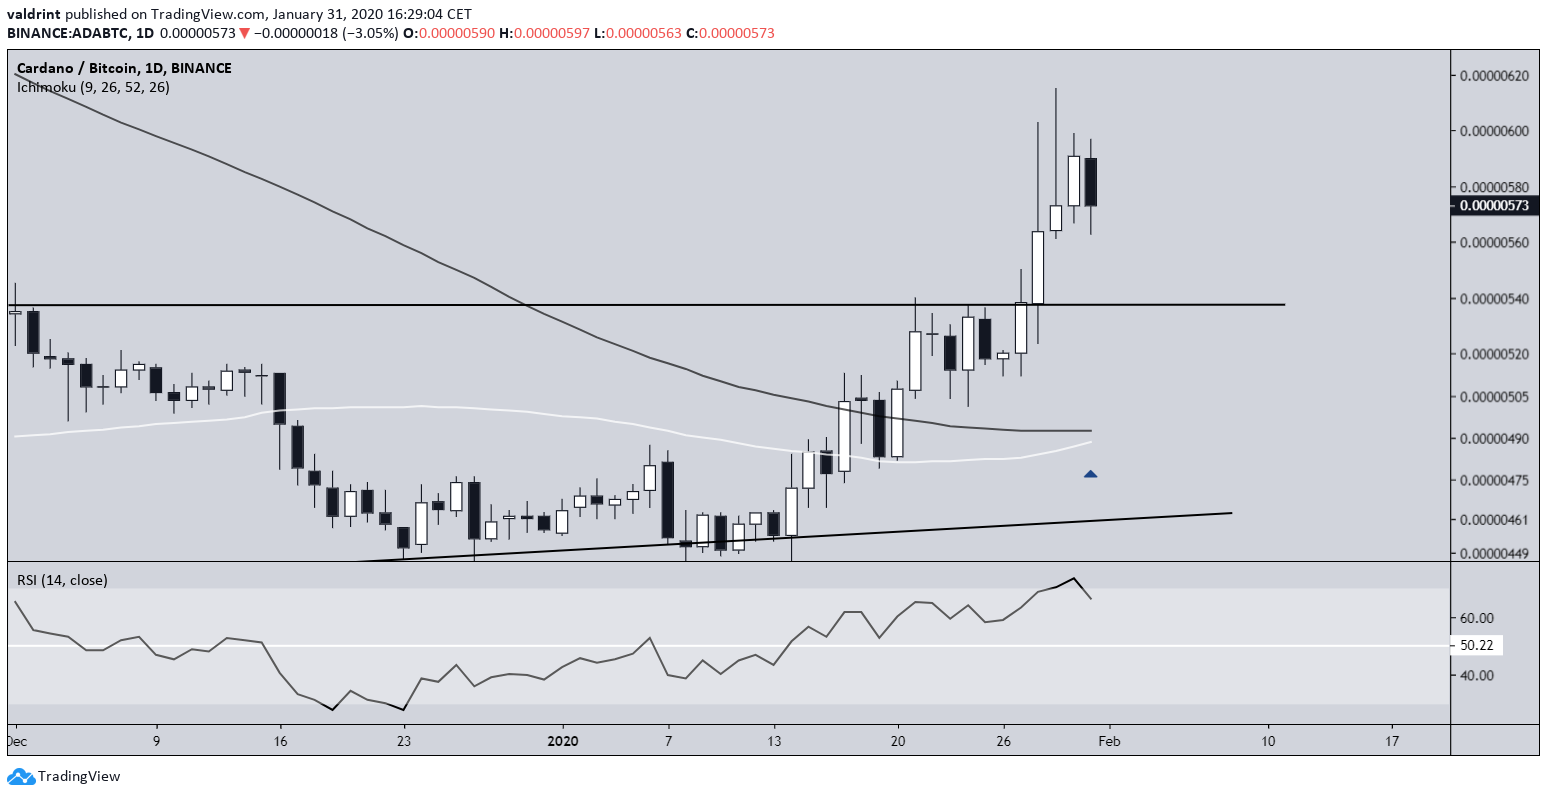
The ADA price has been trading inside an ascending triangle since August 2019, validating both the resistance and support lines several times. On January 28, the price broke out from the triangle with very significant volume. It reached a high of 618 satoshis before decreasing slightly. It seems possible that the price will return to validate the resistance line before continuing its upward movement.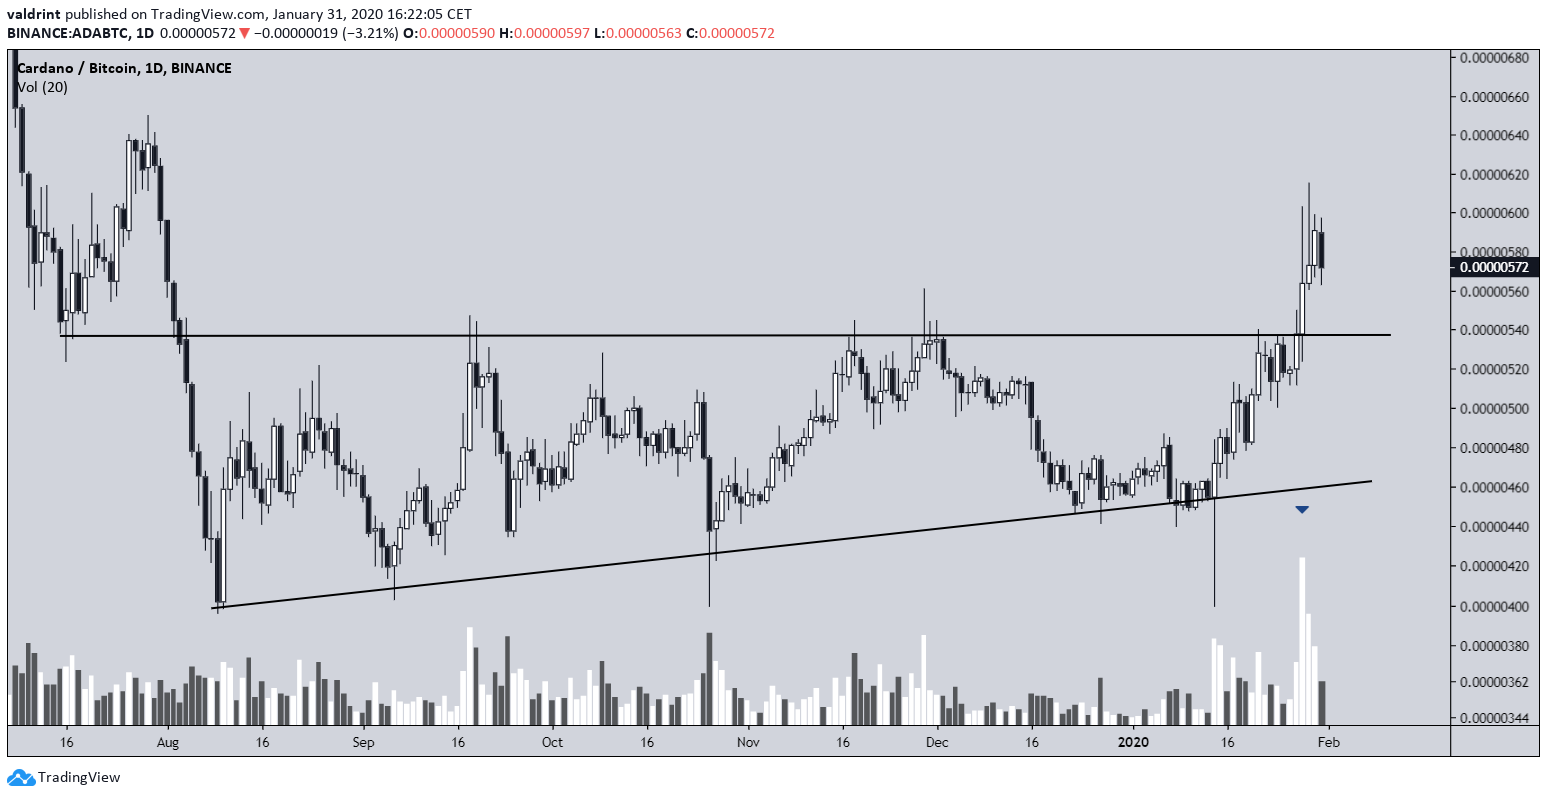 The moving averages support a price increase since there is a golden cross (50 & 200-day MA) that has almost transpired. Furthermore, while the RSI is oversold, it has not generated any bearish divergence and has been above the 50 line for the past month, indicating that the price is in an upward trend.
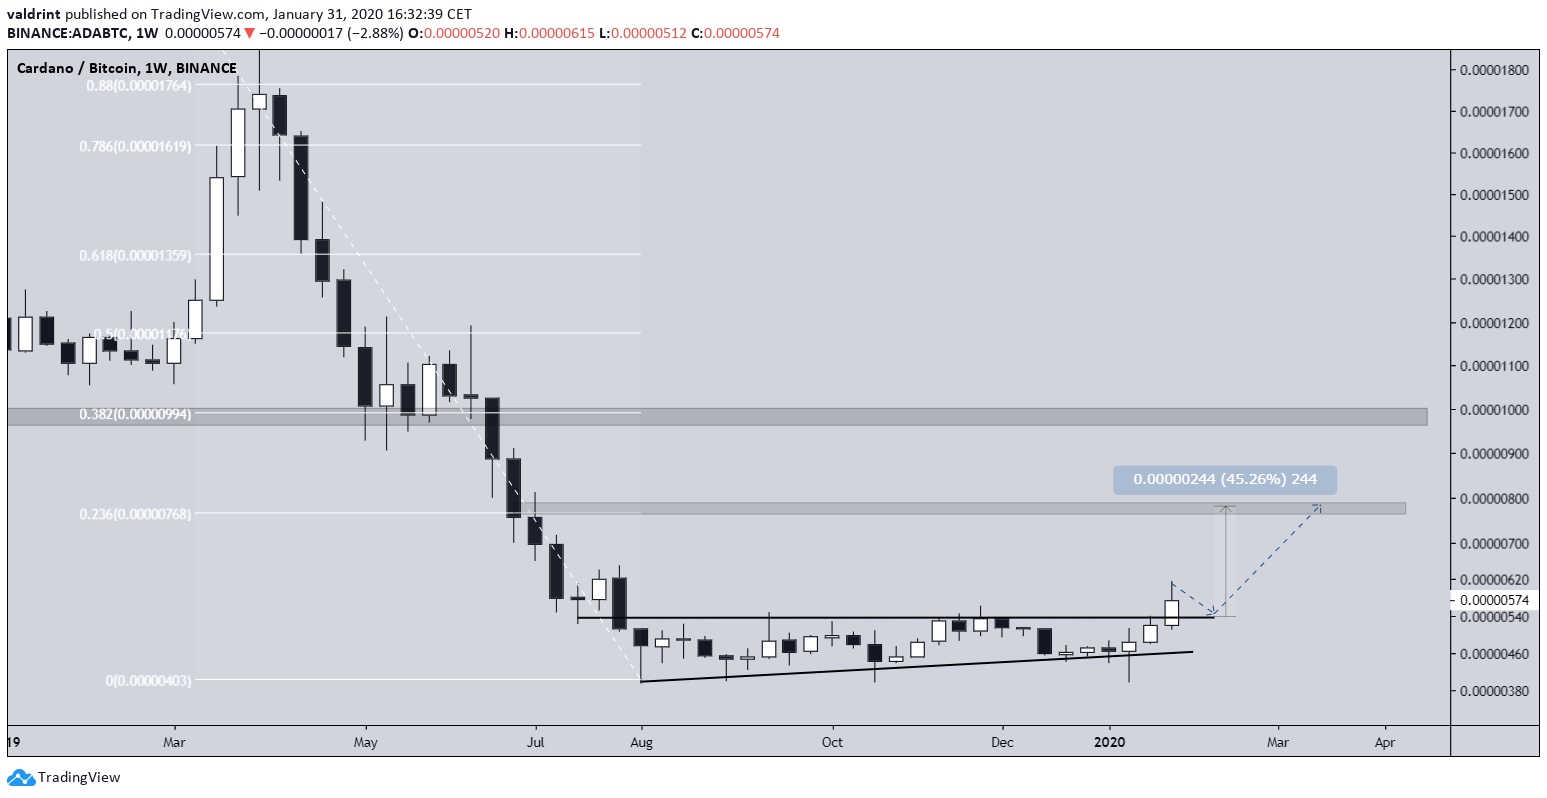
 Looking at the weekly chart, the closest resistance areas are found at 780 and 1000 satoshis, the 0.236 and 0.382 fib level of the previous decrease from April 2019.
The potential decrease to validate the resistance line would provide the optimal level to entry in anticipation of the upward move, being a 45% price increase if the price reaches the first target.
Looking at the weekly chart, the closest resistance areas are found at 780 and 1000 satoshis, the 0.236 and 0.382 fib level of the previous decrease from April 2019.
The potential decrease to validate the resistance line would provide the optimal level to entry in anticipation of the upward move, being a 45% price increase if the price reaches the first target.
Cardano Conclusions
- ADA broke out from a long-term bullish reversal pattern.
- There is a golden cross about to transpire.
- Short-term target of 780 satoshis.
- Long-term target of 1000 satoshis.
Disclaimer
In line with the Trust Project guidelines, this price analysis article is for informational purposes only and should not be considered financial or investment advice. BeInCrypto is committed to accurate, unbiased reporting, but market conditions are subject to change without notice. Always conduct your own research and consult with a professional before making any financial decisions. Please note that our Terms and Conditions, Privacy Policy, and Disclaimers have been updated.

Valdrin Tahiri
Valdrin discovered cryptocurrencies while he was getting his MSc in Financial Markets from the Barcelona School of Economics. Shortly after graduating, he began writing for several different cryptocurrency related websites as a freelancer before eventually taking on the role of BeInCrypto's Senior Analyst.
(I do not have a discord and will not contact you first there. Beware of scammers)
READ FULL BIO
Sponsored
Sponsored