
The Aragon (ANT) price has broken out from a resistance area that had previously been in place since Sept. 2020.
ANT is likely mired in a bullish trend and will continue rallying to at least $8.
Breakout From Resistance
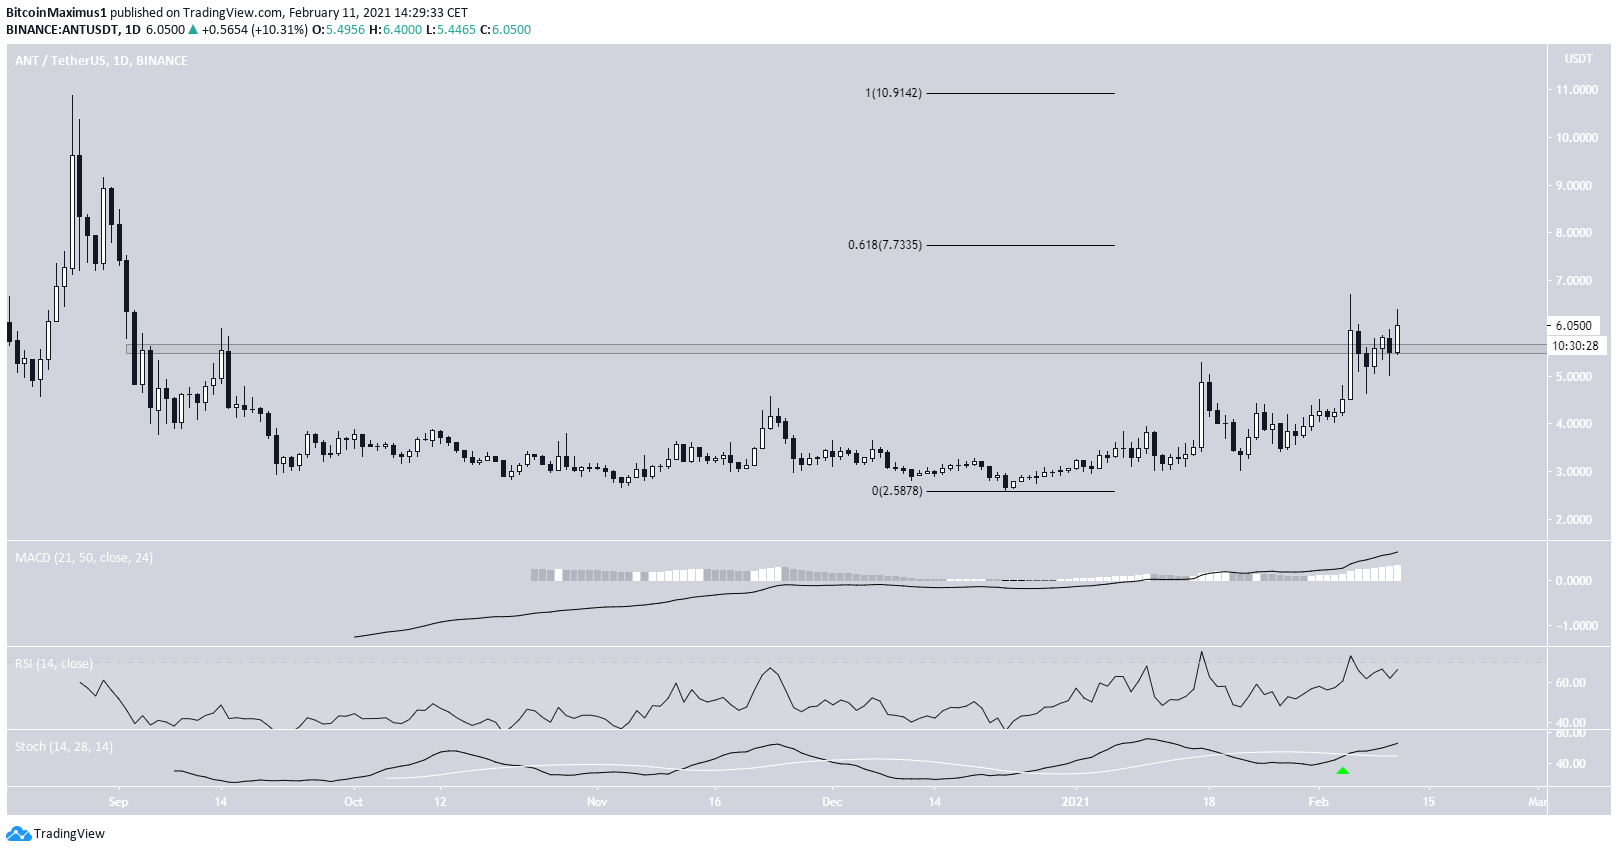
ANT has been moving upwards since reaching a low of $2.60 on Dec. 23, 2020. At the time of writing, it was trading just above $6.05. The rally has taken it above the $5.60 resistance area, which had previously been in place since September. After validating the region as support, it began the current upward move.
Technical indicators are bullish, supporting the continuation of the upward movement. This is especially visible by the bullish cross in the Stochastic Oscillator and a MACD reading above the 0 line. If ANT continues rising, the closest resistance area would be at $7.73, the 0.618 Fib retracement level of the previous downward move.
ANT Short-Term Movement
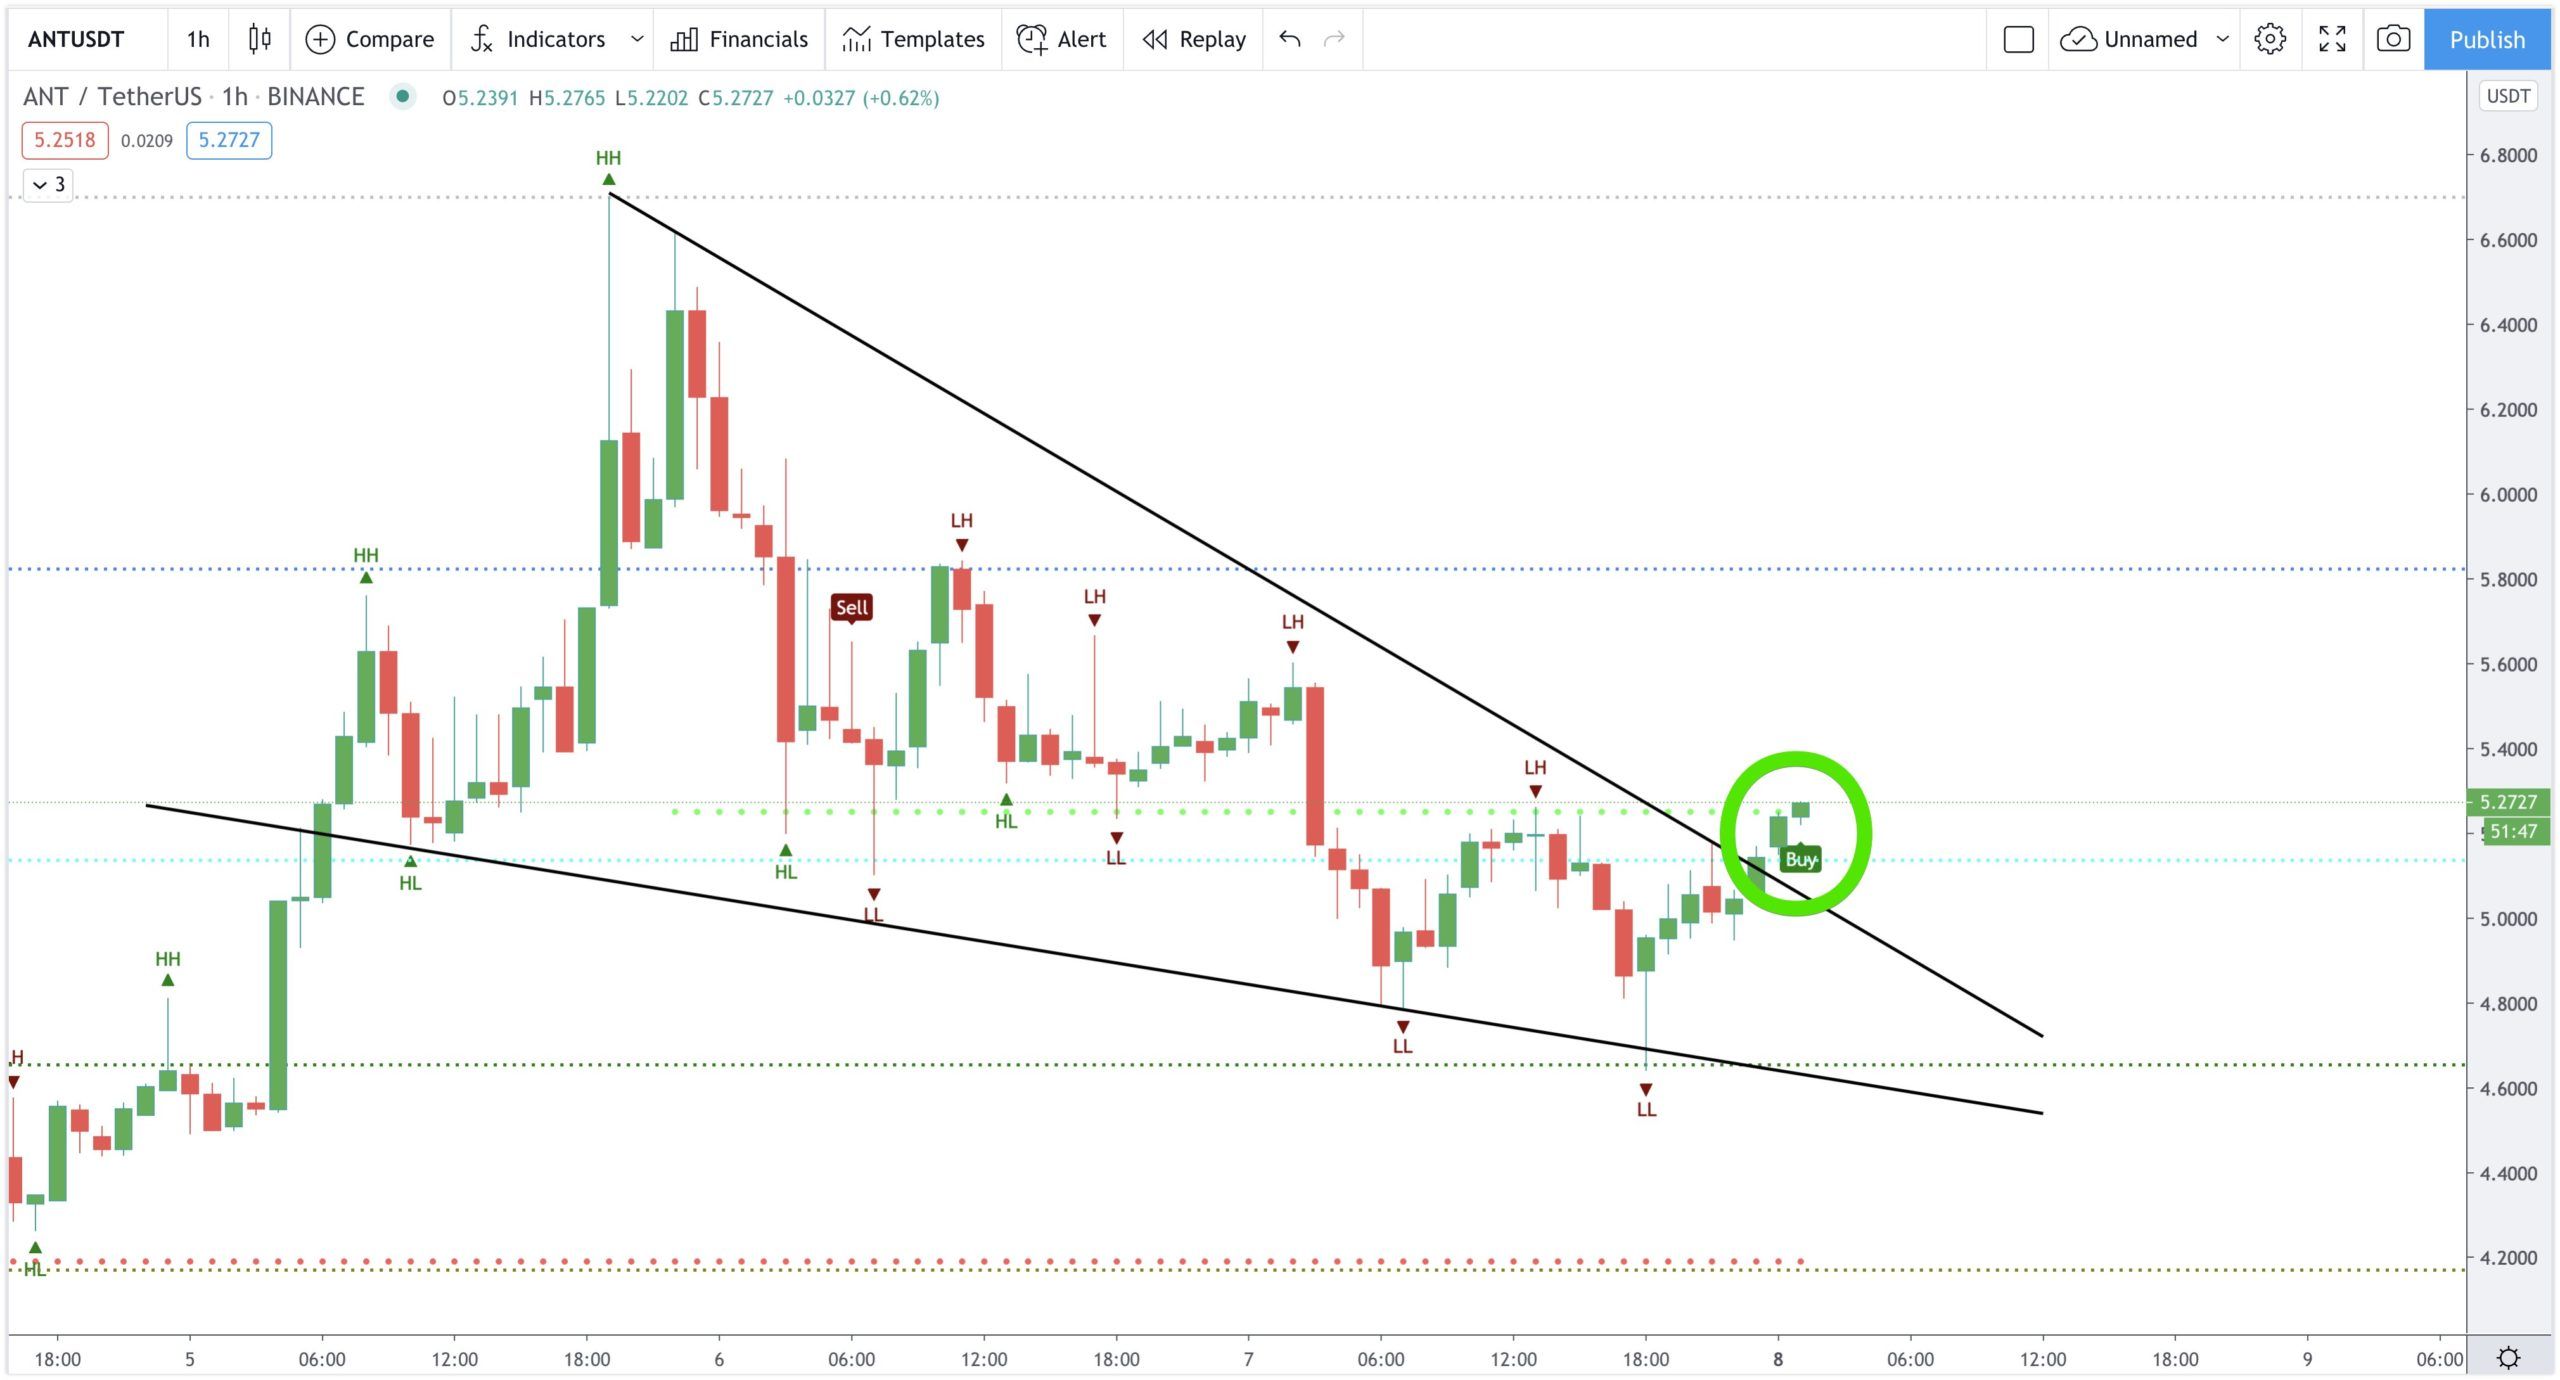
Cryptocurrency trader @Cryptoboss1984 outlined an ANT chart, which shows a breakout from a descending resistance line.
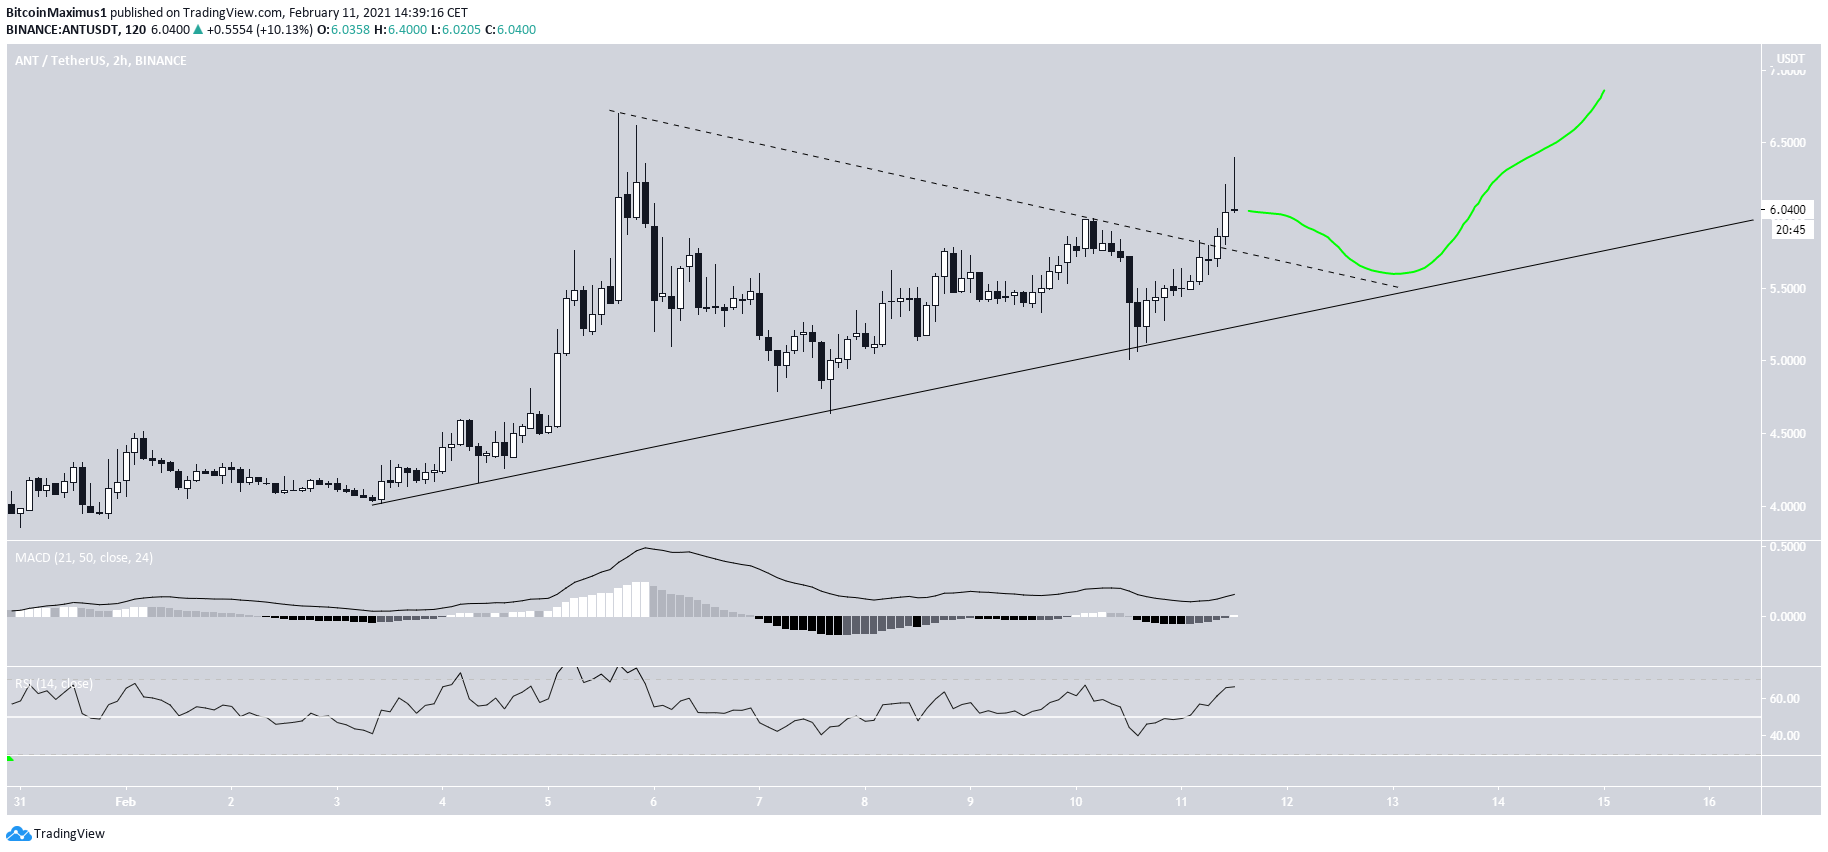
Since the breakout, ANT has moved slightly upwards but seems to have stalled near $6.40. Nevertheless, both the RSI and the MACD support the continuation of an upward move.
Therefore, while it could fall in the short-term, possibly validating the descending resistance line it broke out from (dashed), it should resume its upward momentum afterward.
Wave Count
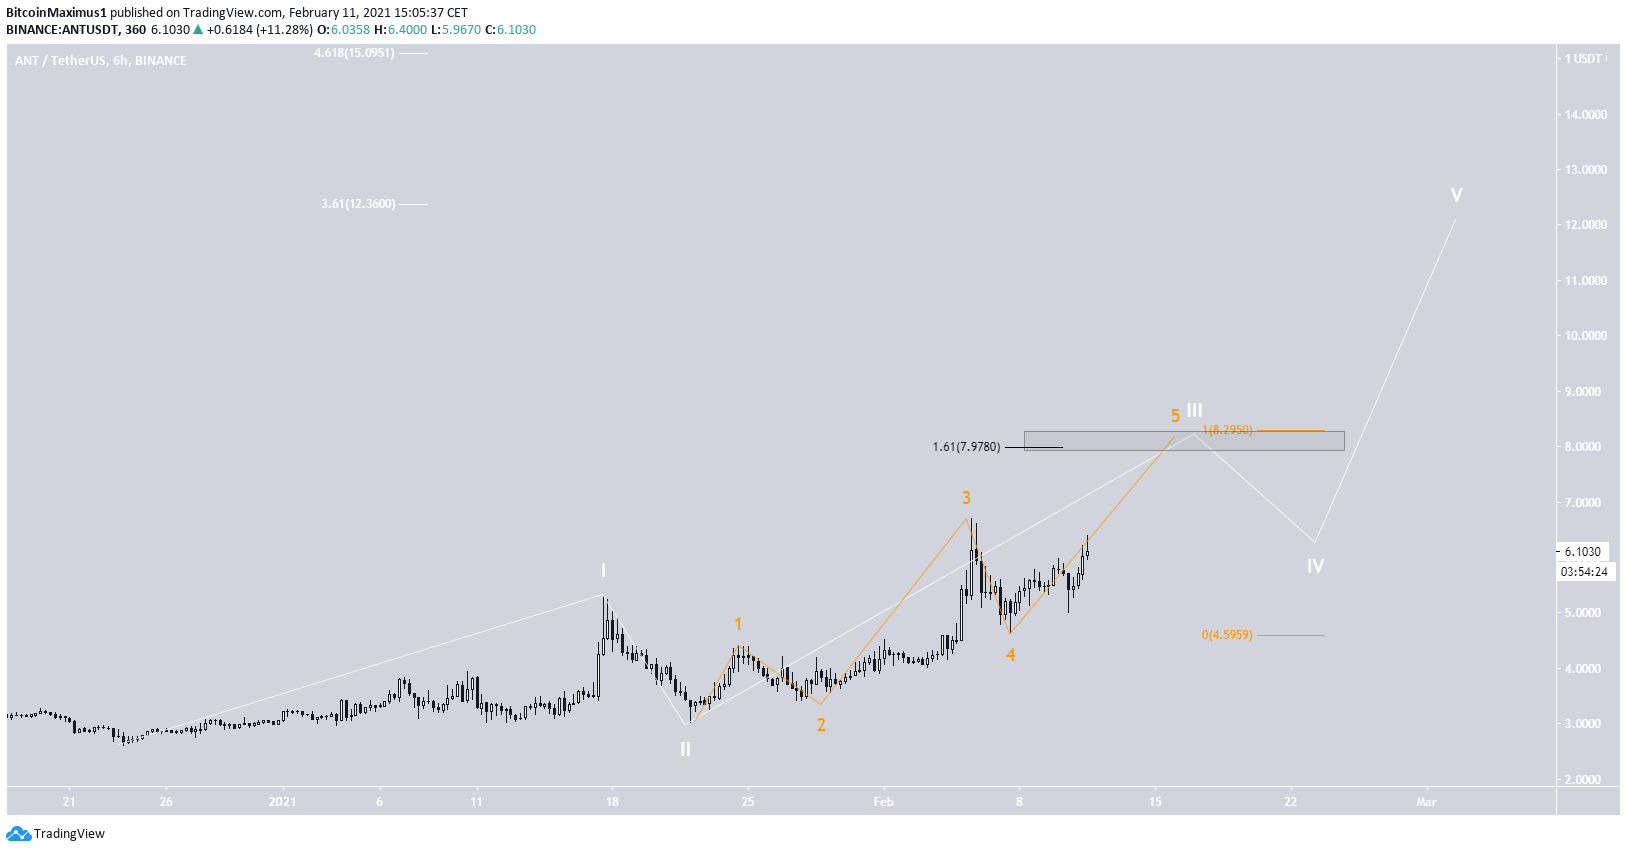
The wave count suggests that ANT is in wave three (white) of a bullish impulse that began with the previous Dec. 2020 lows. The sub-wave count is in orange, indicating that ANT is in sub-wave five.
The most likely target for the top of wave three is between $8-$8.30, found using an external Fib retracement and a Fib projection on waves 1-3. Wave five could end at either $12.36 or $15, the 3.61 and 4.61 Fib extensions of wave one.
Conclusion
To conclude, ANT should resume its upward move towards $8, and possibly continue increasing towards a new all-time high price in the process.
For BeInCrypto’s latest Bitcoin (BTC) analysis, click here.
