
While the price has shown signs of a reversal, a breakout from the current resistance would be required to flip the trend.
BEL Following Descending Resistance
The BEL price has been decreasing since Sept 15, when it closed an all-time high price of $9.75 On Sept 22, the price broke down from the $2.90 area and validated it as resistance two days later.
Afterward, the price resumes its downward movement. (The logarithmic chart is used below to better show large price fluctuations).
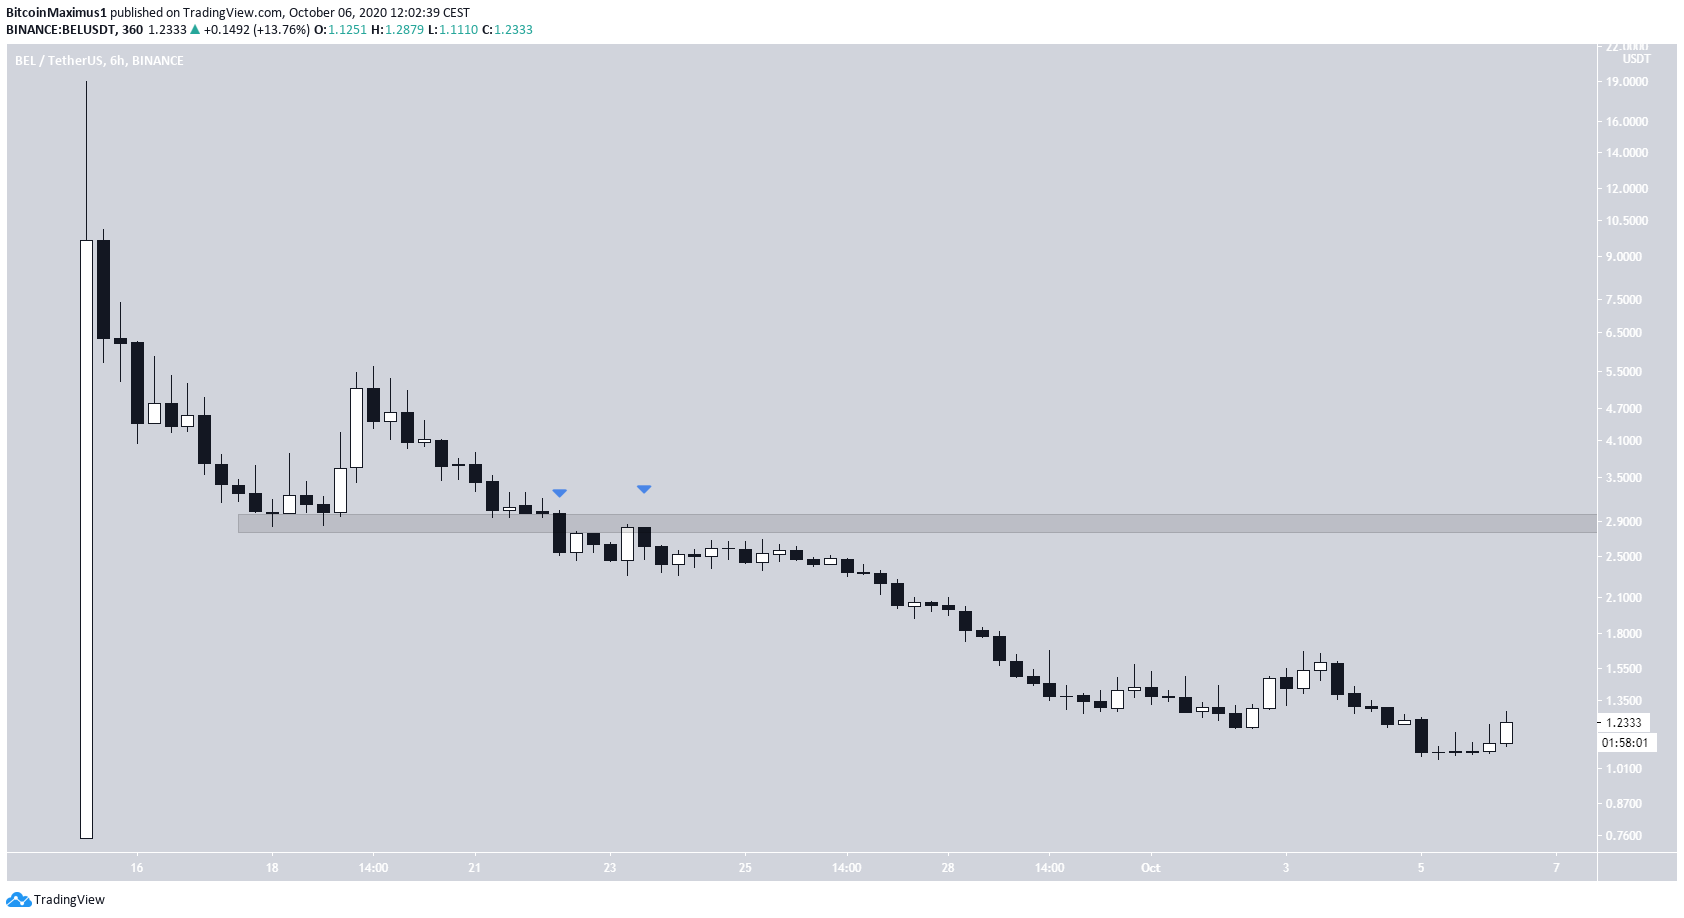
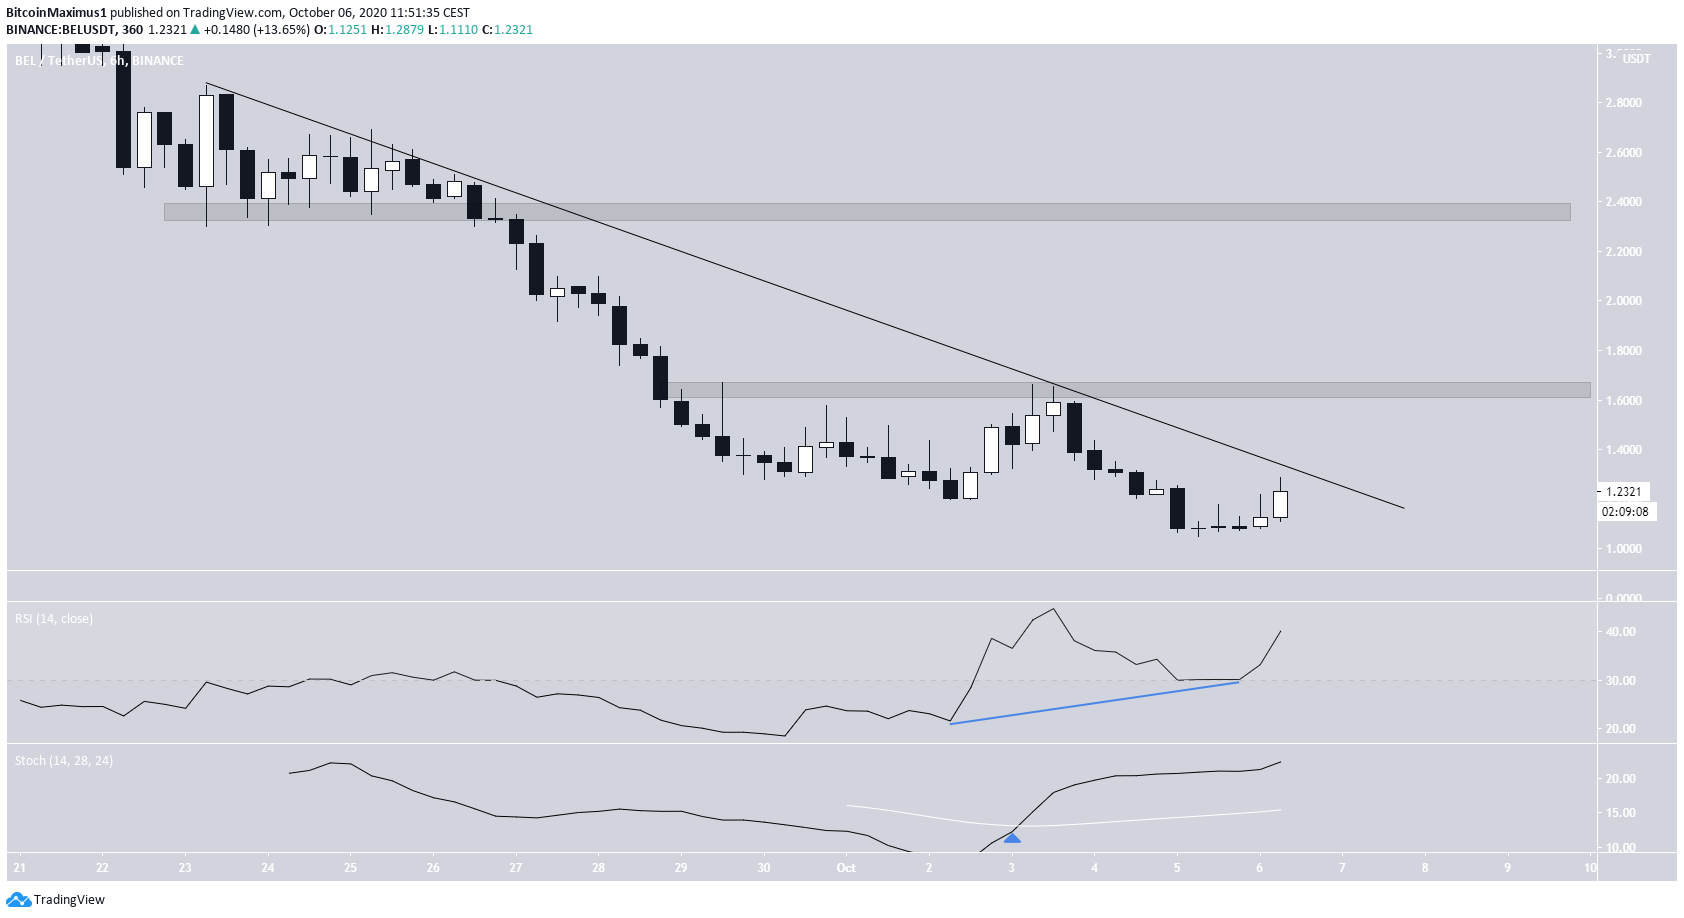
Since then, the price has been following a descending resistance line which has been validated multiple times. The price reached a low of $1.05 on Oct 5 and is currently in the process of making another breakout attempt.
There is a considerable bullish divergence in the RSI, which has moved outside of its oversold territory. In addition, the stochastic oscillator has made a bullish cross.
If the price breaks out from the descending resistance line, the next resistance levels are found at $1.65 and $2.35.
Wave Count
Cryptocurrency trader @Mesawine1 outlined a Bella Protocol (BEL) chart, in which one more decrease towards $0.80 occurs before the price breaks out from the descending channel:
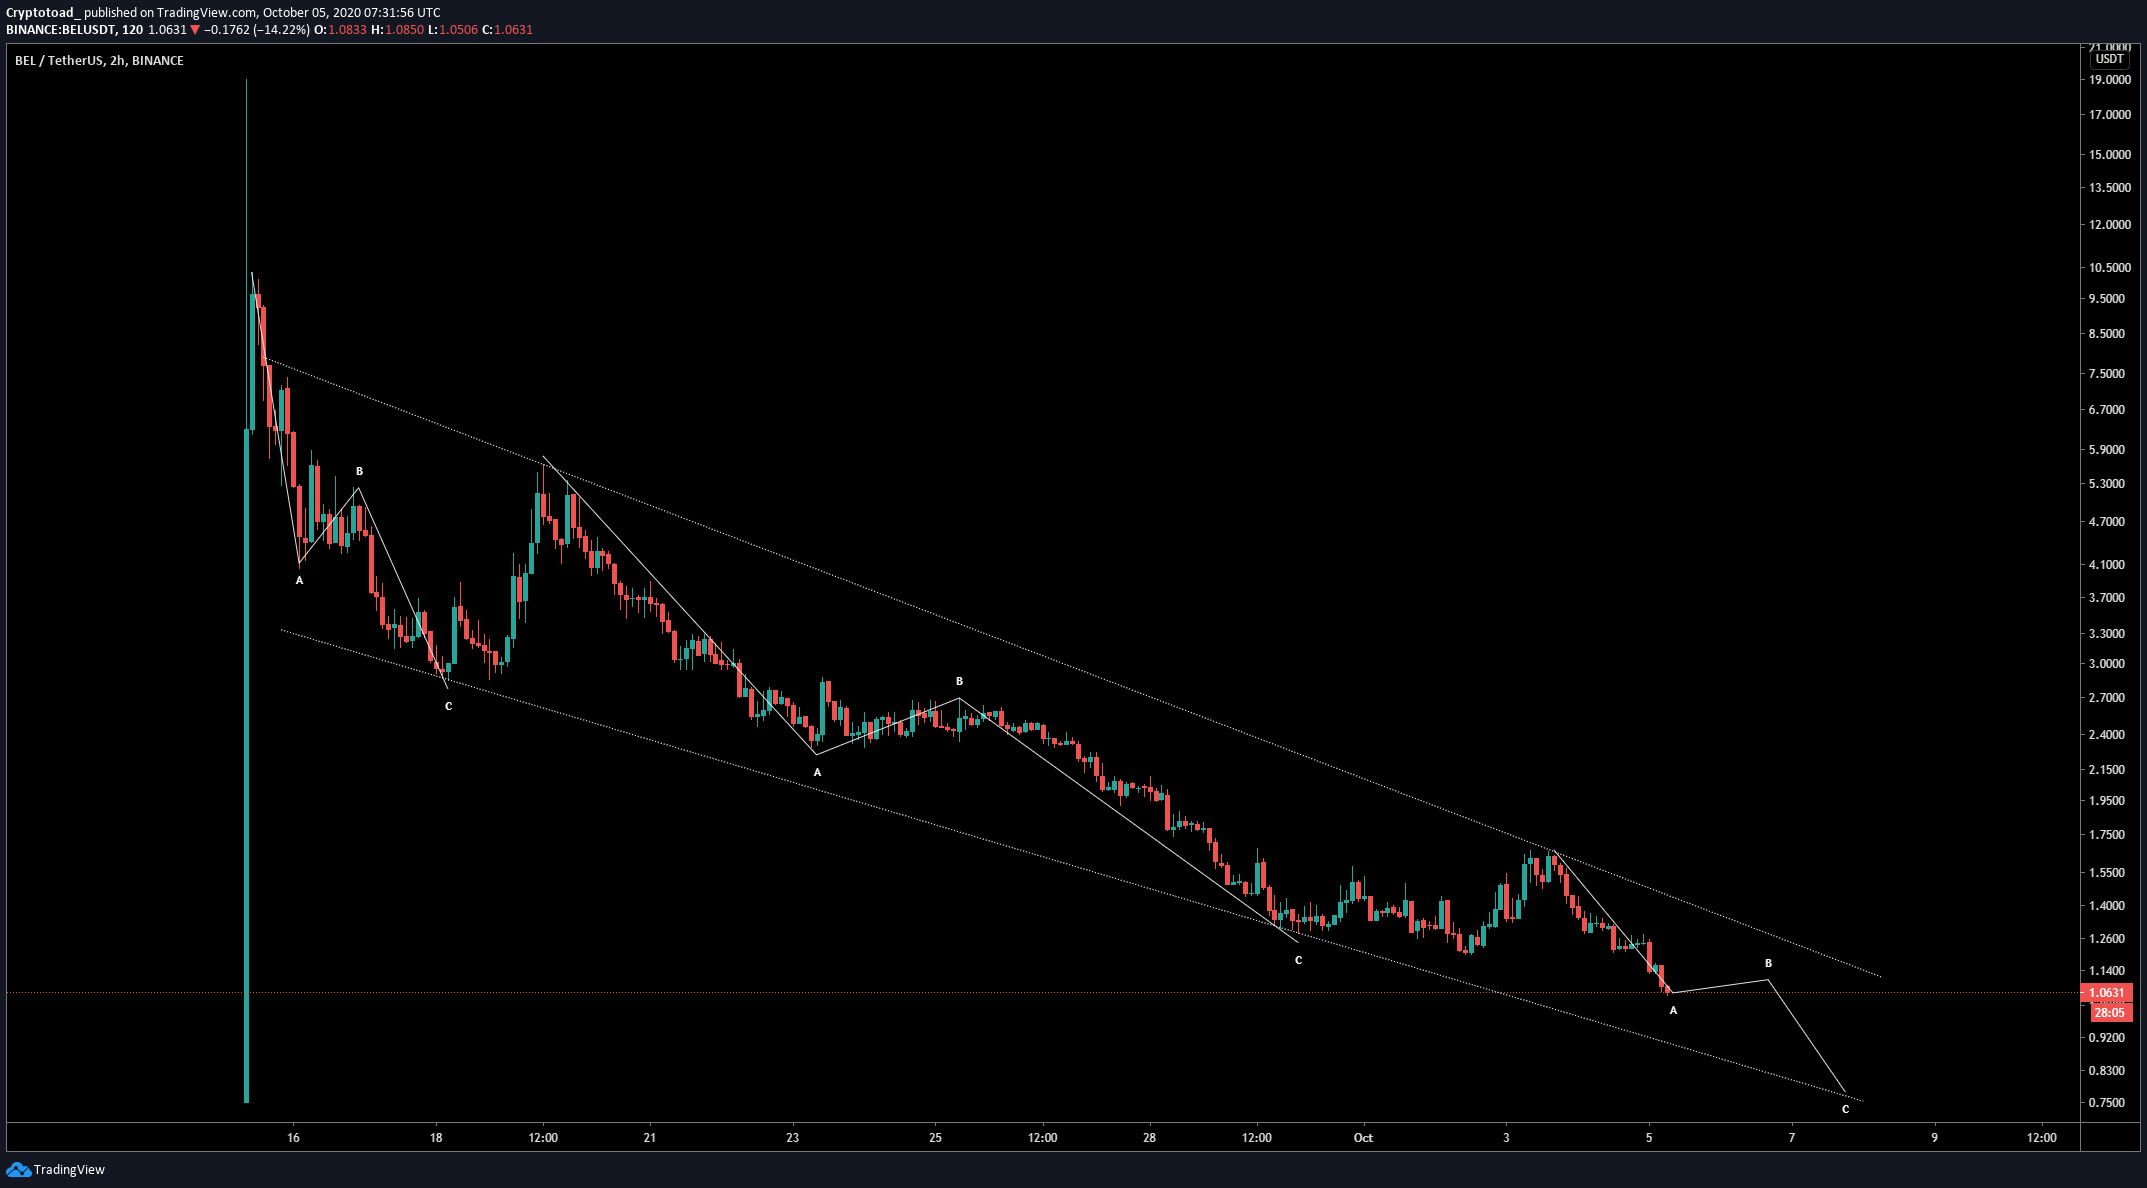
Since Oct 3, the BEL price has likely begun a bearish impulse (shown in red below). If so, there is likely one more wave down to go, which could take the price between $0.80-$0.89.
Furthermore, wave 4 (highlighted) looks to be corrective rather than the beginning of a new upward movement, so another decrease is expected.
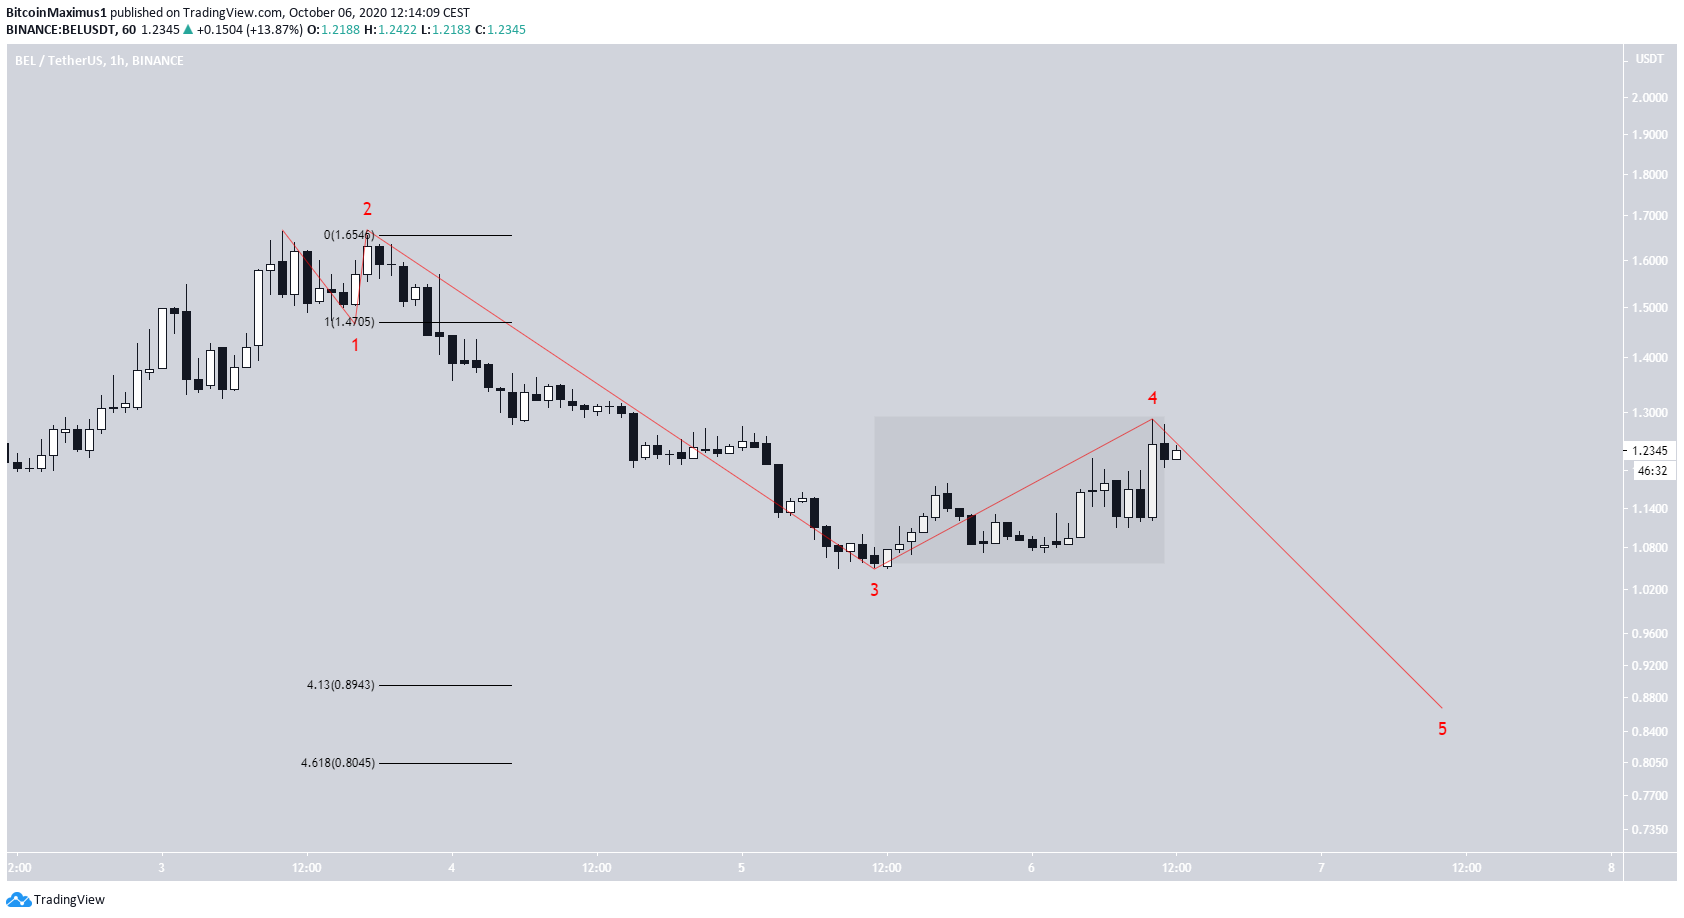
To conclude, while it seems that BEL will make another low before beginning to retrace upwards, a breakout from the current descending resistance line would likely accelerate this process.
For BeInCrypto’s latest Bitcoin analysis, click here!
Disclaimer: Cryptocurrency trading carries a high level of risk and may not be suitable for all investors. The views expressed in this article do not reflect those of BeInCrypto.
