
Reserve Rights (RSR) has broken out from a two-month-long bullish pattern. It could potentially increase all the way to $0.01 after an initial retracement.
Despite the ongoing market correction that began on Tuesday, RSR has gone contrary to the market movements and managed to create a bullish engulfing candlestick.
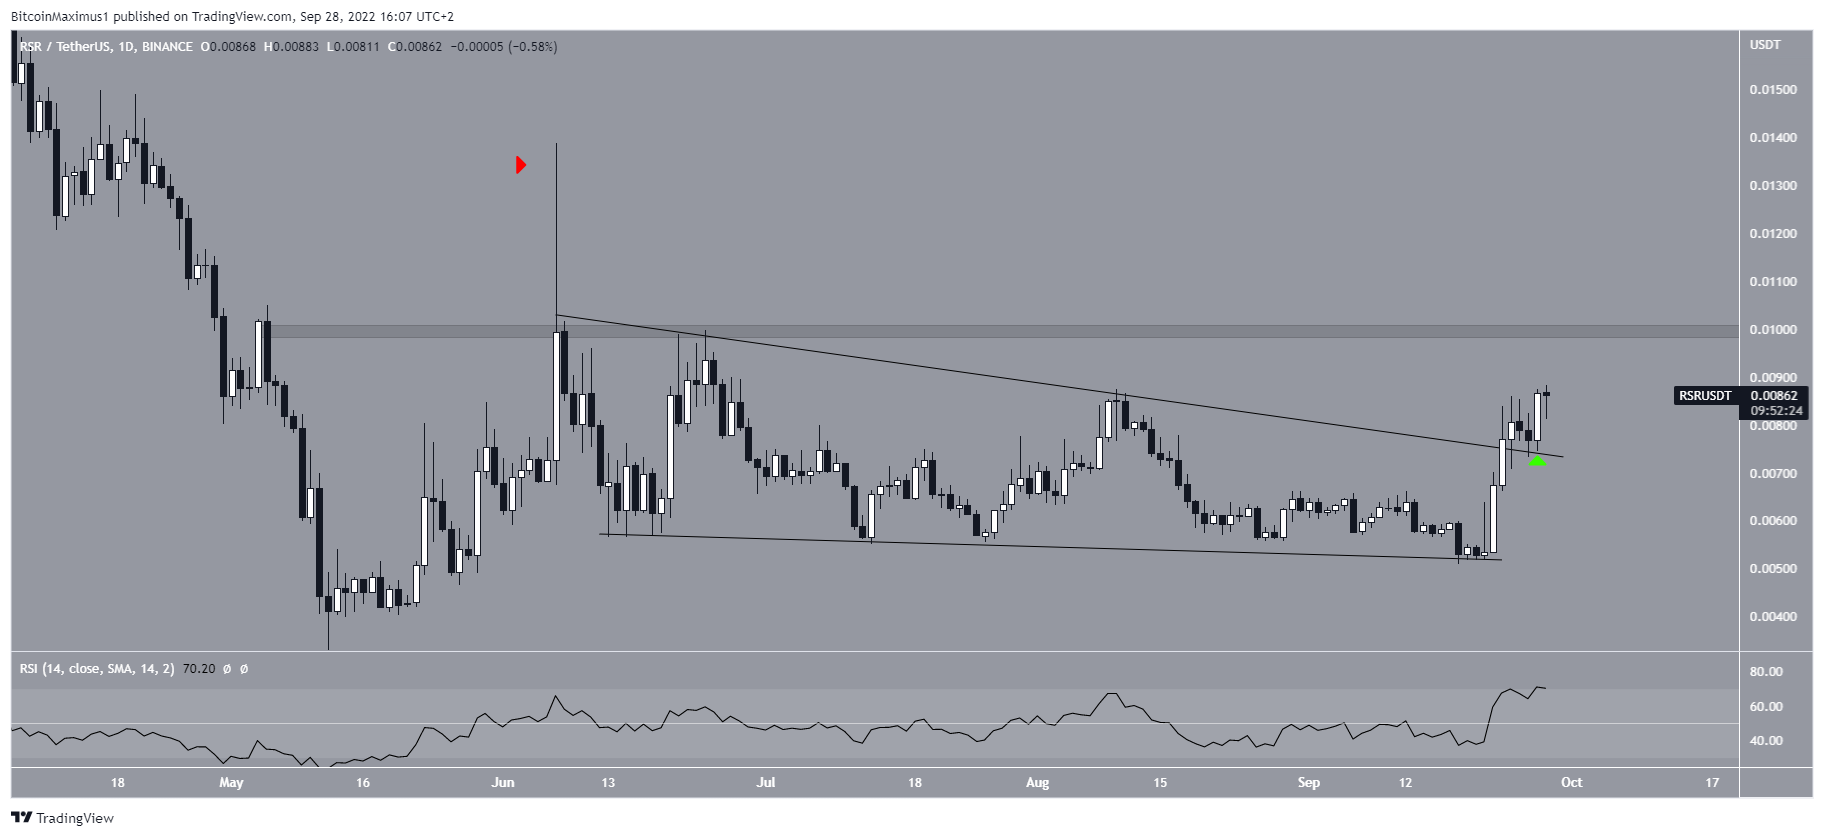
The candlestick also served to validate (green icon) the resistance line of the previous descending wedge, from which the price broke out on Sept. 23.
The daily RSI also legitimizes the breakout, since it has moved above 50 and is still increasing. If the upward movement continues, the closest resistance area is at $0.01.
The price has not moved above it since the wick high of June 7 (red icon) and has not reached a close above it since May.
Therefore, despite the breakout, a reclaim of the $0.01 area is required in order for the bullish reversal to be confirmed.
Short-term weakness could lead to retracement
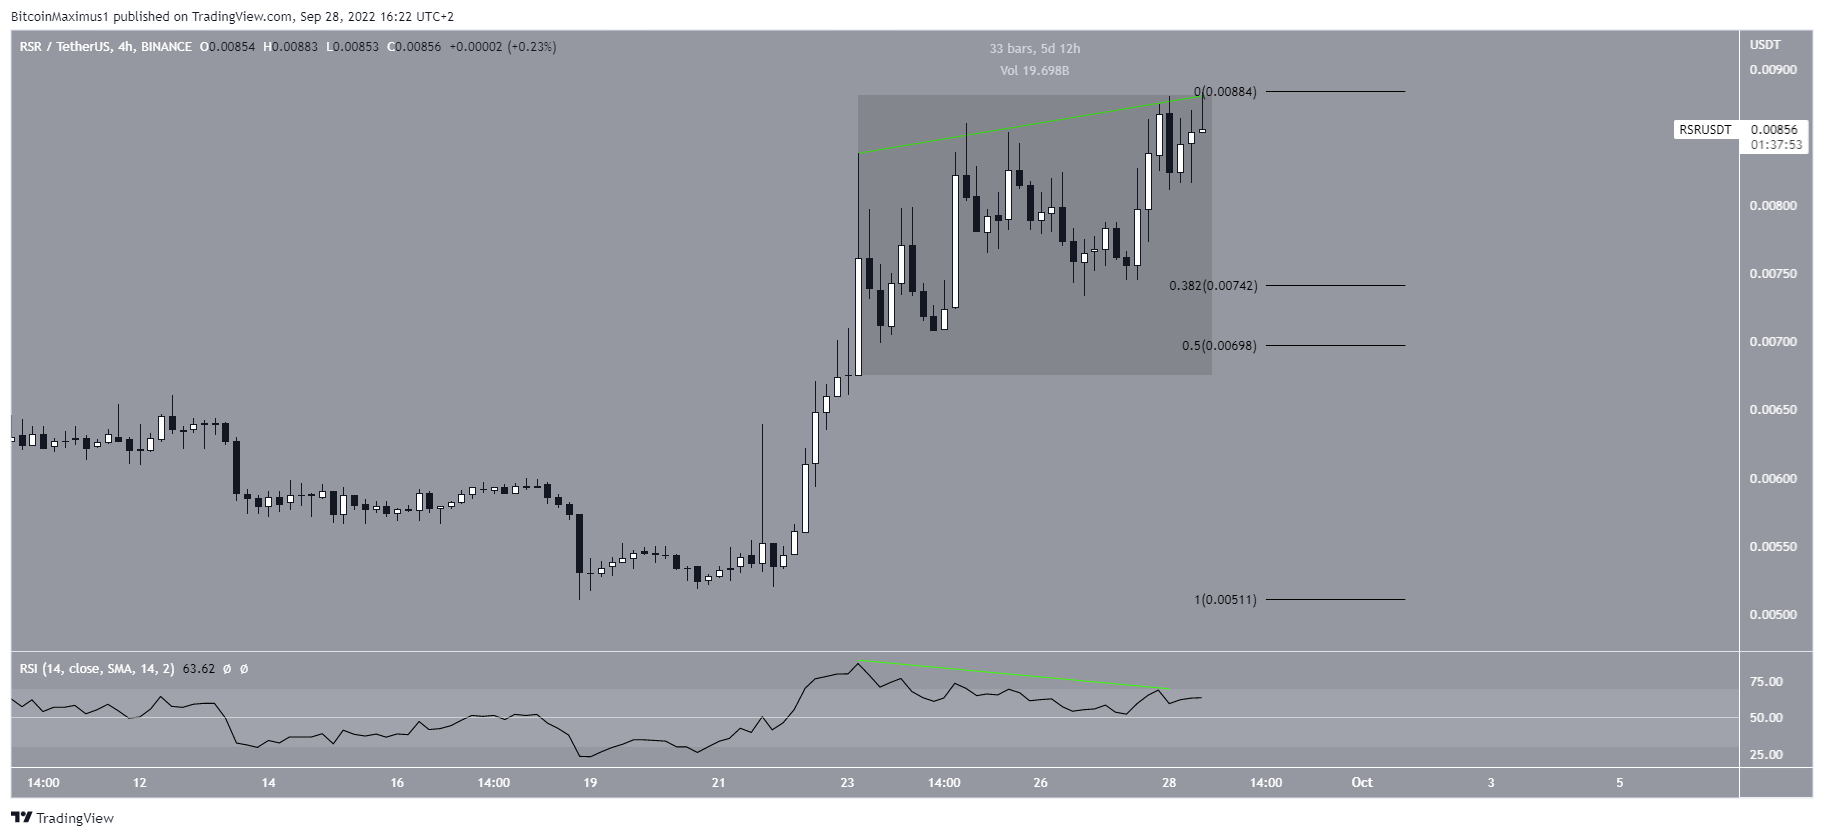
Despite the breakout and bullishness from the daily time frame, the four-hour chart shows considerable weakness in the form of bearish divergence in the RSI (green line) and several long upper wicks, which are considered signs of selling pressure.
Moreover, the movement over the past five days has had significant overlap, suggesting that it is corrective.
If a retracement occurs, the main support area would be between $0.007 and $0.0074, created by the 0.382-0.5 Fib retracement support levels.
After it is reached, RSR could create a higher low and potentially resume its upward movement towards $0.01.
Performance more evident in RSR/BTC pair
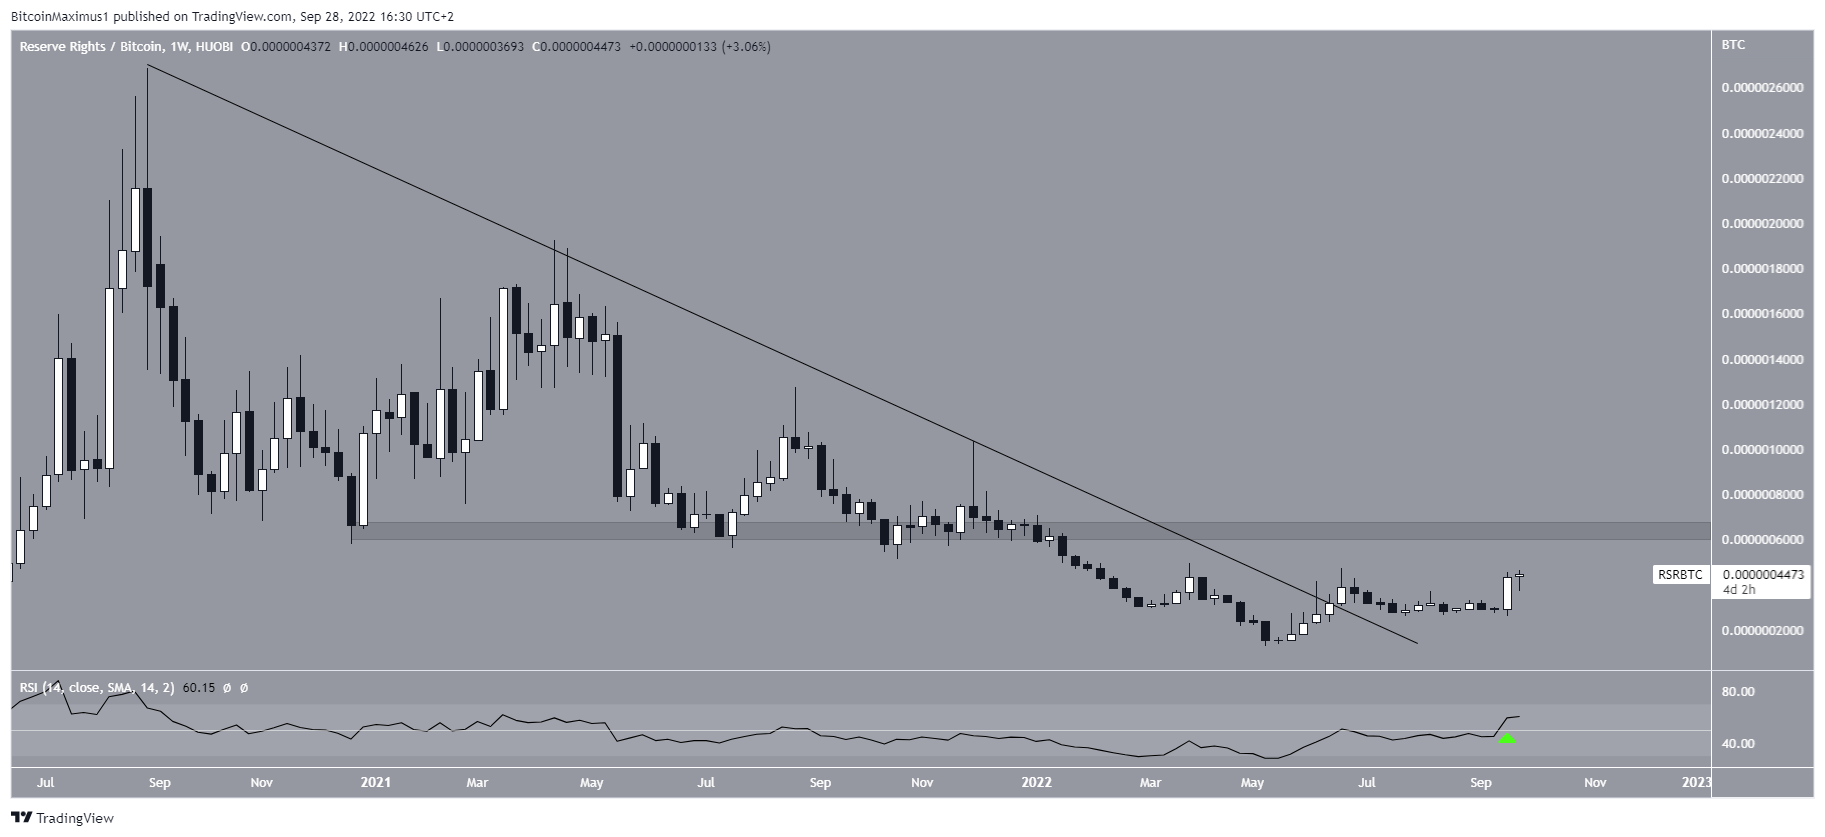
The scale of the outperformance relative to the market is better seen when looking at the RSR/BTC pair. The price created a massive bullish engulfing candlestick on Sept. 19, validating the previous breakout from a descending resistance line.
The increase was also combined with a RSI movement above 50 (green icon), further increasing its legitimacy.
If the upward movement continues, the next closest resistance area would be at 64 satoshis. As it stands, an increase towards this area is the most likely possibility.
For Be[In]Crypto’s latest Bitcoin (BTC) analysis, click here
