
The Bitcoin price has been increasing in the month of April, having done so by more than 10% until now. However, the rally stalled once the price reached an important moving average (MA), which has been a reliable predictor of the trend’s direction for the entirety of 2020.
Well-known trader @pierre_crypt0 outlined a chart showing Bitcoin’s 800-hour moving average (MA). He believes that the price movement in relation to this MA will determine the direction of the trend. A price close above it would mean that the bulls are in control while a close below would mean the opposite.
One hour to go for bulls to reclaim H4 200 EMA, still running the show here.
FYI last time we reclaimed it was on Jan 5th, and only lost it on Feb 25th
Would be an encouraging sign for bulls, but still a lot of fight to win this area. I guess another crazy day for us.#Bitcoin https://t.co/kHlnSAo6AP pic.twitter.com/7JgT2Zsxap
— Pierre (@pierre_crypt0) April 3, 2020
Will the BTC price be able to successfully close above this MA? Continue reading below if you are interested in finding out.
Moving Average
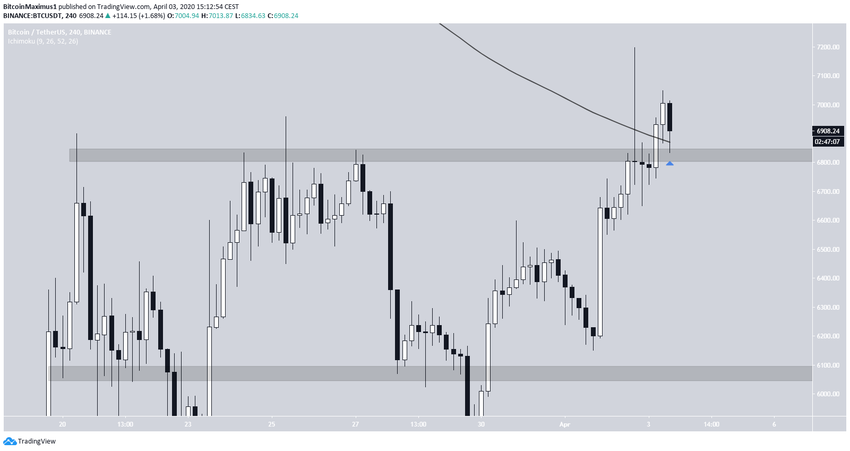
At the time of writing, the BTC price has already moved above this moving average (MA). In addition, it has moved above the $6,850 area that previously acted as resistance and is seemingly in the process of validating it as support.
If the price were to reach a close above this MA/support area, it would have major bullish implications for the direction of the future trend. However, there are more than two hours left until the candlestick closes, so it is entirely possible that the close will be below this area. However, there is no bearish divergence to suggest that such a movement will transpire.
Previous Movement
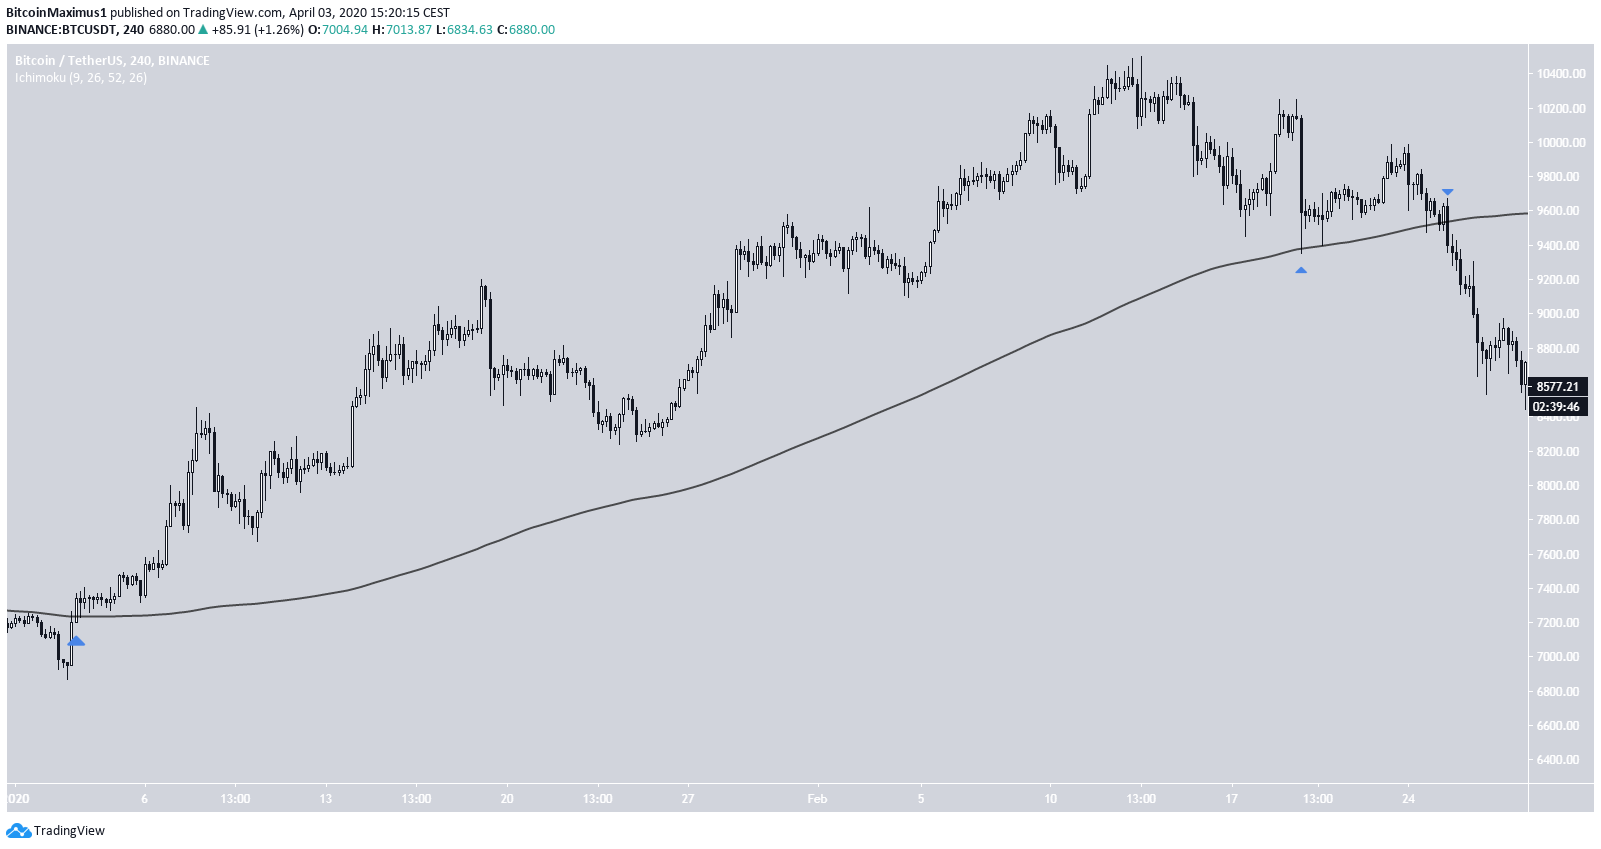
When we look at the price movement in relation to the same MA since the beginning of the year, the MA turns out to be a very reliable predictor of the trend’s direction. It moved above this MA on Jan. 3 and began an upward move that led to the yearly high of $10,500. Afterwards, it began to decrease and touched it on Feb. 19, finding support above it and initiating a bounce. However, the price decreased below this MA on Feb. 25. Until now, the price had yet to touch this MA.
If the price is able to reach a close above this MA, it could increase rapidly all the way to $8,000. If not, a price decrease towards the next support area at $6,000 could occur.
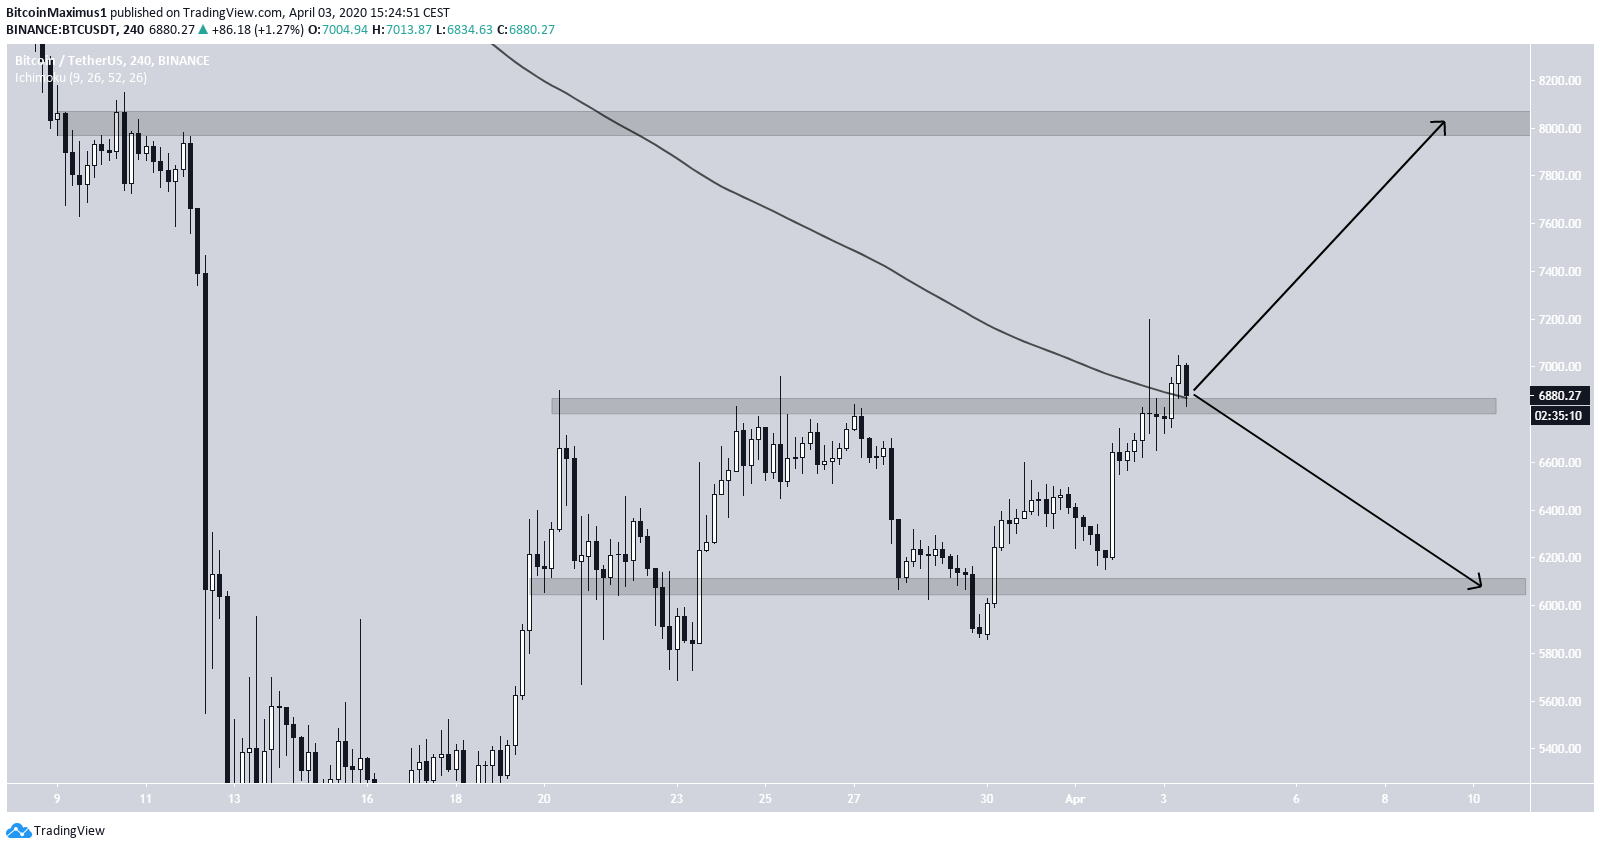
To conclude, the Bitcoin price has reached the 800-week moving average (MA), which in 2020 has been instrumental in determining the direction of the trend. A close above it would indicate that the price is heading towards $8,000, while a close below could trigger a decrease towards $6,000.
