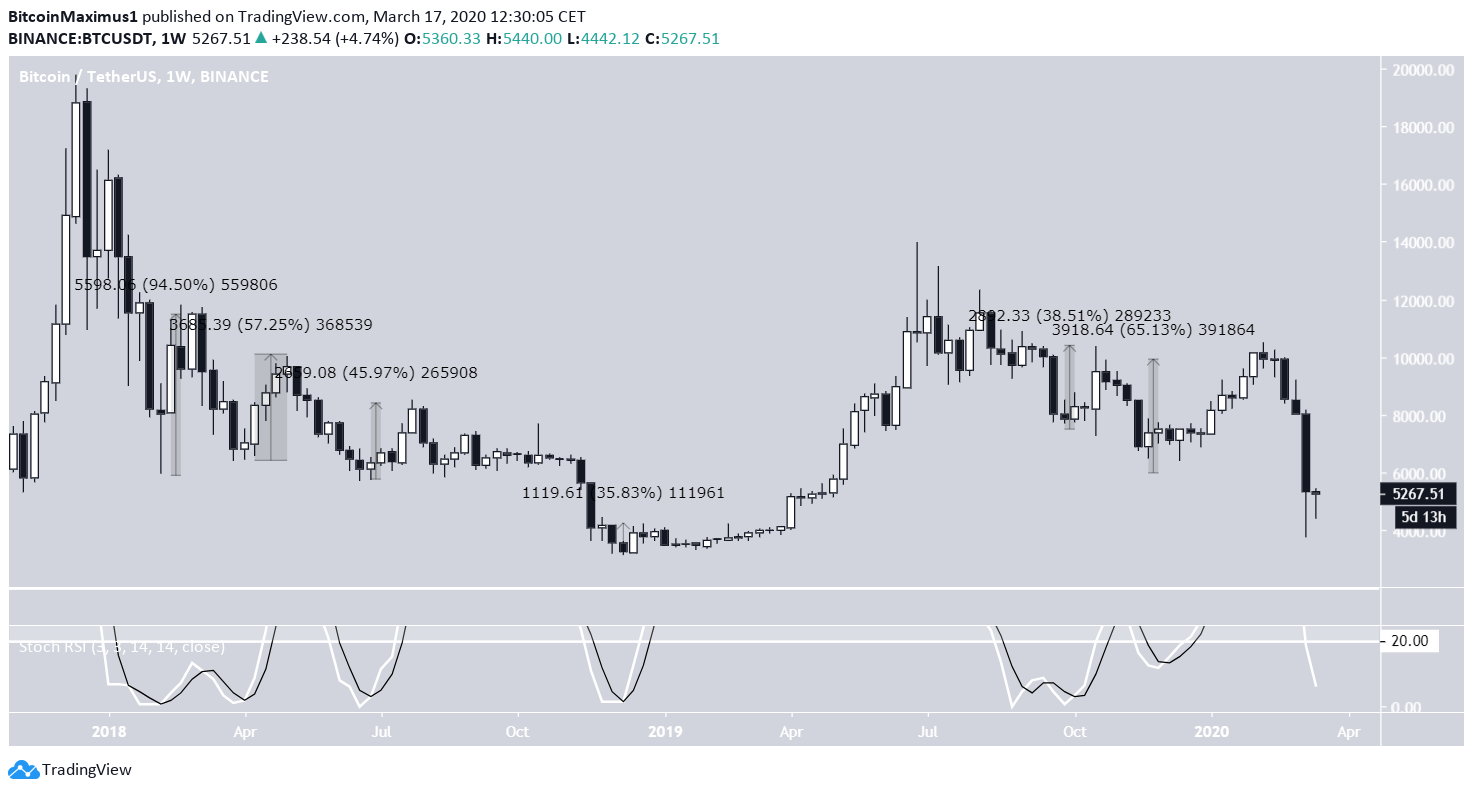
The Bitcoin price decreased by more than 40 percent over the previous week. This caused most indicators to show oversold levels. One such indicator, in particular, gave a signal that has preceded significant pumps in its previous history.
Bitcoin (BTC) Price Highlights
- The Stochastic RSI has fallen below 20.
- This is the ninth time it has done so since December 2017.
- In 7/8 previous times, the Bitcoin price has pumped afterward.
Let’s take a closer look at the BTC price movement along with the stochastic RSI in order to determine if the price will act the same way this time.#Bitcoin | When the Stoch RSI has been under 20 points:
— Crypto Rand (@crypto_rand) March 17, 2020
Seven times out of eight, the price has pumped an average of +40% on the following weeks.
We are under 20 points now. pic.twitter.com/B0TMgLvykf
Stochastic RSI
The tweet uses the Stochastic RSI in order to predict the future movement. More specifically, it has isolated eight cases since December 2017 in which the Stoch RSI has been below 20. They are:- February 5, 2018 – (94.5 percent)
- April 23, 2018 – (57.25 percent)
- June 25, 2018 – (45.97 percent)
- December 10, 2018 – (35.83 percent)
- August 26, 2019 – (16.93 percent)
- September 10, 2019 – (38.51 percent)
- December 2, 2019 – (65.13 percent)
 However, what the indicator fails to capture is the time it took from the moment the RSI crossed below 20 to the moment of the bounce. For example, the RSI stayed below 20 for 25 days prior to the bounce on February 5 and for 14 days prior to that on April 23. The current RSI has been below 20 for only seven days.
Finally, the RSI is created out of two lines, the short-term one (white) and the longer-term one (black). During each of the previous bounces, both the short and long-term lines had been below 20. This is not the case in the current movement since only the short-term one has crossed into oversold territory.
 Therefore, while a bounce could occur based on the previous history of the Stoch RSI, it might not transpire for a few more weeks. In addition, this indicator does not state that BTC has reached a bottom, rather than a relief rally is likely to occur.
Top crypto platforms in the US
Disclaimer
In line with the Trust Project guidelines, this price analysis article is for informational purposes only and should not be considered financial or investment advice. BeInCrypto is committed to accurate, unbiased reporting, but market conditions are subject to change without notice. Always conduct your own research and consult with a professional before making any financial decisions. Please note that our Terms and Conditions, Privacy Policy, and Disclaimers have been updated.

Valdrin Tahiri
Valdrin discovered cryptocurrencies while he was getting his MSc in Financial Markets from the Barcelona School of Economics. Shortly after graduating, he began writing for several different cryptocurrency related websites as a freelancer before eventually taking on the role of BeInCrypto's Senior Analyst.
(I do not have a discord and will not contact you first there. Beware of scammers)
READ FULL BIO
Sponsored
Sponsored
