


Last week’s Bitcoin price decrease was very similar to a previous drop that transpired in February 2014. If the fractal continues to hold true, it would mean that the BTC price has yet to reach a bottom.
Bitcoin (BTC) Price Highlights
- The price is trading very close to its 200-week moving average (MA).
- There is support at $3,300-$3,600.
- The Bitcoin price might be following a fractal from 2014.
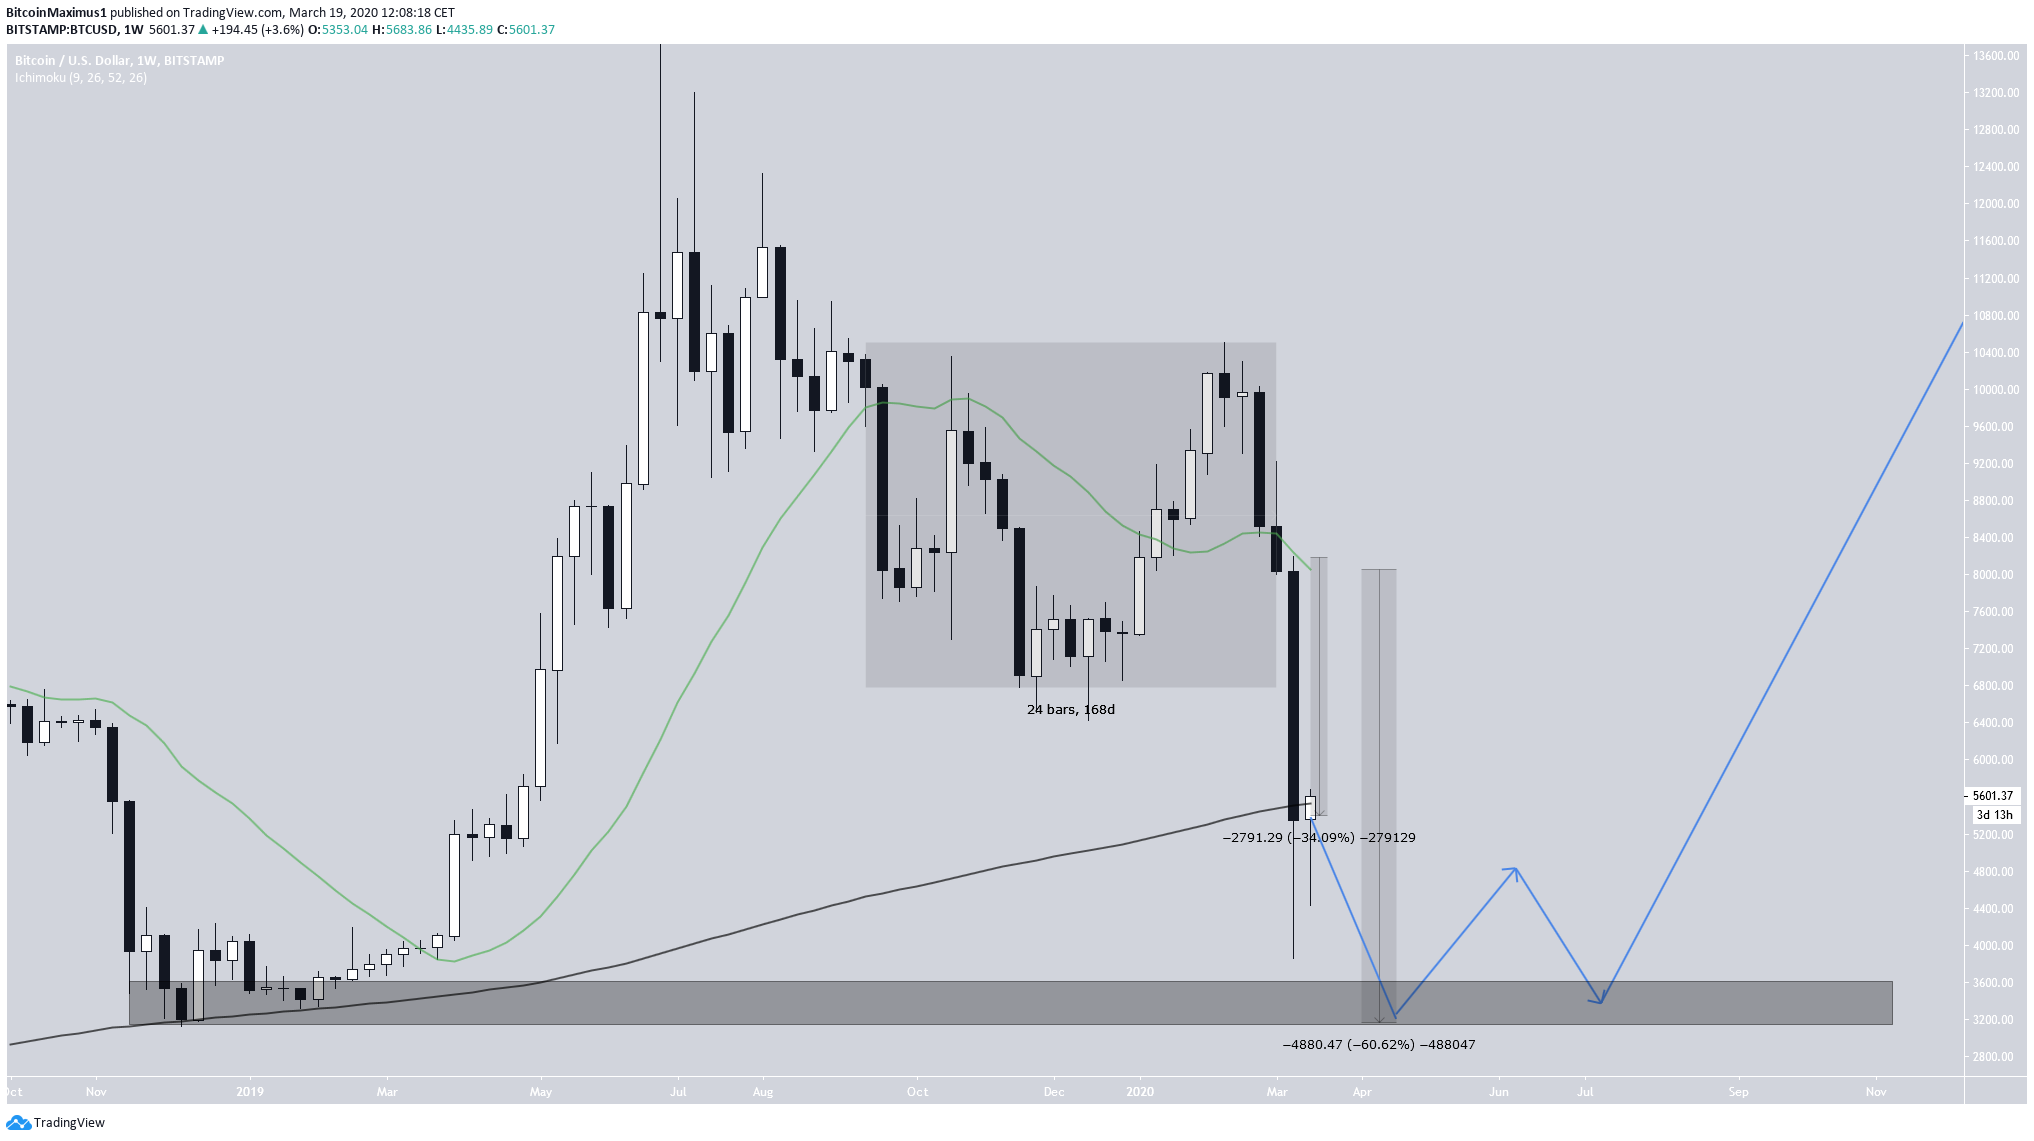
Well-known trader @TraderX0X0 tweeted a BTC price chart, stating that he is not convinced that the lows are in. However, he is not bearish and has outlined a possible movement which the price range trades for a while, before beginning an upward trend and breaking out above $10,000 before the end of the year.
https://twitter.com/TraderX0X0/status/1240442352453500936
Let’s take a closer look at the BTC price movement and determine the plausibility of this move transpiring as outlined in the tweet.
2014 Fractal
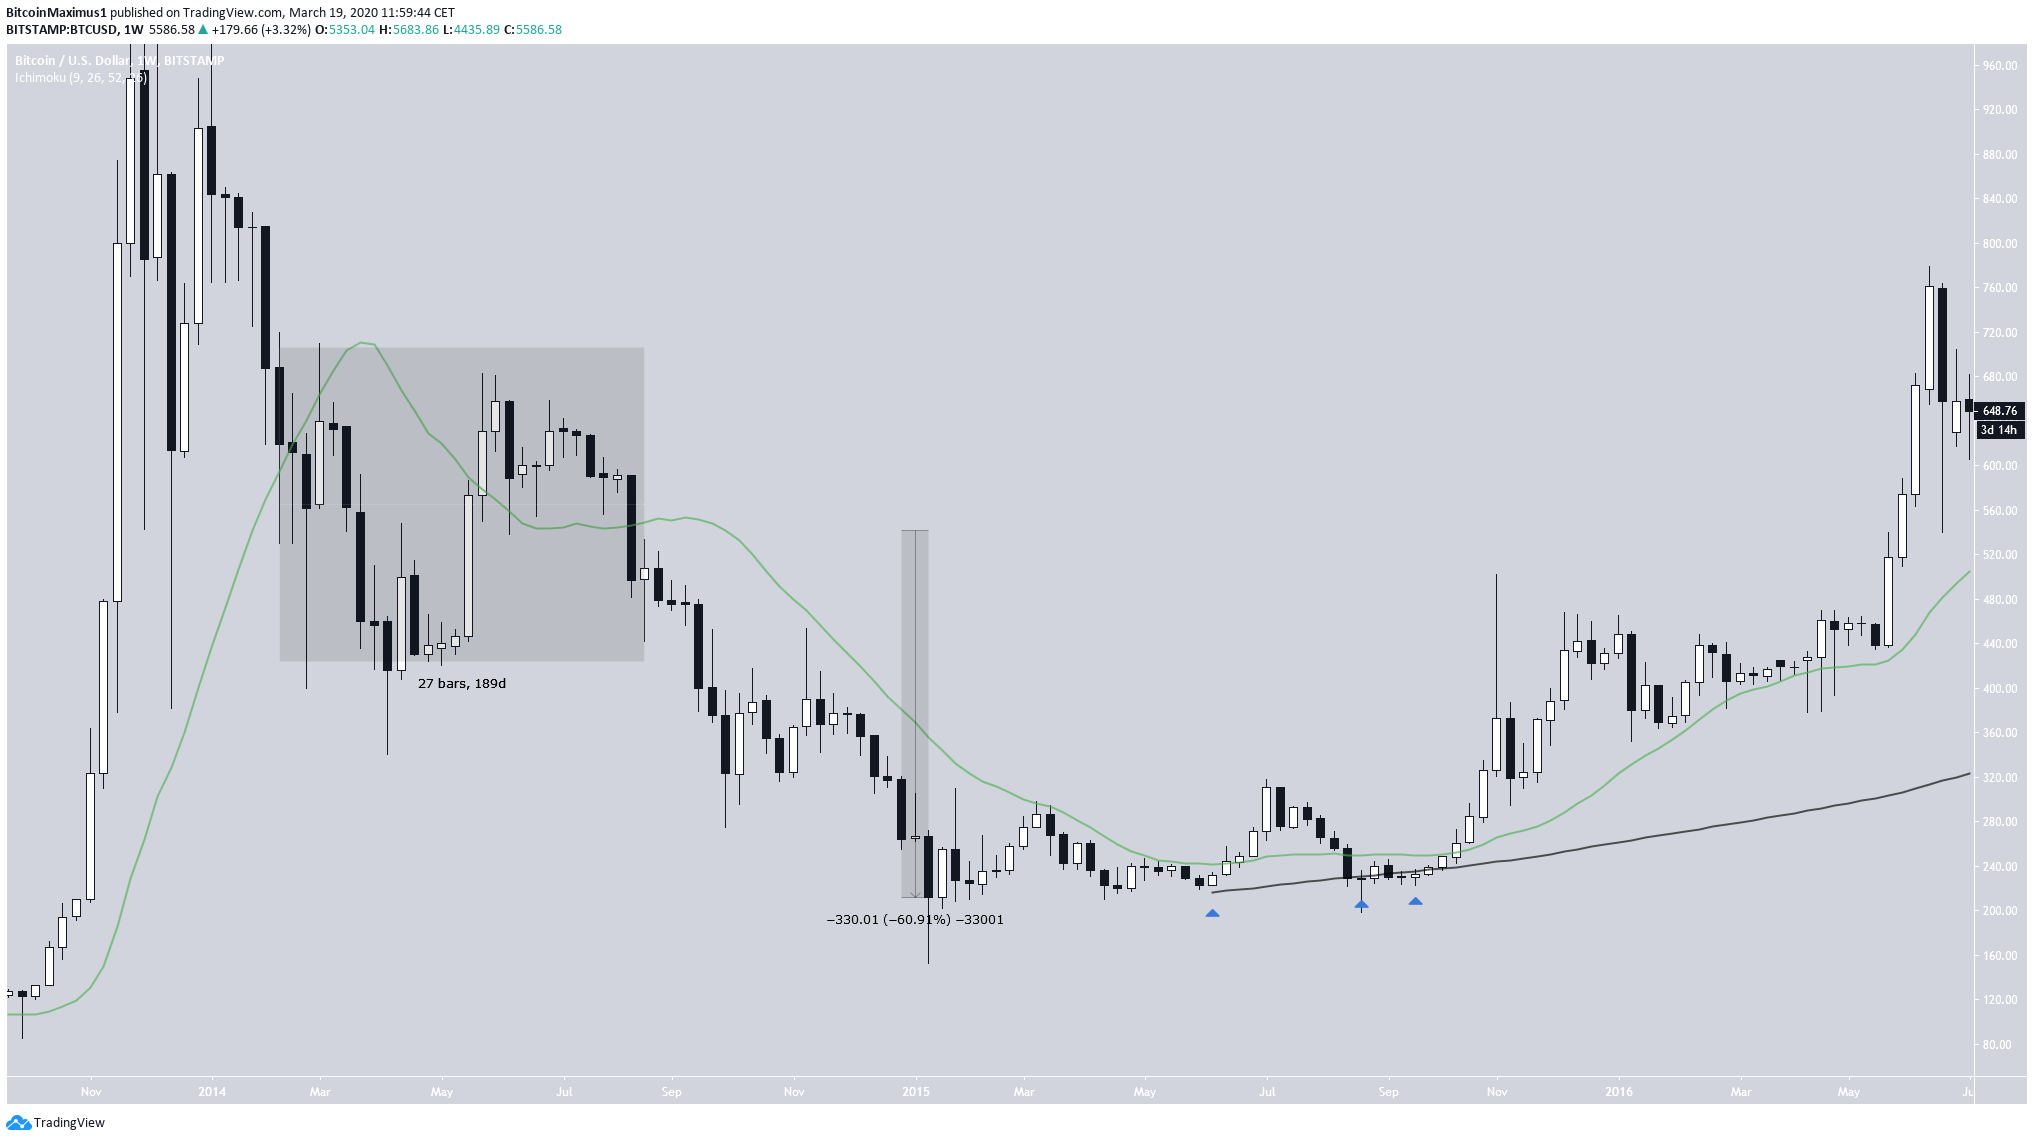
The fractal in the tweet compares two periods, one in the beginning of 2014 and the current one, in which the price traded above and below the 21-week MA prior to a significant price decrease.
The 2014 move began on the week of Feb. 10, which marked the beginning of a 189-day period in which the price moved above and below the 21-week MA numerous times.
Afterwards, a 61% decrease occurred (when using closing prices) which transpired in two downward waves.
This was followed by several touches of the 200-week MA, at which point both MAs were almost aligned with each other. This was the bottom and an upward trend that lasted until 2018 followed.
Current Movement
The week of Sept. 16, 2019 began a 168-day period in which the price moved above and below the 21-week MA numerous times. This was almost identical to the 2014 movement, with the only exception being that the move took a slightly shorter time to develop.
The current decrease has only measured 31%. If the price decreases by a full 61% as it did in 2014, it will reach the $3,300-$3,600 support area, created by the December 2018 bottom. If it continues following the fractal, it will validate the level as support before resuming its upward move by the end of the year.
The main difference about these fractals is the position of the price relative to its 200-week MA. While in 2014 the touch of the MA indicated the bottom, it has already reached it in the current movement since the price never reached a weekly close below it. If the fractal holds, it is expected to decrease significantly below it.
To conclude, the BTC price is possibly following a fractal from February 2014. If it continues doing so, it will reach a bottom near $3,300 and will begin an upward move that will take it to $10,000 by the end of the year.


