


Theta Token (THETA) has bounced considerably since its Dec 4 lows but has yet to confirm its bullish reversal.
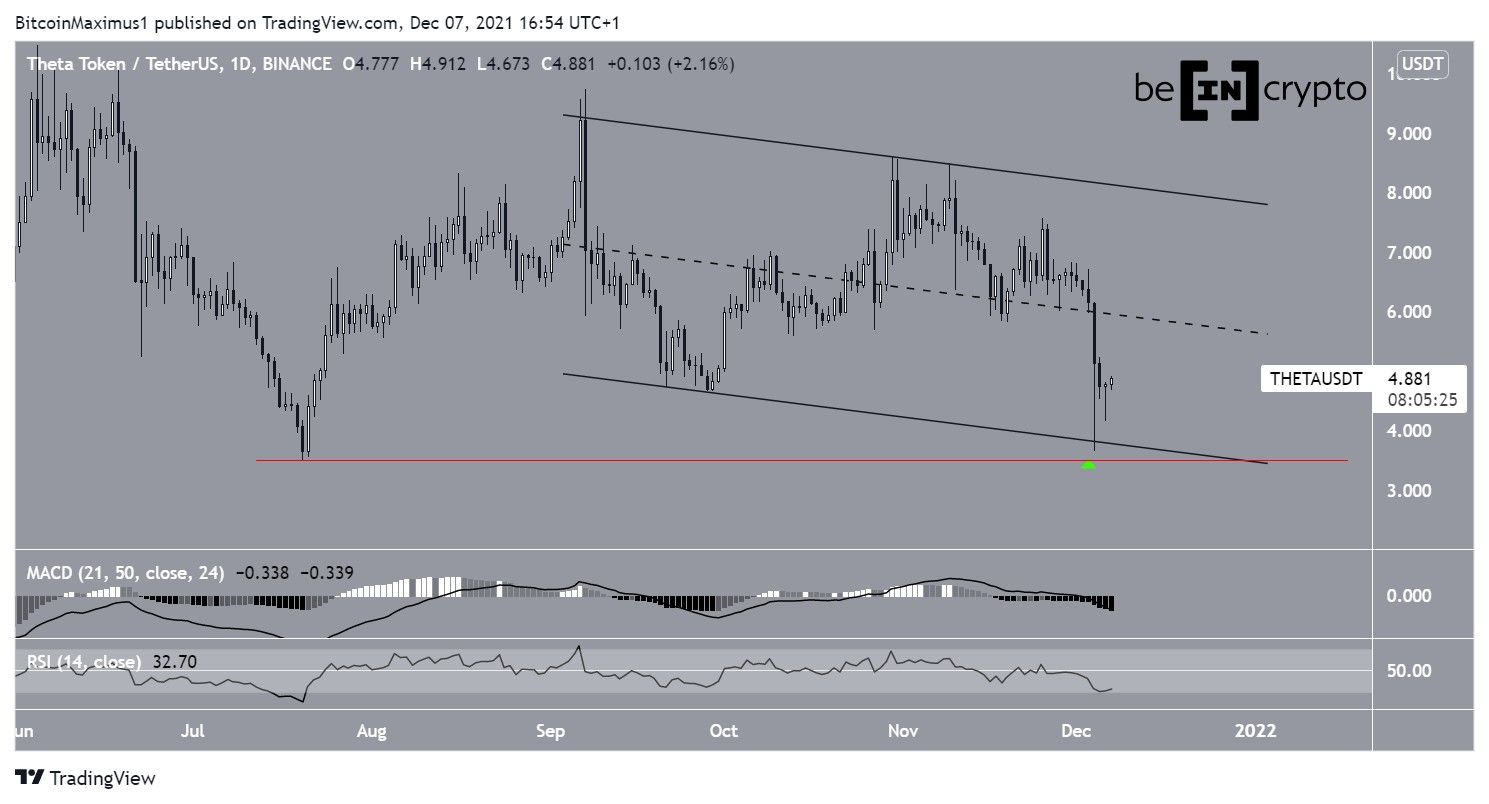
THETA has been decreasing since Sept 7. The decrease has been contained inside a descending parallel channel, which is considered a corrective pattern. This means that an eventual breakout from it would be likely.
On Dec 4, the token bounced at the support line of the channel, validating it for the first time since Sept.
More importantly, THETA managed to hold on above the July lows of $ (red line). This is important since it means that it is still possible that the token began a bullish impulse on July 19, and the current decrease is only a correction.
However, technical indicators in the daily time-frame are bearish.
The MACD, which is created by a short- and a long-term moving average (MA), is negative and decreasing. This means that the short-term MA is slower than the long-term one, and often occurs in bearish trends.
Similarly, the RSI, which is a momentum indicator, is below 50. This is also a sign of a bearish trend.
Therefore, while the possibility that THETA is bullish still remains, there are no bullish reversal signs in place.
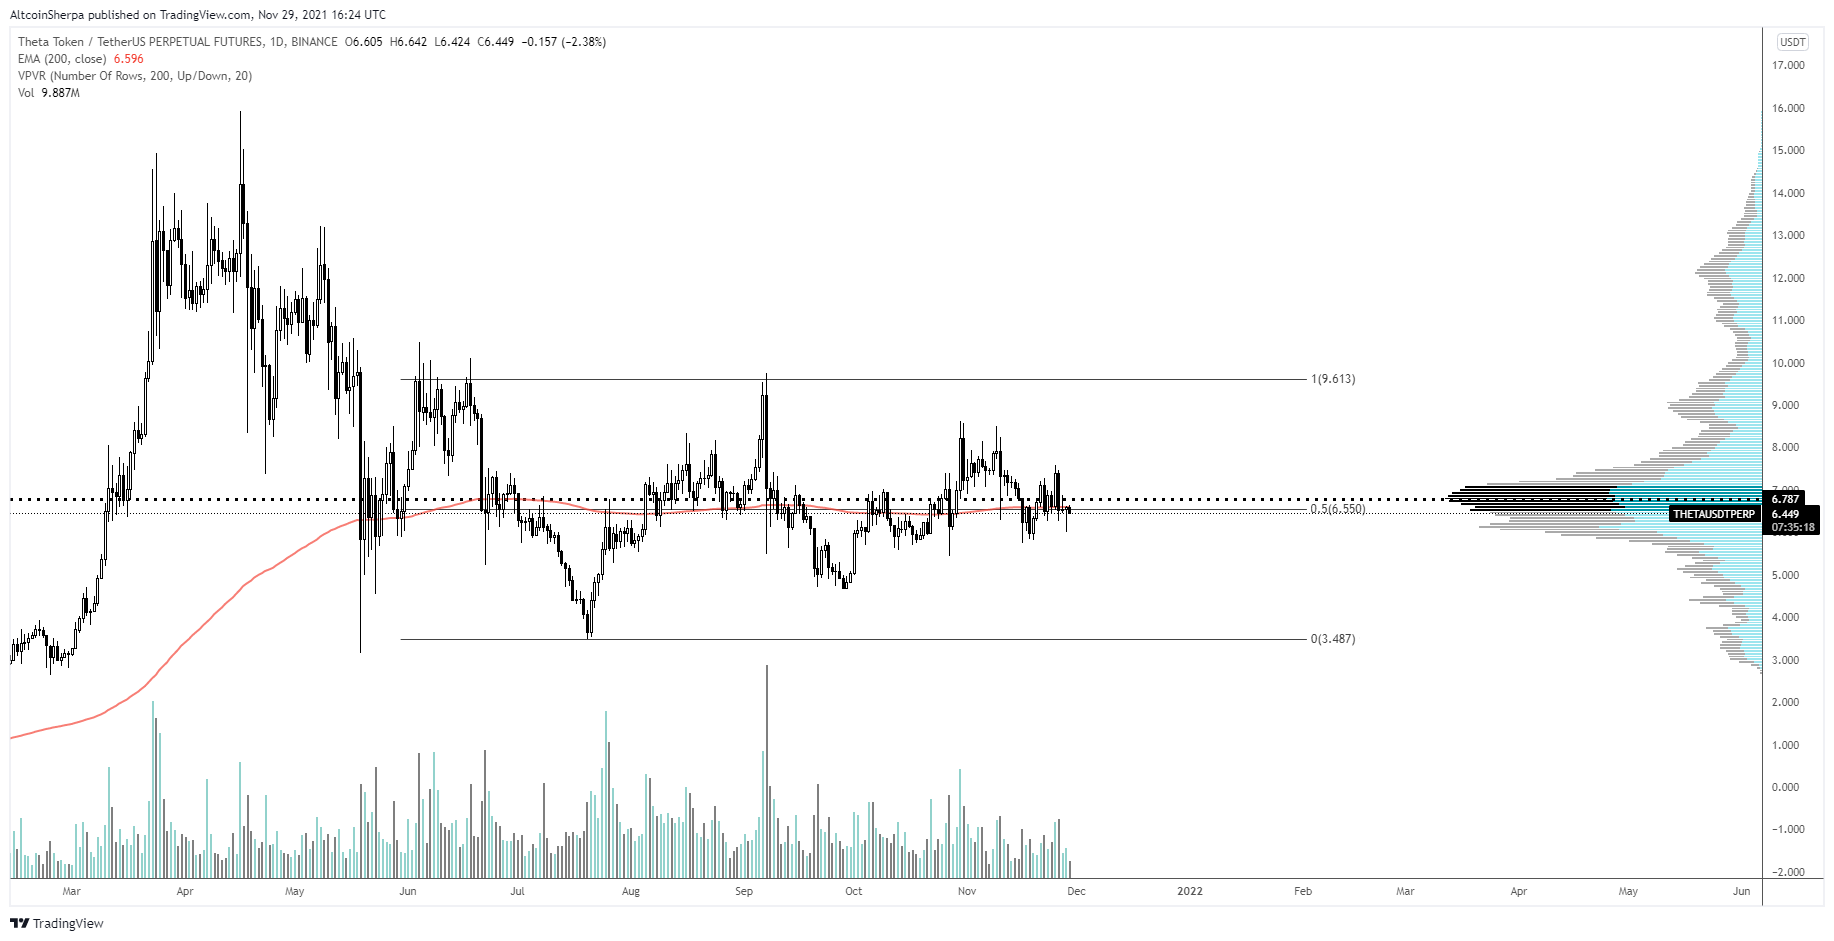
Cryptocurrency trader @AltcoinSherpa outlined a THETA chart, which shows the token trading inside a channel. Since the tweet, it has fallen to the support line of the channel and bounced.
Short-term movement
The shorter-term two-hour chart shows that THETA has already created a higher low (green icon) after the bounce.
Furthermore, the MACD and RSI are both showing bullish signs. Both are increasing, and the RSI has already moved above 50, even if the MACD is not yet positive.
However, there is strong resistance at $6.10, created by a horizontal area and the 0.618 Fib retracement resistance level. It also coincides with the middle of the long-term channel.
Until THETA manages to reclaim this area, the trend cannot be considered bullish.

For BeInCrypto’s latest Bitcoin (BTC) analysis, click here.


