
Theta Fuel (TFUEL) has been decreasing alongside a descending channel since reaching an all-time high price of $0.568 on March 24.
The price is currently attempting to reclaim the middle of the channel, which would be a very bullish development.
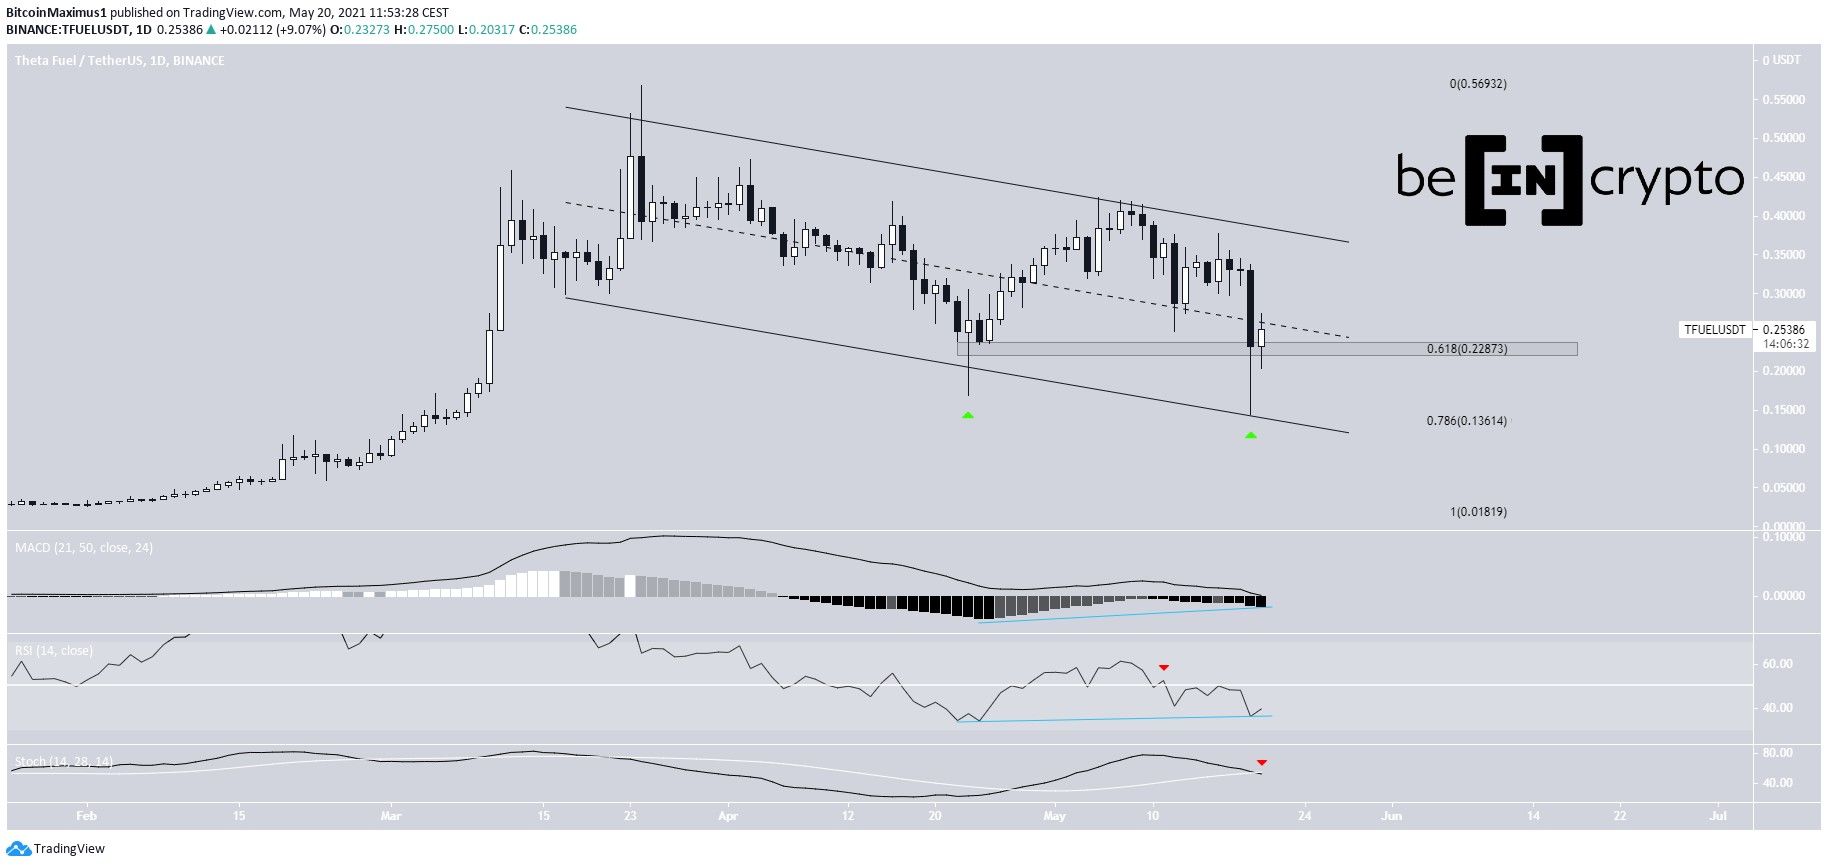
TFUEL corrects inside channel
TFUEL has been trading inside a descending channel since March 24 after reaching an all-time high price of $0.568. The decrease has been very gradual and choppy.
The token reached the support line of the channel twice, on April 23 and May 19 (green icons), creating long lower wicks each time. The second low coincides with the 0.786 Fib retracement support level.
Currently, TFUEL is trading just above the 0.618 Fib retracement support level at $0.228. This level coincides with the midline of the channel.
Reclaiming this level would be an extremely bullish development, indicating that a breakout from the channel is likely.
Technical indicators provide mixed readings. The MACD is decreasing and is in negative territory. Similarly, the RSI is below 50. However, both have generated bullish divergences.
Finally, the Stochastic oscillator has just made a bearish cross (red icon).
Despite the mixed reading, channels usually contain corrective trading structures. Furthermore, the price action has followed the channel perfectly so far.
Therefore, a breakout would be the most likely scenario.
Wave Count
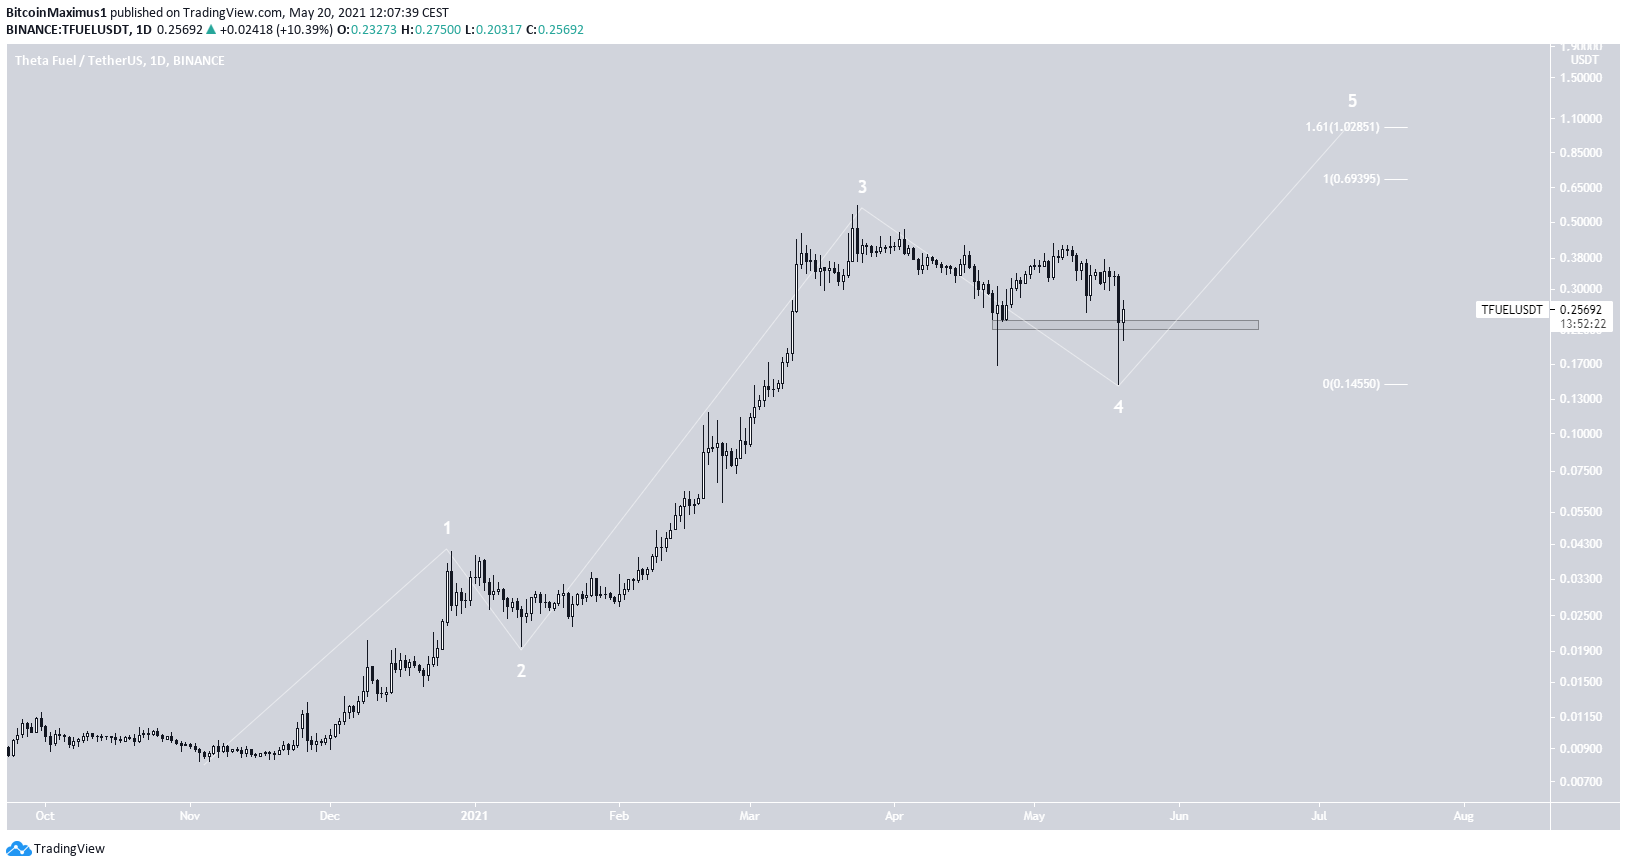
Cryptocurrency trader @24crypto outlined a wave count that indicates TFUEL has completed wave four of a bullish impulse (white). If correct, an explosive upward movement could follow.
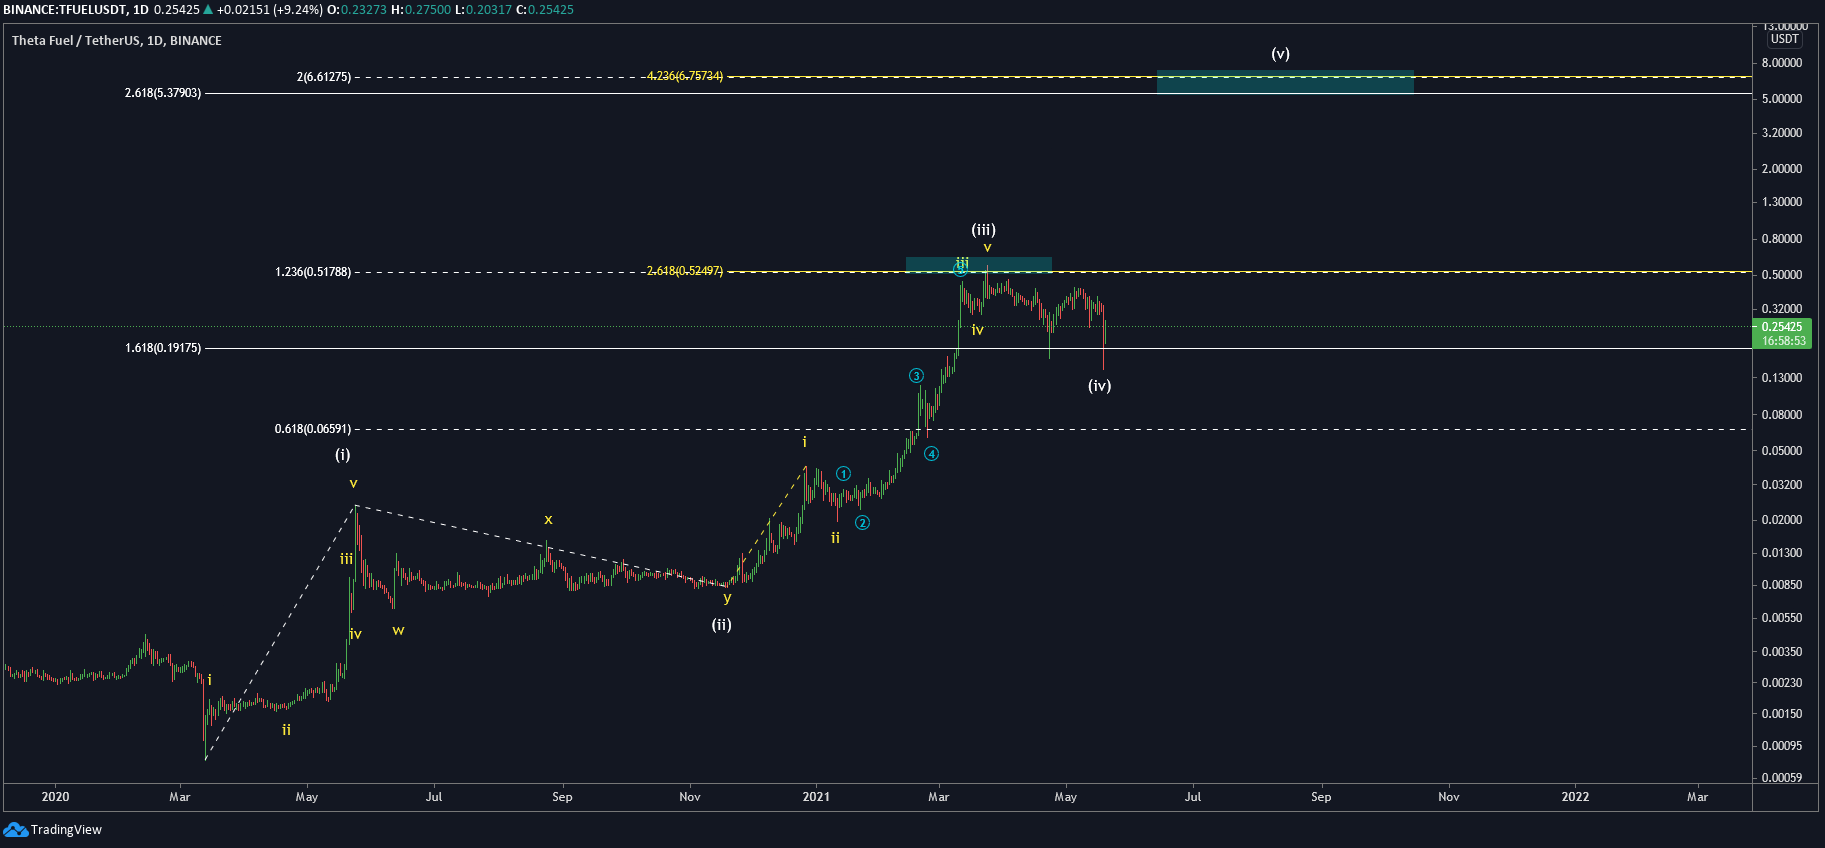
The presence of the channel indicates that this could very well be wave four of a bullish impulse. If so the two most likely targets for the top of wave five are found at $0.69 and $1.02.
These targets are found using a Fib projection on waves 1-3.
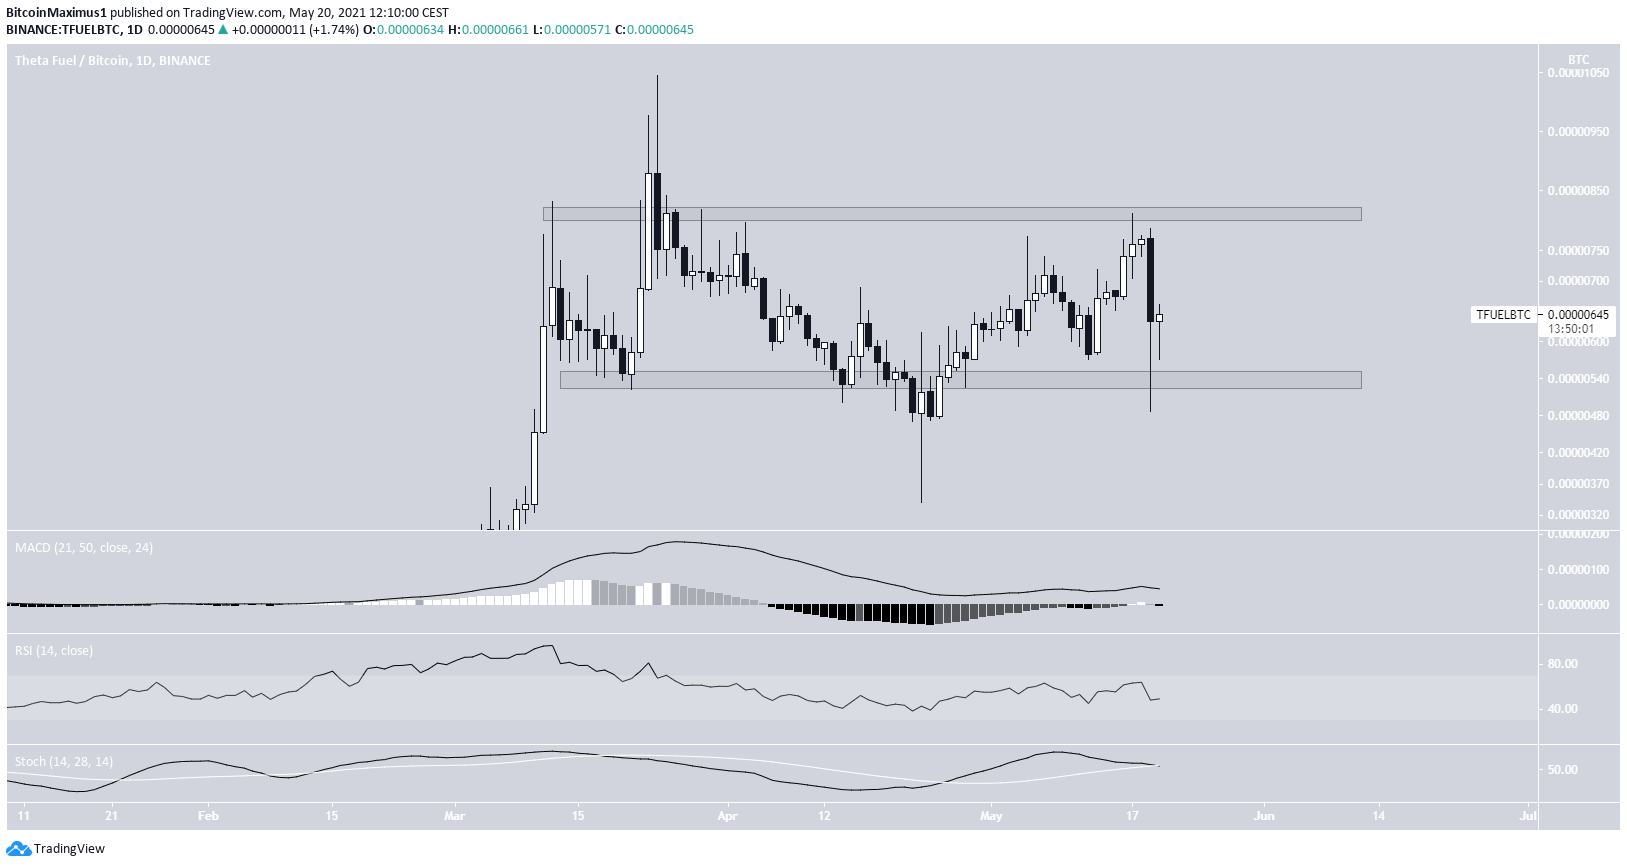
TFUEL/BTC
The trend for TFUEL/BTC is not as clear.
The price is trading in a range between 530 and 820 satoshis. In addition, technical indicators are neutral.
Therefore, a move outside of the range is required in order for the direction of the trend to be confirmed.
For BeInCrypto’s latest bitcoin (BTC) analysis, click here.
