


Theta Fuel (TFUEL) has been gradually moving upwards since June 12, finally accelerating its rate of increase and breaking out on July 16.
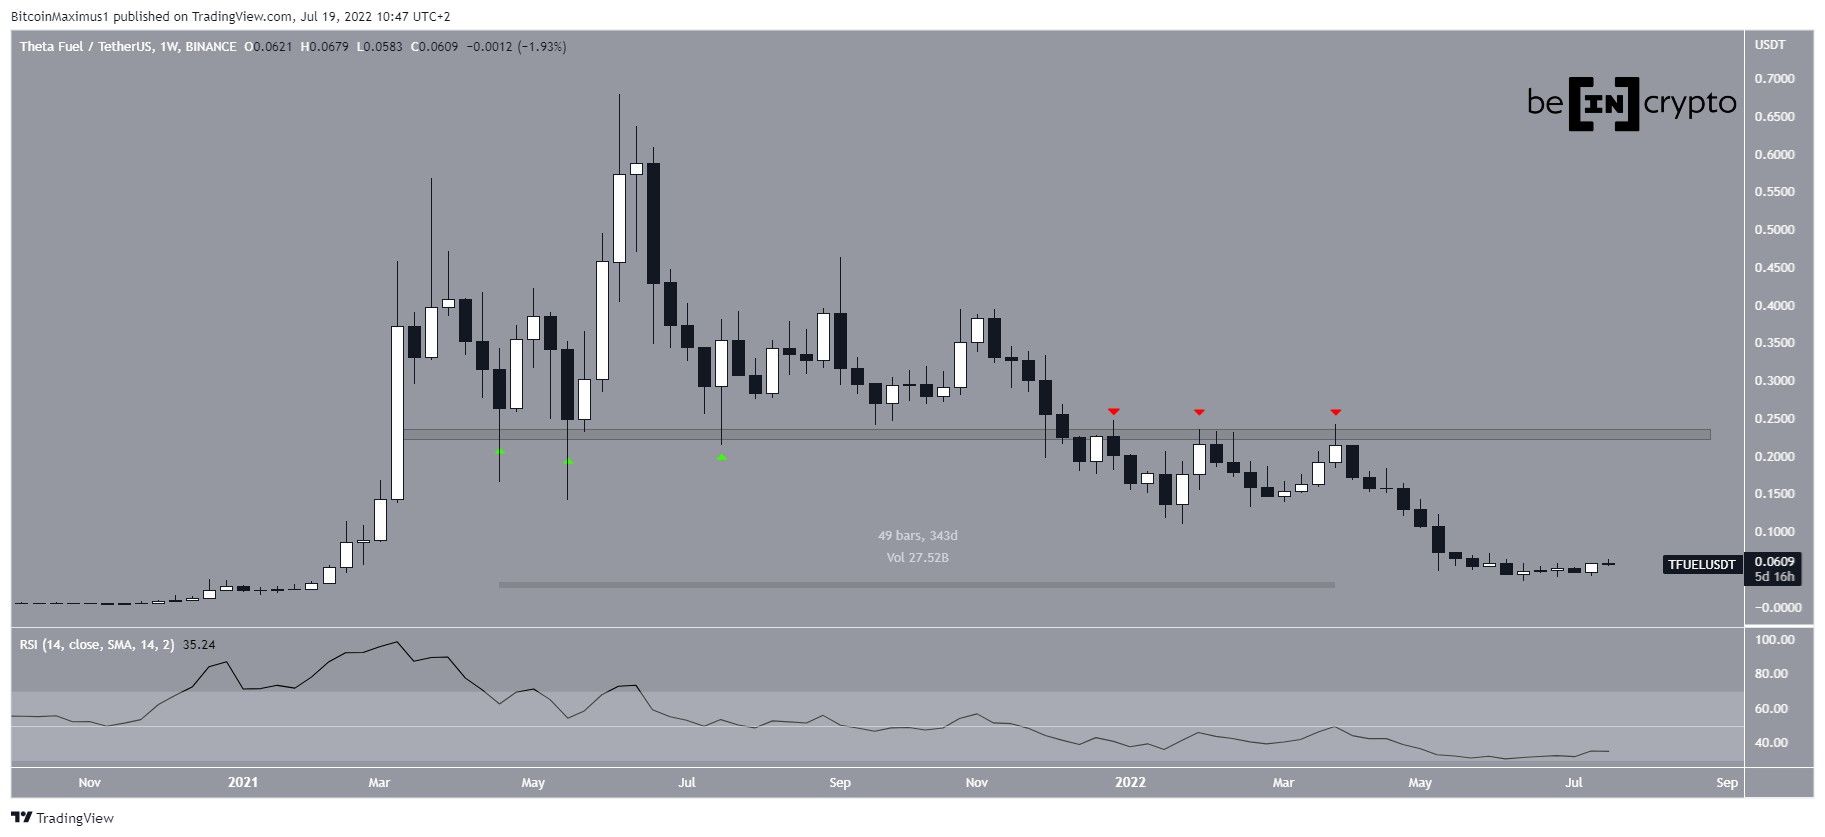
TFUEL has been falling since reaching a high of $0.68 in June 2021. At the beginning of Dec, the price broke down from the $0.23 horizontal area, which had acted as support thrice prior (green icons).
Afterward, the price validated the area as resistance three more times until April. So, at the time, the area had intermittently acted as support and resistance for 343 days. Therefore, until the price manages to reclaim it, the long-term trend cannot be considered bullish.
While the weekly RSI has begun to move upwards, it has not generated any sort of bullish divergence and is still below 50. As a result, the long-term trend is considered bearish.
Short-term reclaim
Cryptocurrency trader @Pure8Nature tweeted a chart of TFUEL, stating that the price could soon increase well above $5.
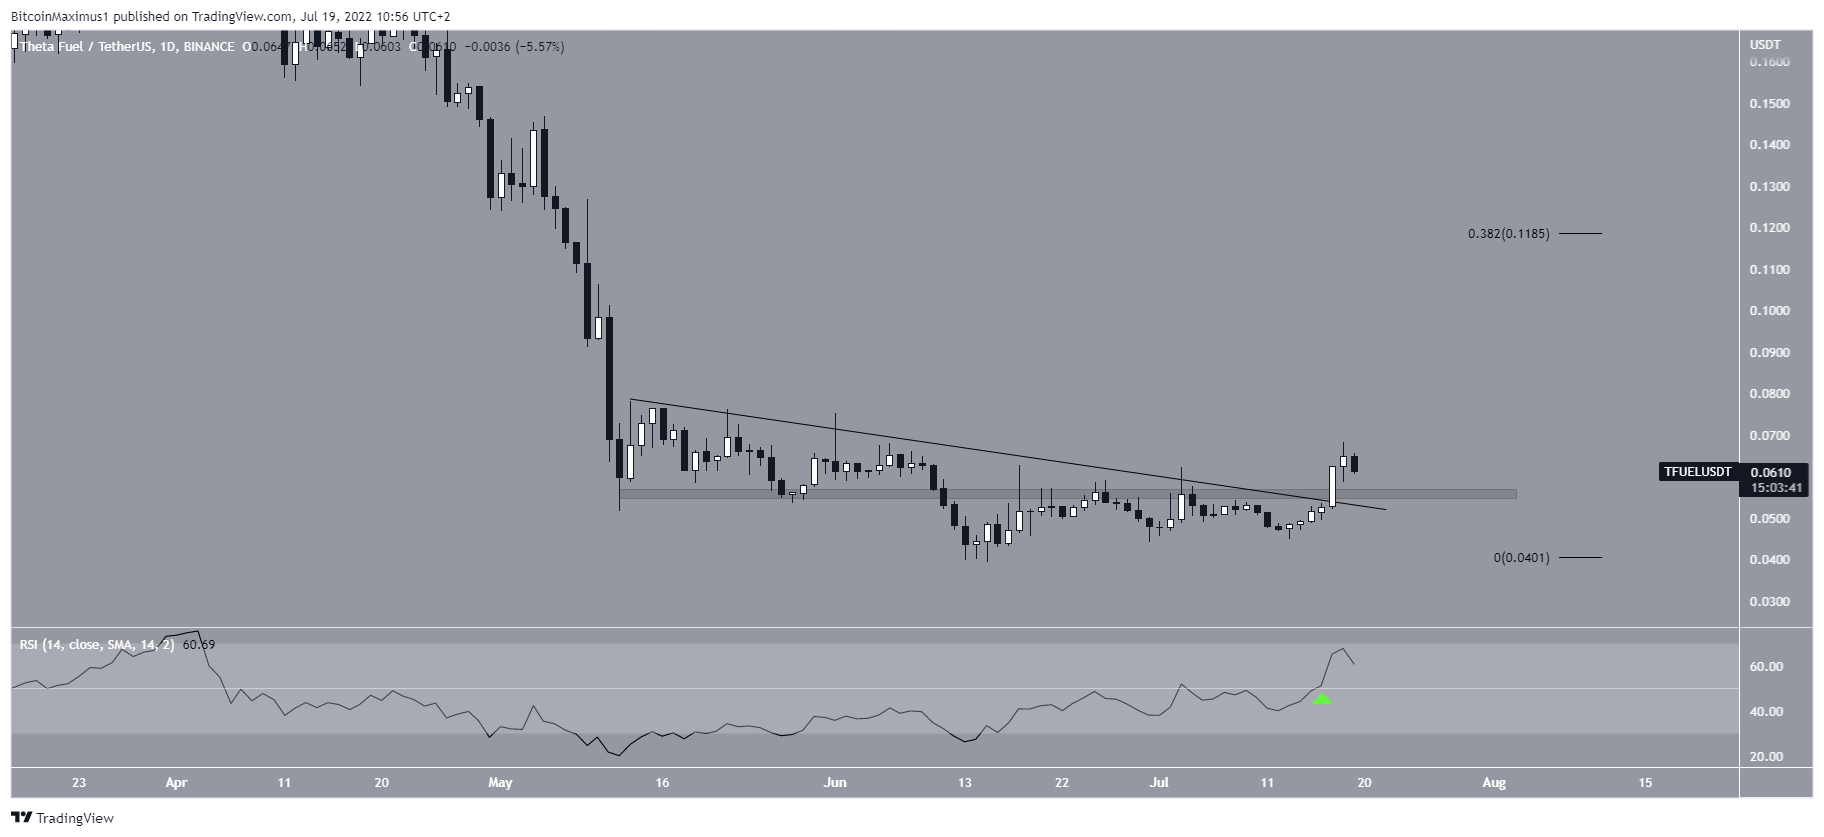
Despite the bearishness from the weekly time frame, the daily chart provides a more bullish outlook. There are two reasons for this:
- The price has broken out from a descending resistance line.
- The price has reclaimed the $0.056 horizontal support area.
Moreover, unlike the weekly one, the daily RSI has already broken out above 50 (green icon). So, while a re-test of the $0.056 area remains a possibility, the continuation of the upward movement seems to be the most likely scenario. In this case, the closest resistance area would be at $11.
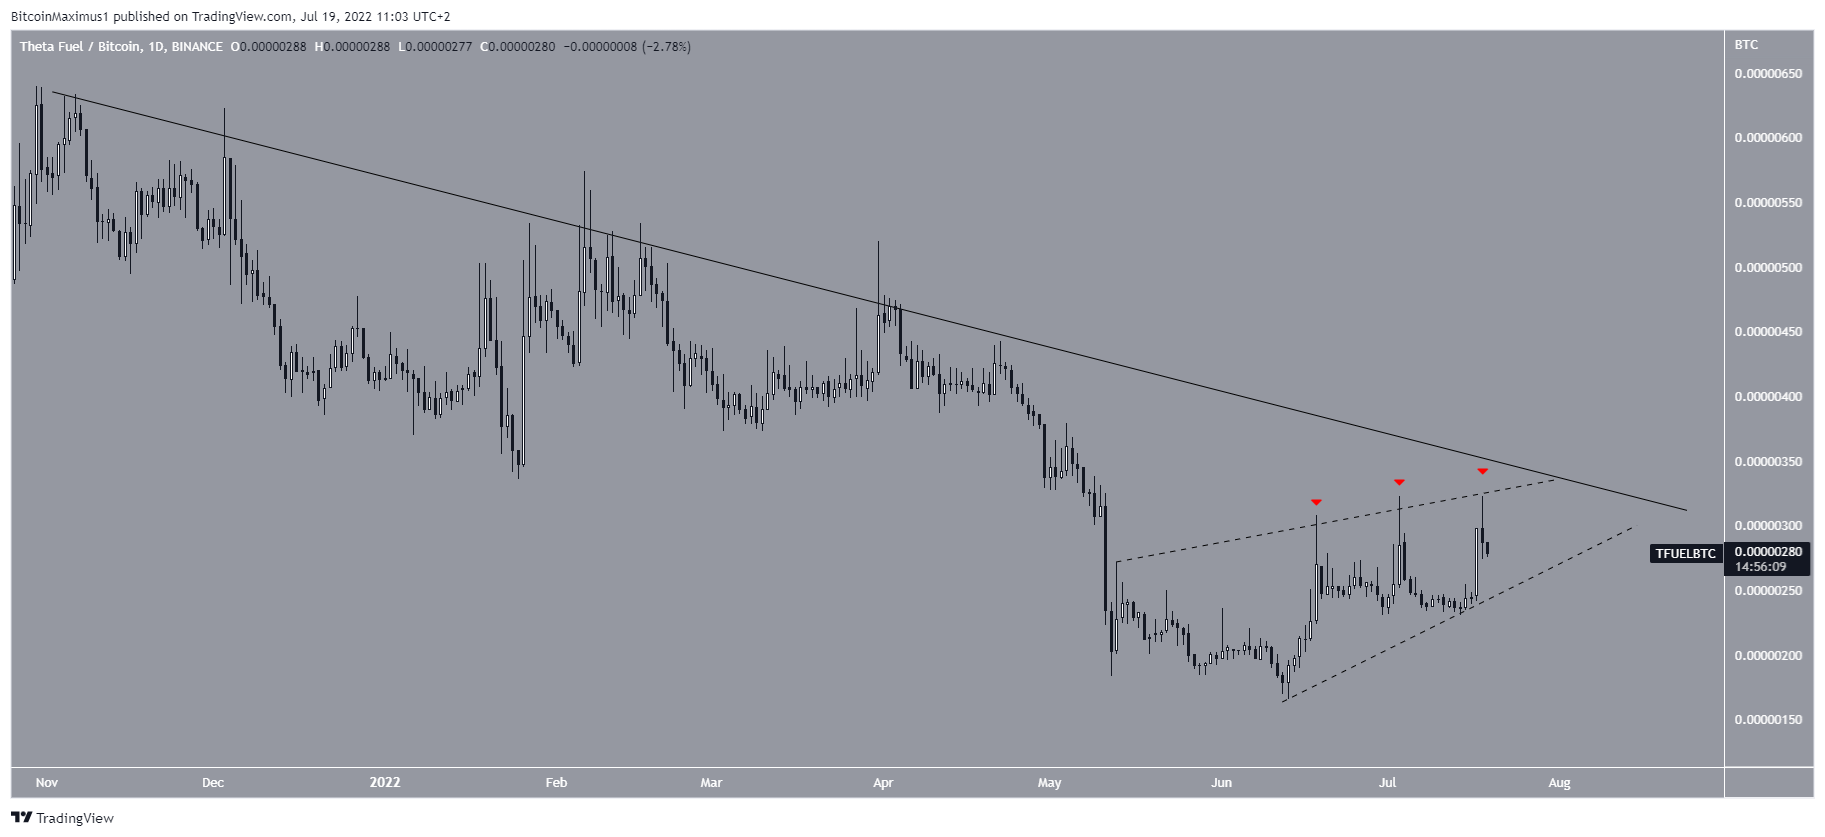
TFUEL/BTC
The TFUEL/BTC chart is not as bullish as its USD counterpart. While the price has been increasing since June, it seems to be trading inside an ascending wedge. Such wedges usually contain corrective patterns.
Additionally, the resistance line of the wedge has rejected the price thrice (red icons), creating long upper wicks each time. Such wicks are considered signs of selling pressure.
Finally, the price is following a longer-term descending resistance line, which also coincides with the wedge. So, until it manages to break out, the trend cannot be considered bullish.
For Be[in]Crypto’s latest Bitcoin (BTC) analysis, click here


