
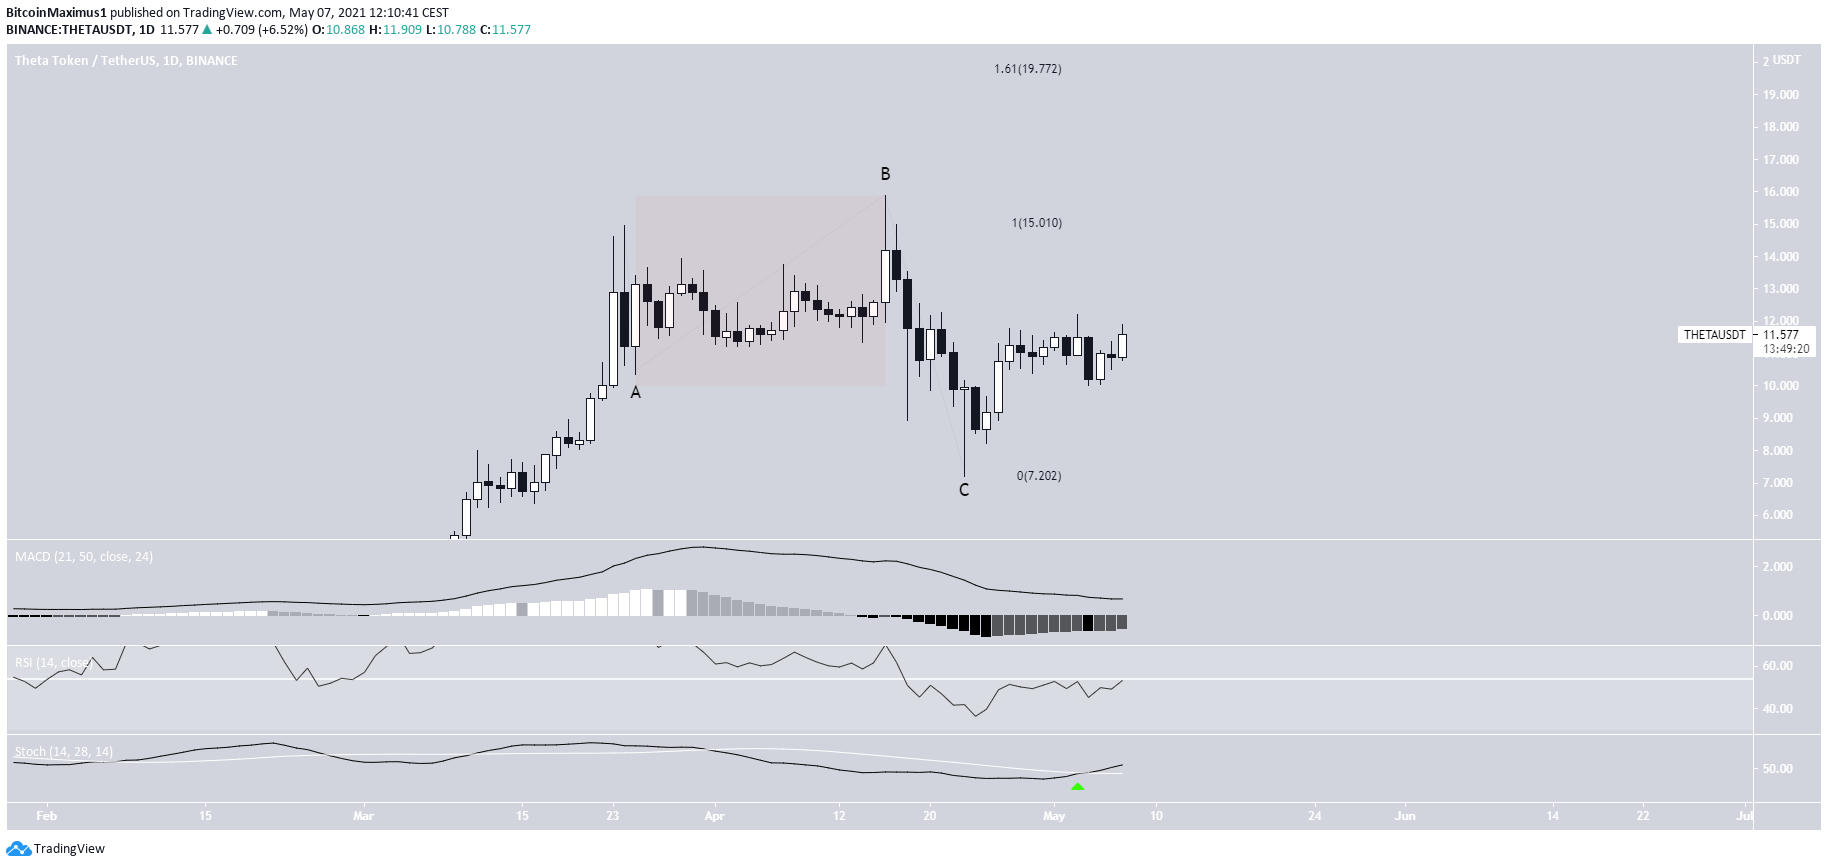
Theta Token (THETA) has been moving upwards since completing a flat correction on April 23.
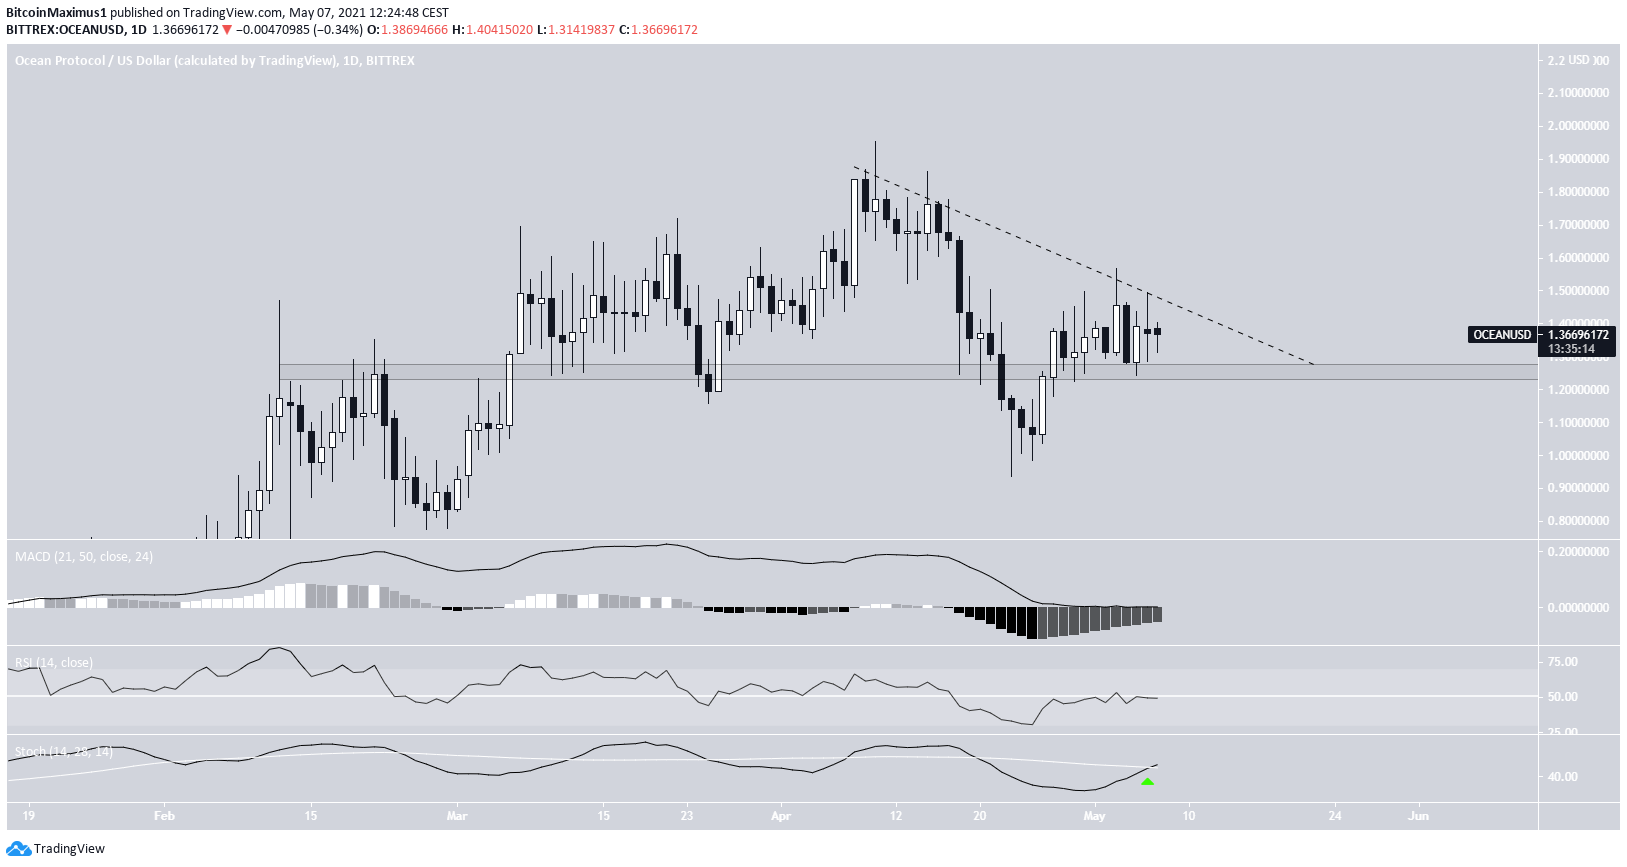
Ocean Protocol (OCEAN) has reclaimed the $1.25 area but is still following a descending resistance line.
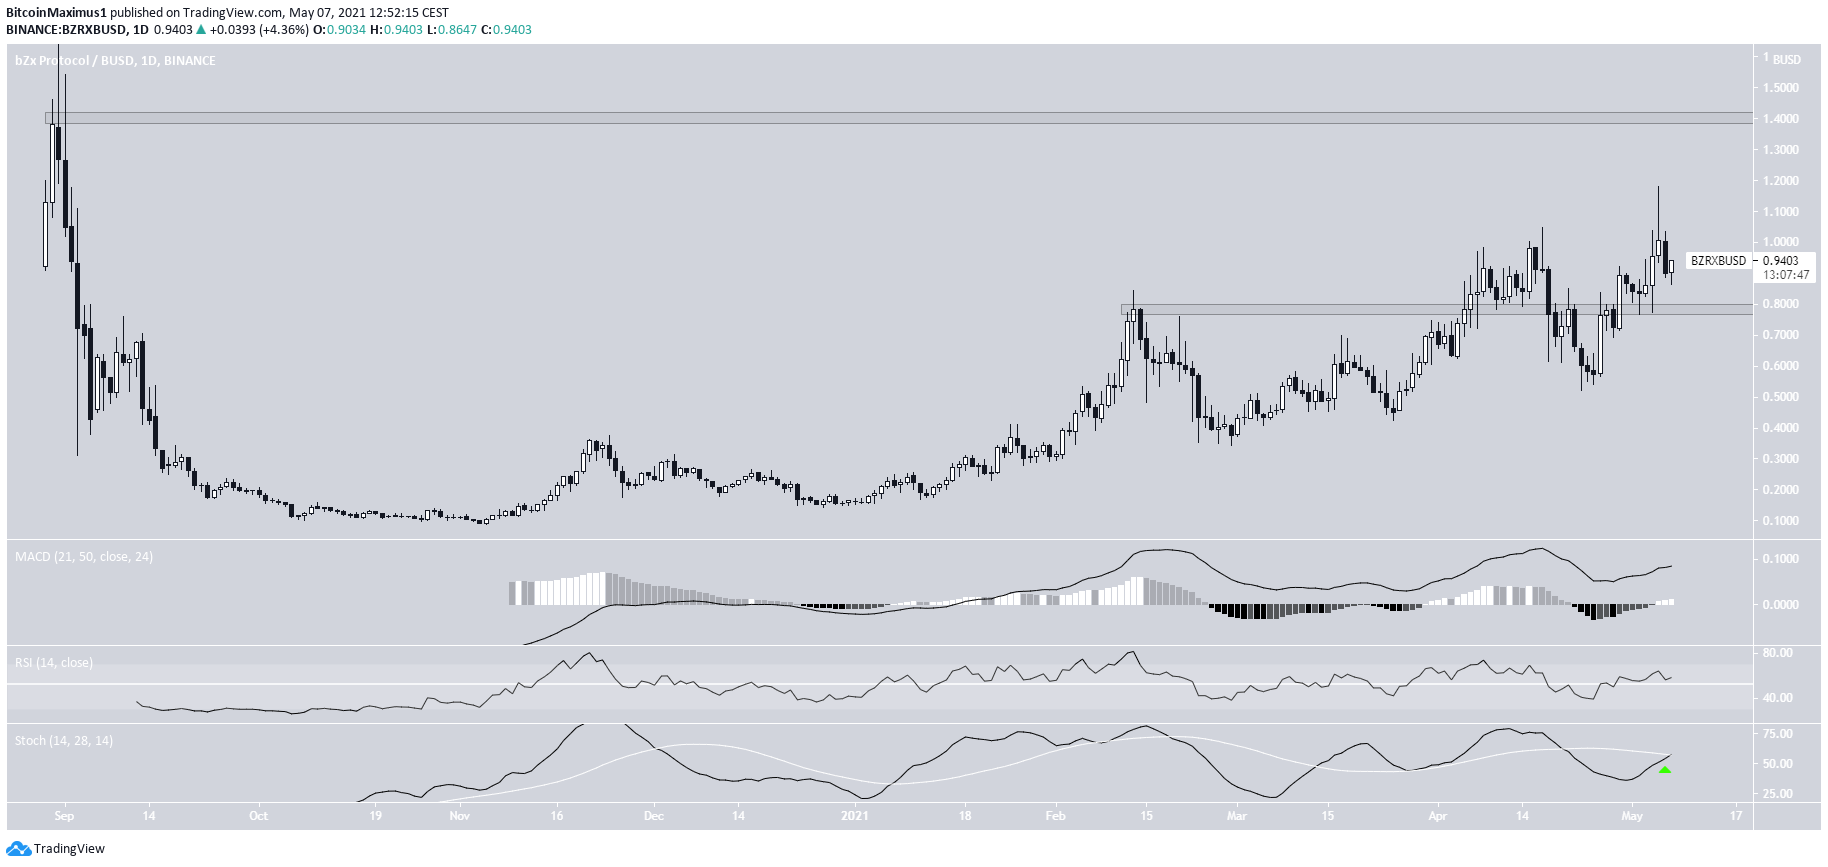
bZx Protocol (BZRX) has reclaimed the $0.78 are and looks primed for a significant increase.
THETA
THETA has been moving downwards since reaching an all-time high price of $15.88 on April 16. However, it bounced just after reaching a low of $7.20 on April 22.
Because the highlighted section of the chart does not look impulsive, it’s likely to be the B portion of an A-B-C corrective structure.
Technical indicators are bullish. This is especially evident by the bullish cross in the Stochastic oscillator (green). While the RSI has yet to cross above the 50-line, it’s expected to do so soon.
Therefore, THETA is likely to increase towards the closest resistance area at $15, and could potentially head to $19.70 after.
Highlights
- THETA has completed an A-B-C corrective structure.
- There are resistance levels at $15 and $19.70.
BZRX
BZRX has been moving upwards since April 23. Shortly after, it managed to reclaim the $0.78 area and validate it as support on May 2.
It has been moving upwards since.
Technical indicators are bullish. The MACD is positive, the RSI is above 50, and both are increasing. Furthermore, the Stochastic oscillator is very close to making a bullish cross.
Therefore, BZRX is likely to increase towards the next resistance area at $1.40.
Highlights
- BZRX has reclaimed the $0.78 area.
- There is resistance at $1.40.
OCEAN
OCEAN has been moving downwards since April 10 when it reached an all-time high price of $1.95. Since then, it’s been following a descending resistance line.
While it initially fell below the $1.25 area, OCEAN has reclaimed this level since. This is a bullish development that supports the possibility of a future breakout. If it does, OCEAN is likely to head towards the all-time high resistance of $1.80.
This is also supported by technical indicators since the MACD is positive and the Stochastic oscillator has made a bullish cross.
Highlights
- OCEAN has reclaimed the $1.25 resistance level.
- It\s following a descending resistance line.
For BeInCrypto’s latest bitcoin (BTC) analysis, click here.
