The EOS (EOS) price has broken down from an important support area. After a re-test and validation of it as resistance, it seems that it will head downwards.
On the other hand, the Stellar (XLM) price has reclaimed an important support area and looks poised to make another upward move.
EOS (EOS)
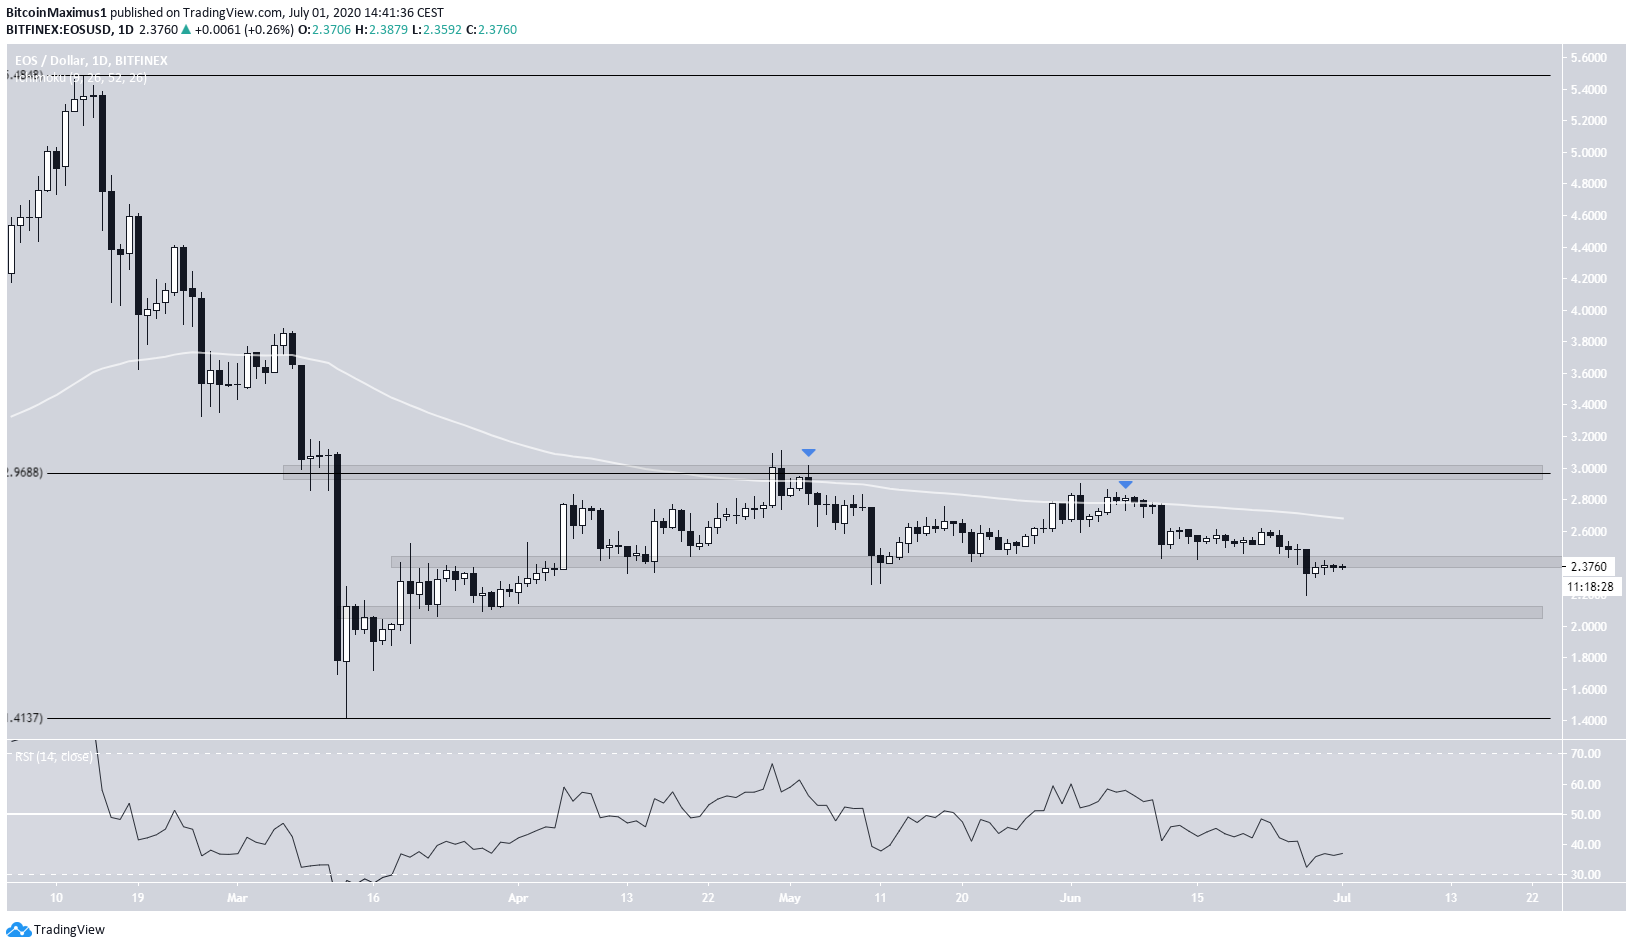
Since March 13, the EOS price has been retracing as a result of the rapid downward move that transpired exactly one month earlier. The retracement has been shallow since the price has failed to move above $3, the 0.382 Fib level of the entire decrease.
EOS has created one lower-high since then and is facing resistance from the 100-day MA.
At the time of writing, it had seemingly just fallen below the $2.45 support area. If it continues decreasing, the closest support area would be found at $2.10.
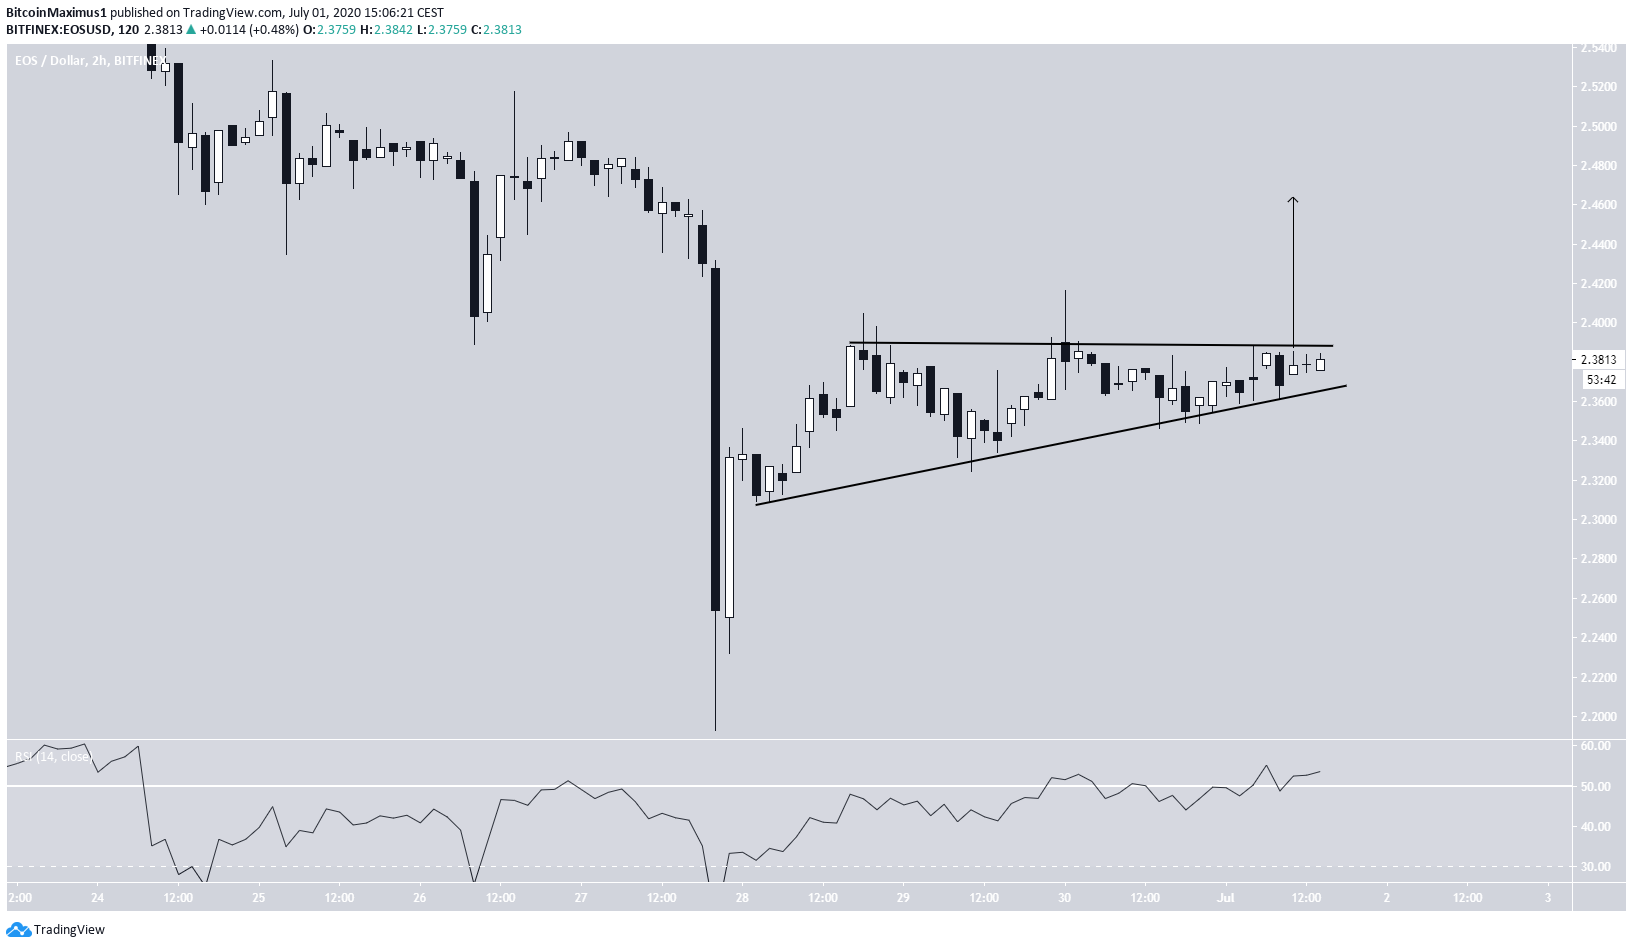
However, the short-term chart looks bullish, since EOS is trading inside an ascending triangle. This is a bullish pattern, which suggests that the price will break out, especially since it is transpiring after an upward move.
Furthermore, the RSI is showing strength by moving above 50.
This move could take the price towards the support area it just broke down from at $2.45, before EOS resumes its downward movement.
Stellar (XLM)
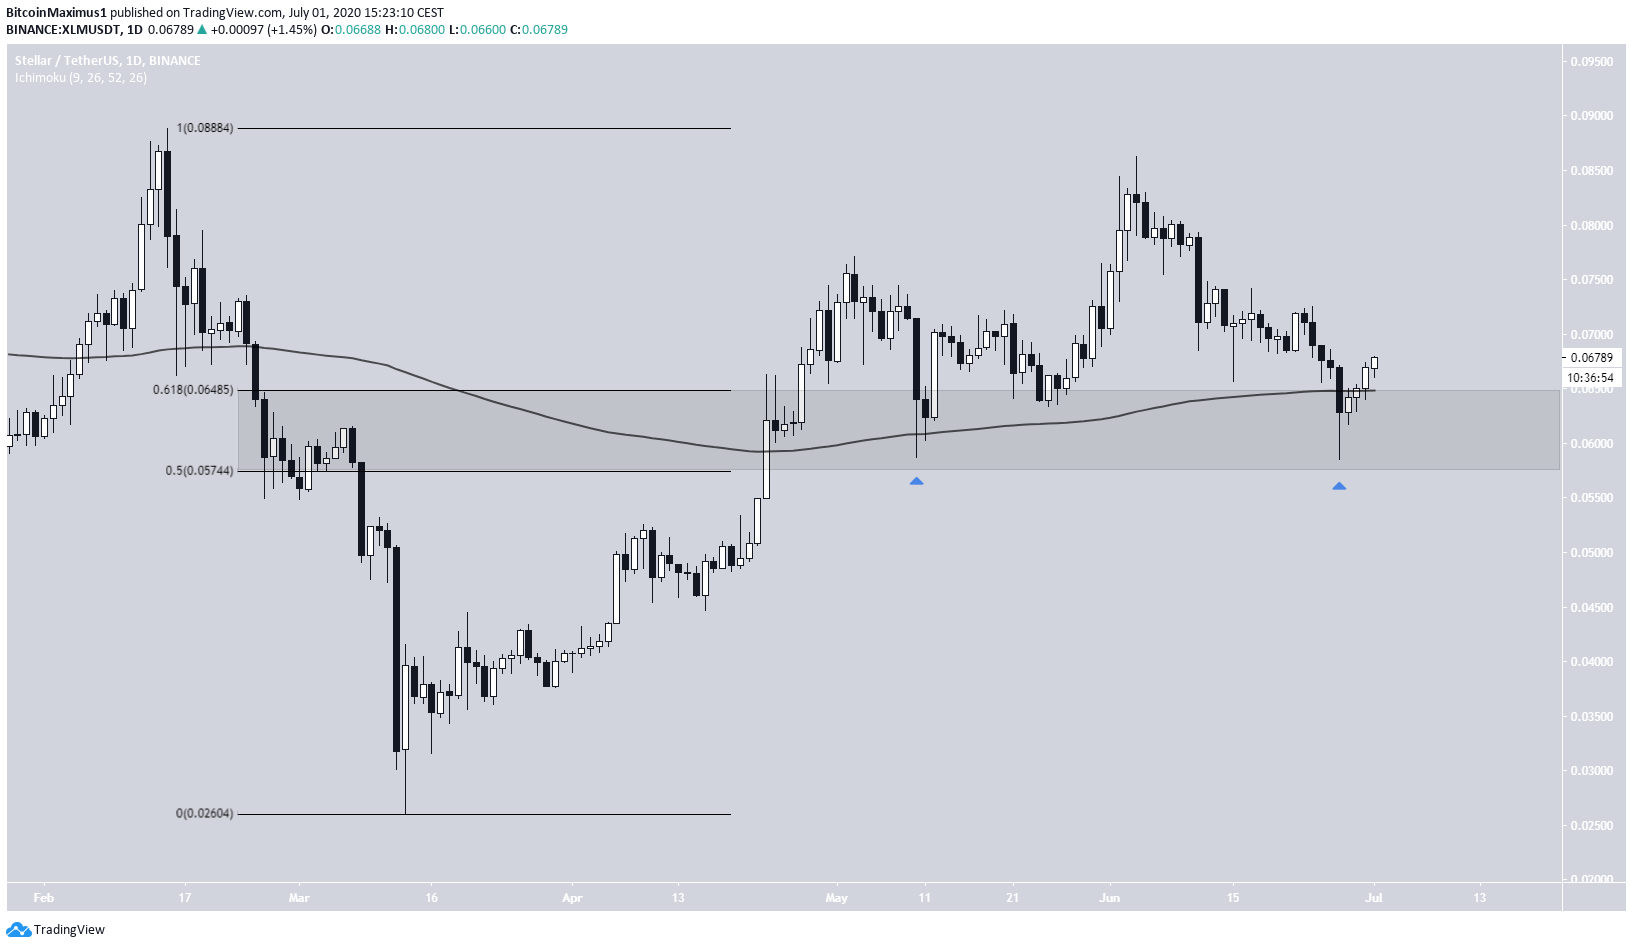
A look at the daily chart for XLM shows a very pronounced difference in the retracement in regards to the previous drop, relative to EOS.
The price began an upward move on March 13. On June 4, it almost reached the previous high prior to the rapid February decrease, nearly completing a full retracement.
Cryptocurrency trader @Glowto1994 gave a bullish chart for XLM, which suggests the price will increase towards $0.12.
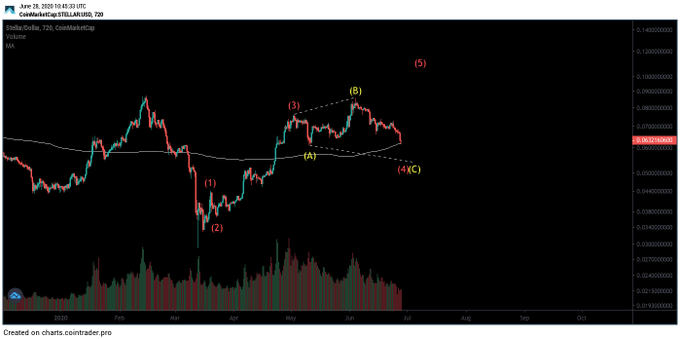
While this is certainly possible, especially with the wave count given, a rapid BTC price decrease could cause the same in XLM. Therefore, BTC has to remain stable for at least the next two weeks for this target to be reached.
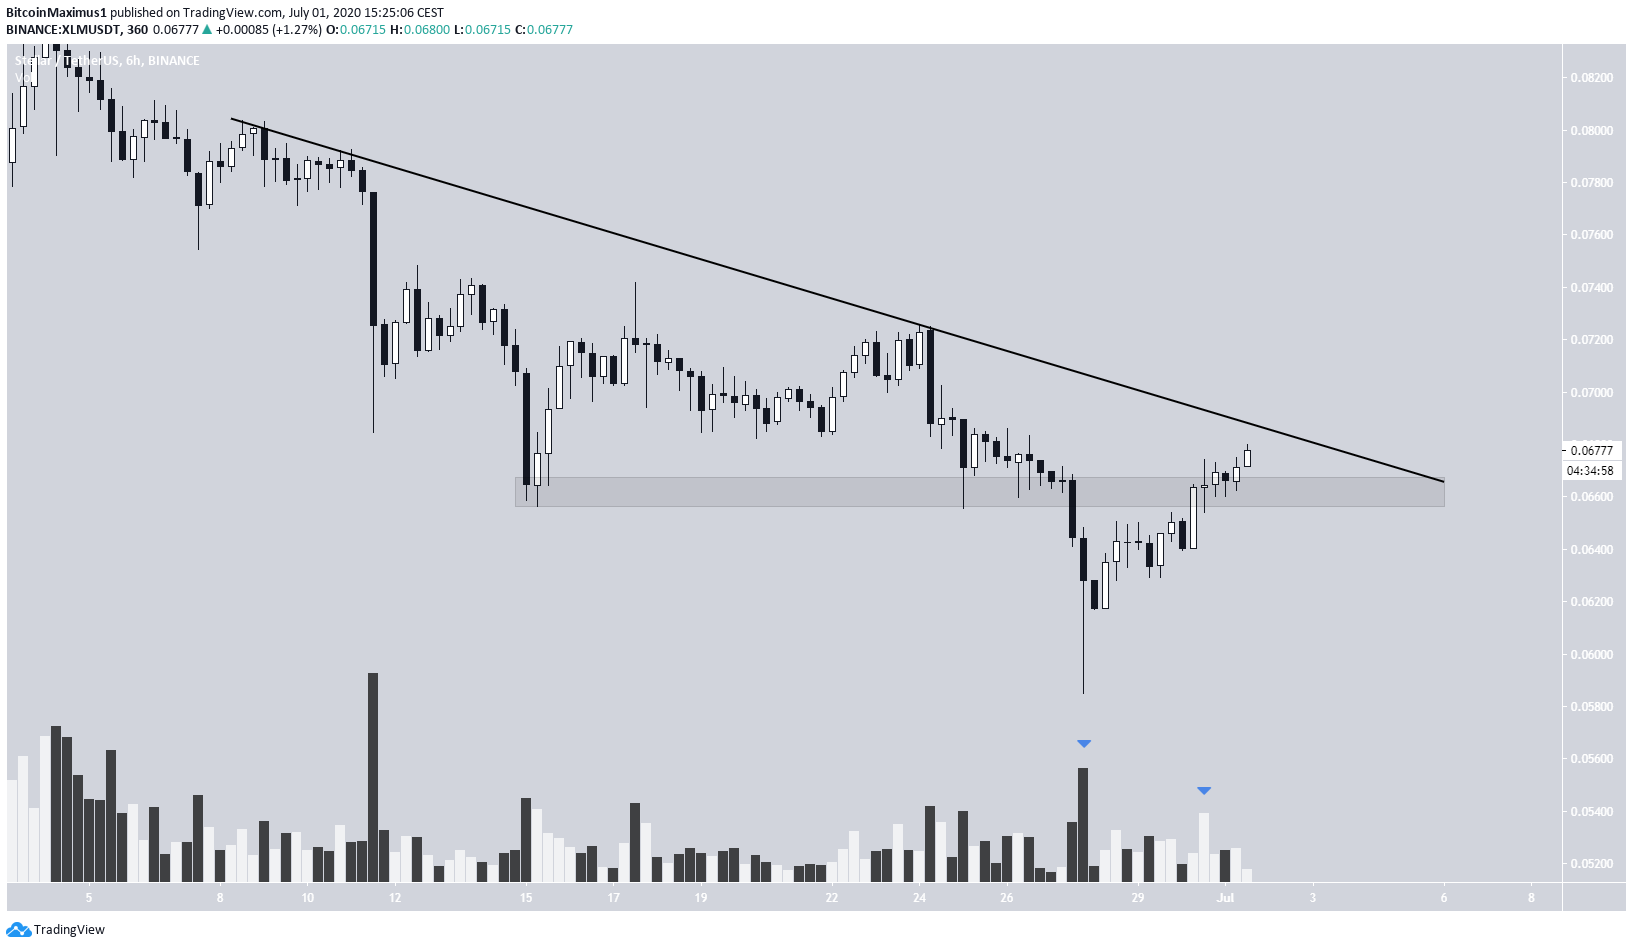
The short-term movement aligns with the bullish outlook. After initially breaking down, the price has reclaimed the minor $0.066 area which is now likely to act as support. Furthermore, there have been two spikes in volume, during the long lower-wick of June 27 and bullish engulfing candlestick on June 30.
If the price breaks out from the current descending resistance line, it would be expected to move towards the recent highs at $0.075 and $0.085.