
The COS price has broken out from a long-term descending resistance line after generating bullish divergence in the RSI. After generating bullish divergence, BCH is trading right at its long-term resistance line but has yet to break out.
BeInCrypto takes a look at both to try and figure out where they are going next.
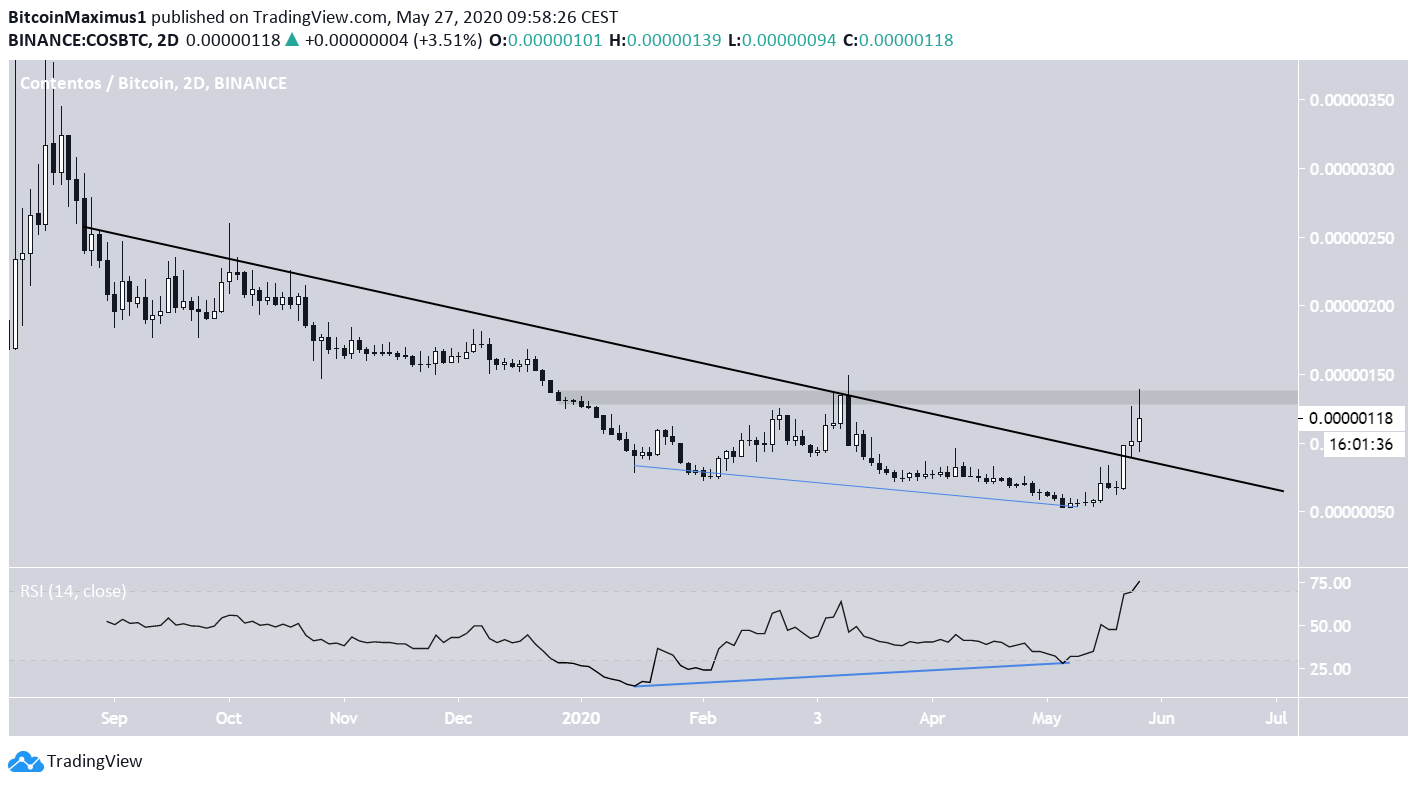
Contentos (COS)
The COS price has broken out from a long-term descending resistance line that had previously been in place since September 2019. The breakout was preceded by a very strong bullish divergence in the weekly RSI, increasing its significance.
However, after breaking out, the price met resistance at 135 satoshis and created a long upper-wick. This could mean that the price is likely to decrease and validate the line it just broke out from. This is a common movement after breakouts.
In order to determine that, a look at a shorter-term time-frame is required.
In the short-term, the price has broken out from a symmetrical triangle and validated the previous resistance area as support. The chart below was outlined by @Cryptoboss1984, who stated that the price will likely continue to move upwards from here.

However, it looks as if the price is trading inside an ascending wedge, which is considered a bearish reversal pattern. Furthermore, there is bearish divergence developing. Therefore, while the price could continue to increase inside this wedge, it is expected to eventually break down and head towards the 100 satoshi support area.

Bitcoin Cash (BCH)
One other coin that has, or is in the process of breaking out from a long-term descending resistance line is BCH, which has had a strong descending resistance in play since February. However, the price is still struggling to reclaim the ₿0.026 area, which previously acted as support since July 2019.
However, the price has seemingly created a double-bottom, which is also combined with a bullish divergence in the RSI.
A breakout above this descending resistance line and the previous support area would indicate that the price is bullish and is likely to move towards ₿0.034.

In the short-term, BCH has been following an ascending support line, and has flipped the short-term resistance level at ₿0.027 as support. Therefore, the price is likely to continue moving upwards as per the outline given in the first image.

