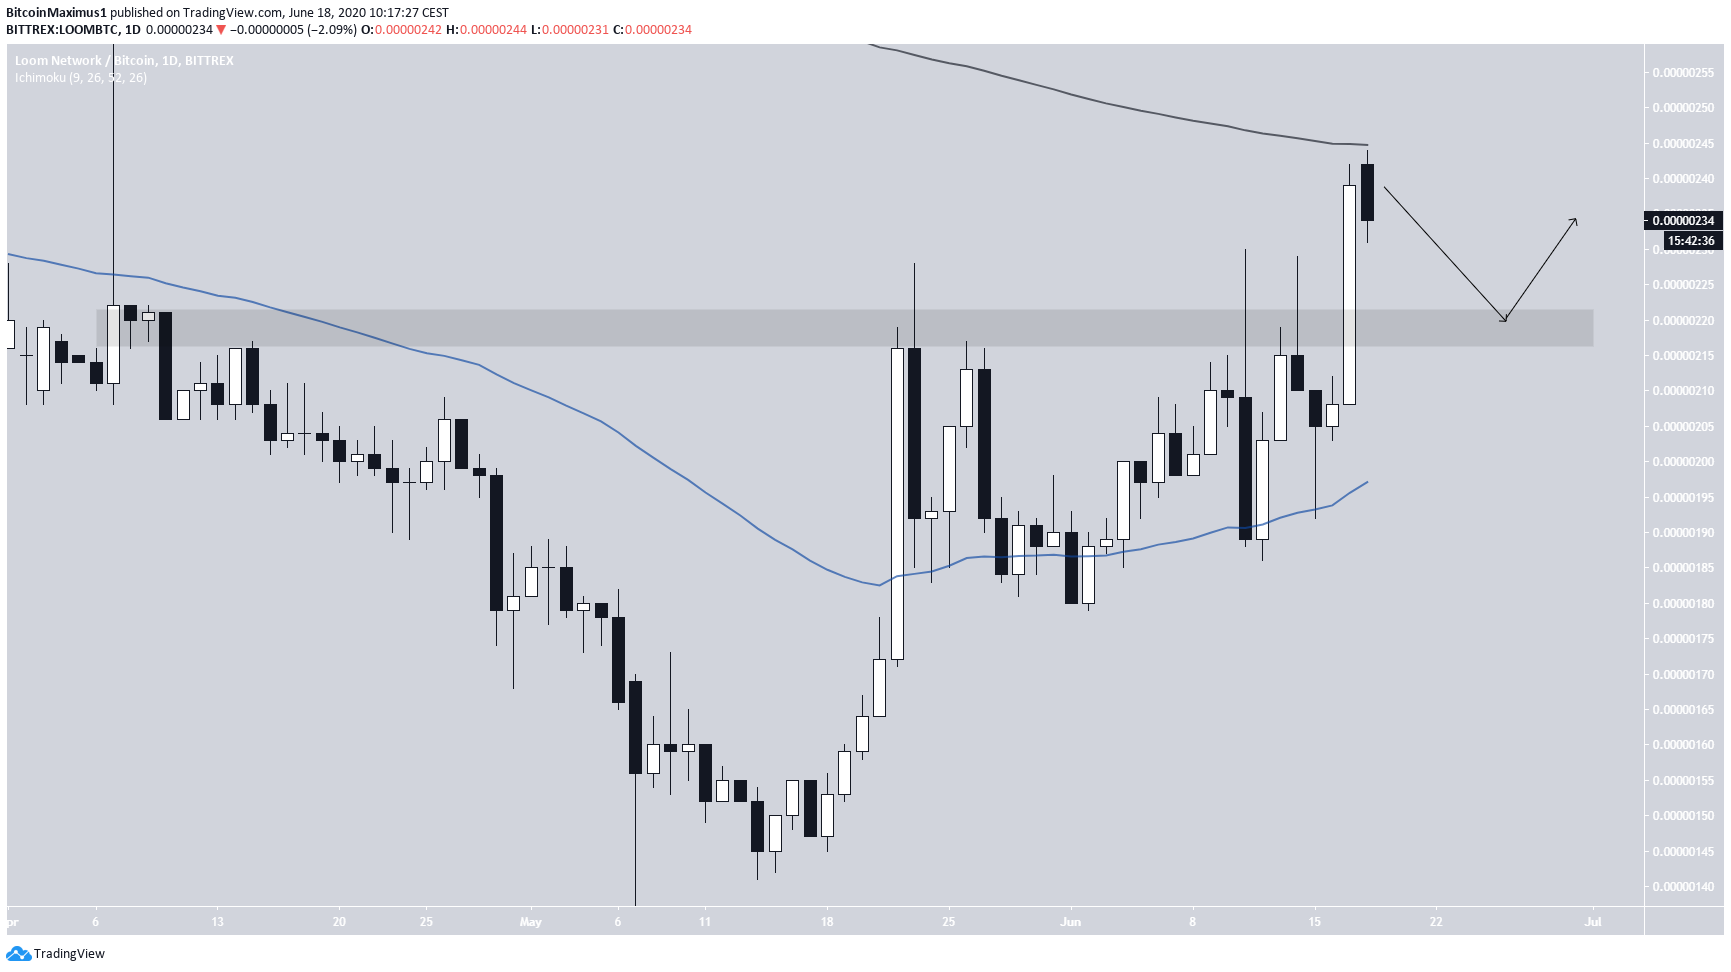
After showing strong signs of a long-term reversal, the LOOM price has broken out from a major resistance. This could be the first step of a more significant move upwards.
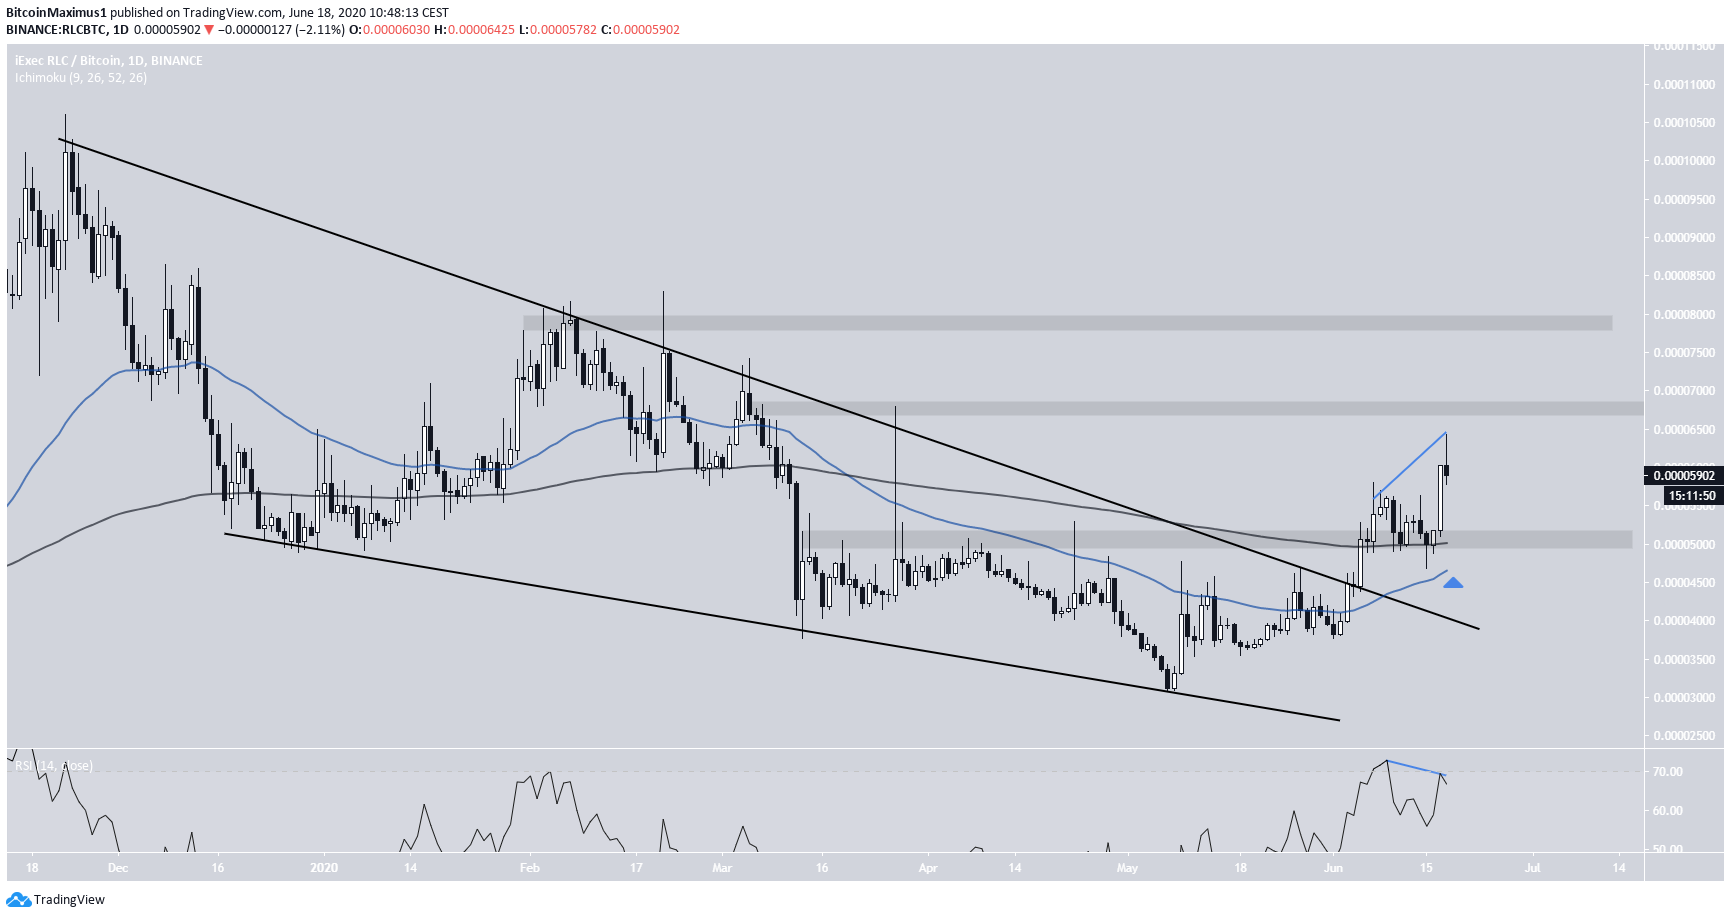
RLC has already broken out from a long-term descending wedge and has begun to move upwards.
Loom Network (LOOM)
The daily chart for LOOM shows that the price has broken out above the 220 satoshi area, which had previously acted as resistance. The price did so by creating a bullish engulfing candlestick.
However, LOOM was rejected by the 200-day moving average on June 18 and has been falling. The most likely move would be a re-test of this 220 satoshi area, followed by a bounce. The 50-day MA, which previously offered support, is gradually moving upwards and will soon coincide with the 220 satoshi support.
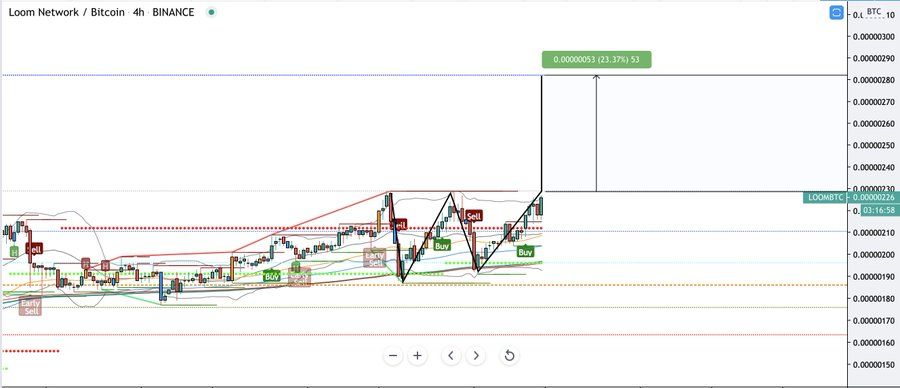
Well-known trader @CryptoNewton explains that LOOM is very close to breaking out, and he gave a target of 281 satoshis, 23.5% above the current price.
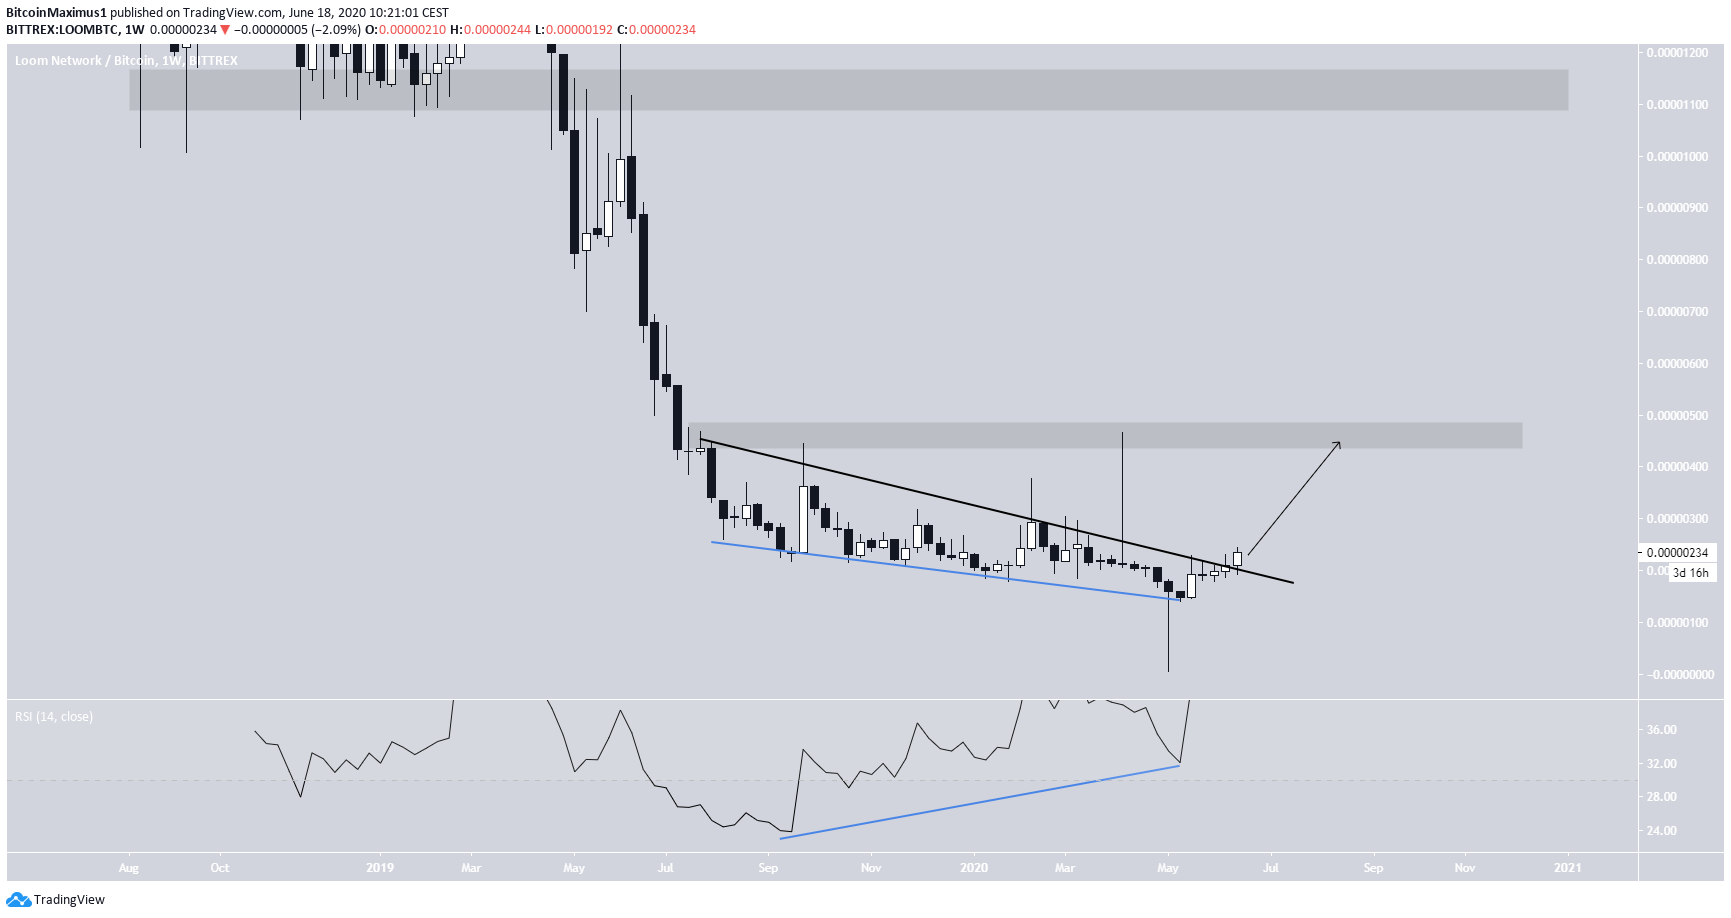
However, when looking at the long-term chart, we can see two resistance areas much further from the price, but likely in range. They are found at 470 and 1150 satoshis, respectively.
The weekly RSI has been generating bullish divergence since September 2019, a sign of a long-term trend reversal. Furthermore, the price has possibly moved above a descending resistance line.
Therefore, it is likely that LOOM has already begun a long-term upward trend since both the daily and weekly time-frames are in alignment.
iExec RLC (RLC)
The RLC price has been trading inside a descending wedge since November 2019. However, the price broke out on June 1 and has been increasing since.
The movement also constituted a breakout above the 200-day MA, which is currently trading at the 5100 satoshi support area. Furthermore, a golden cross is about to take place on the daily time-frame.
However, the daily RSI has generated considerable bearish divergence, so a re-test of this support area followed by an upward move to the next resistance levels at 6800 and 8000 satoshis would be the most likely scenario.