
On March 12, the BTC price broke down below a significant support area found at $0.15. After nearly a week of consolidating below support, it was finally successful in reclaiming it on March 19.
Technical analyst and trader @Mesawine1 tweeted an XRP chart and outlined a very important support area found at $0.15. He believes that it is mandatory that the price reclaims it if it wants to continue moving upward in the near future. If not, we could see prices as low as $0.025.
$xrp update:
jaiks 😱 #xrp!!
Need to climb back over the ridge cause, damn, that's a big drop on the other side.#xrparmy assemble!!#crypto $alts #Ripple pic.twitter.com/f4oqMDh24W
— Cryptotoad (@Mesawine1) March 18, 2020
Let’s take a closer look at the XRP price movement and determine where it is heading to next.
Support Area
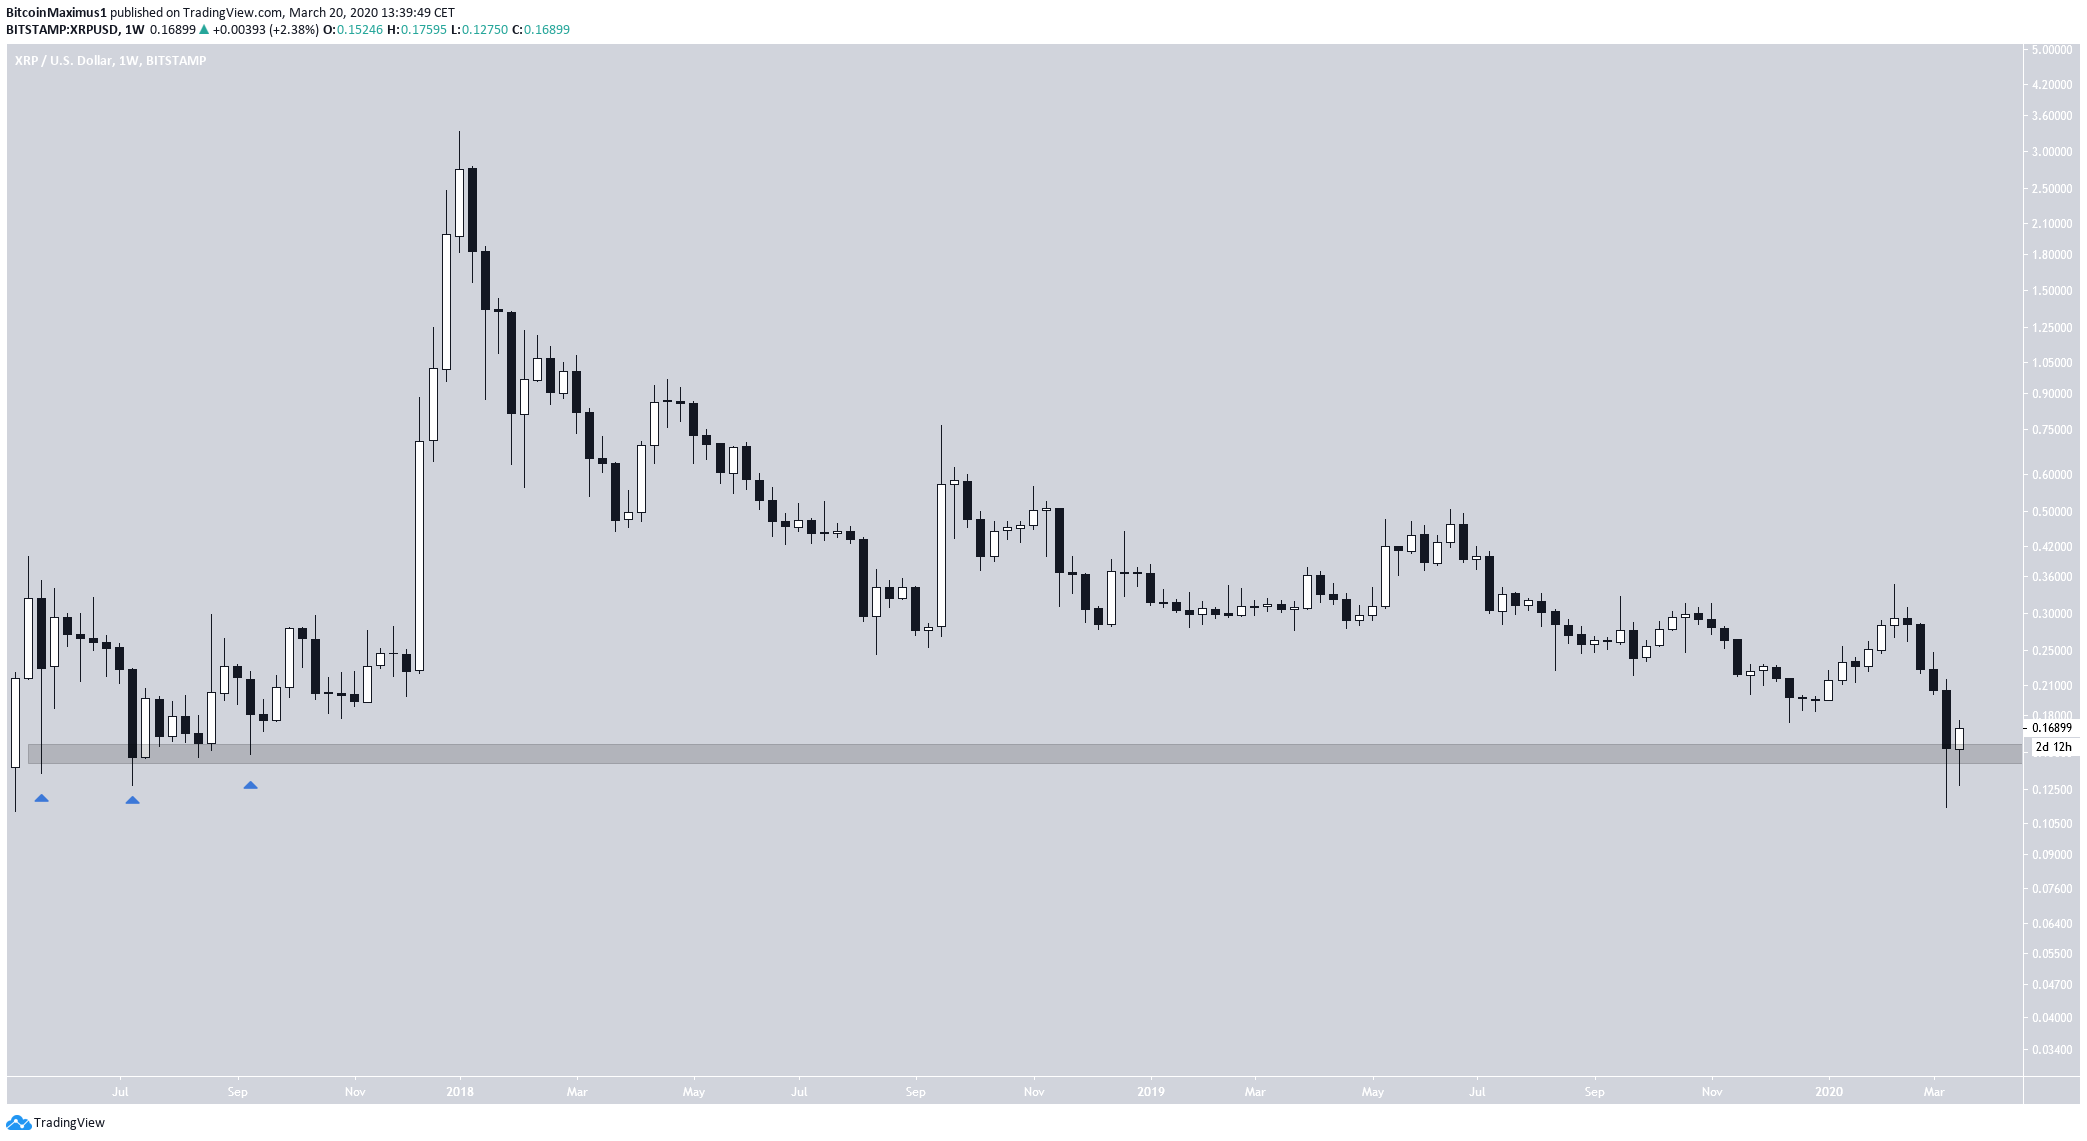
Since the tweet, the price has actually moved above the outlined support area, which is found at $0.15.
The area holds tremendous importance since it provided support for the majority of 2017 and afterward was the catalyst of the upward move that eventually led to the all-time high.
In addition, there is a serious lack of support below this level, so if it is broken, the price could rapidly decrease below $0.1.
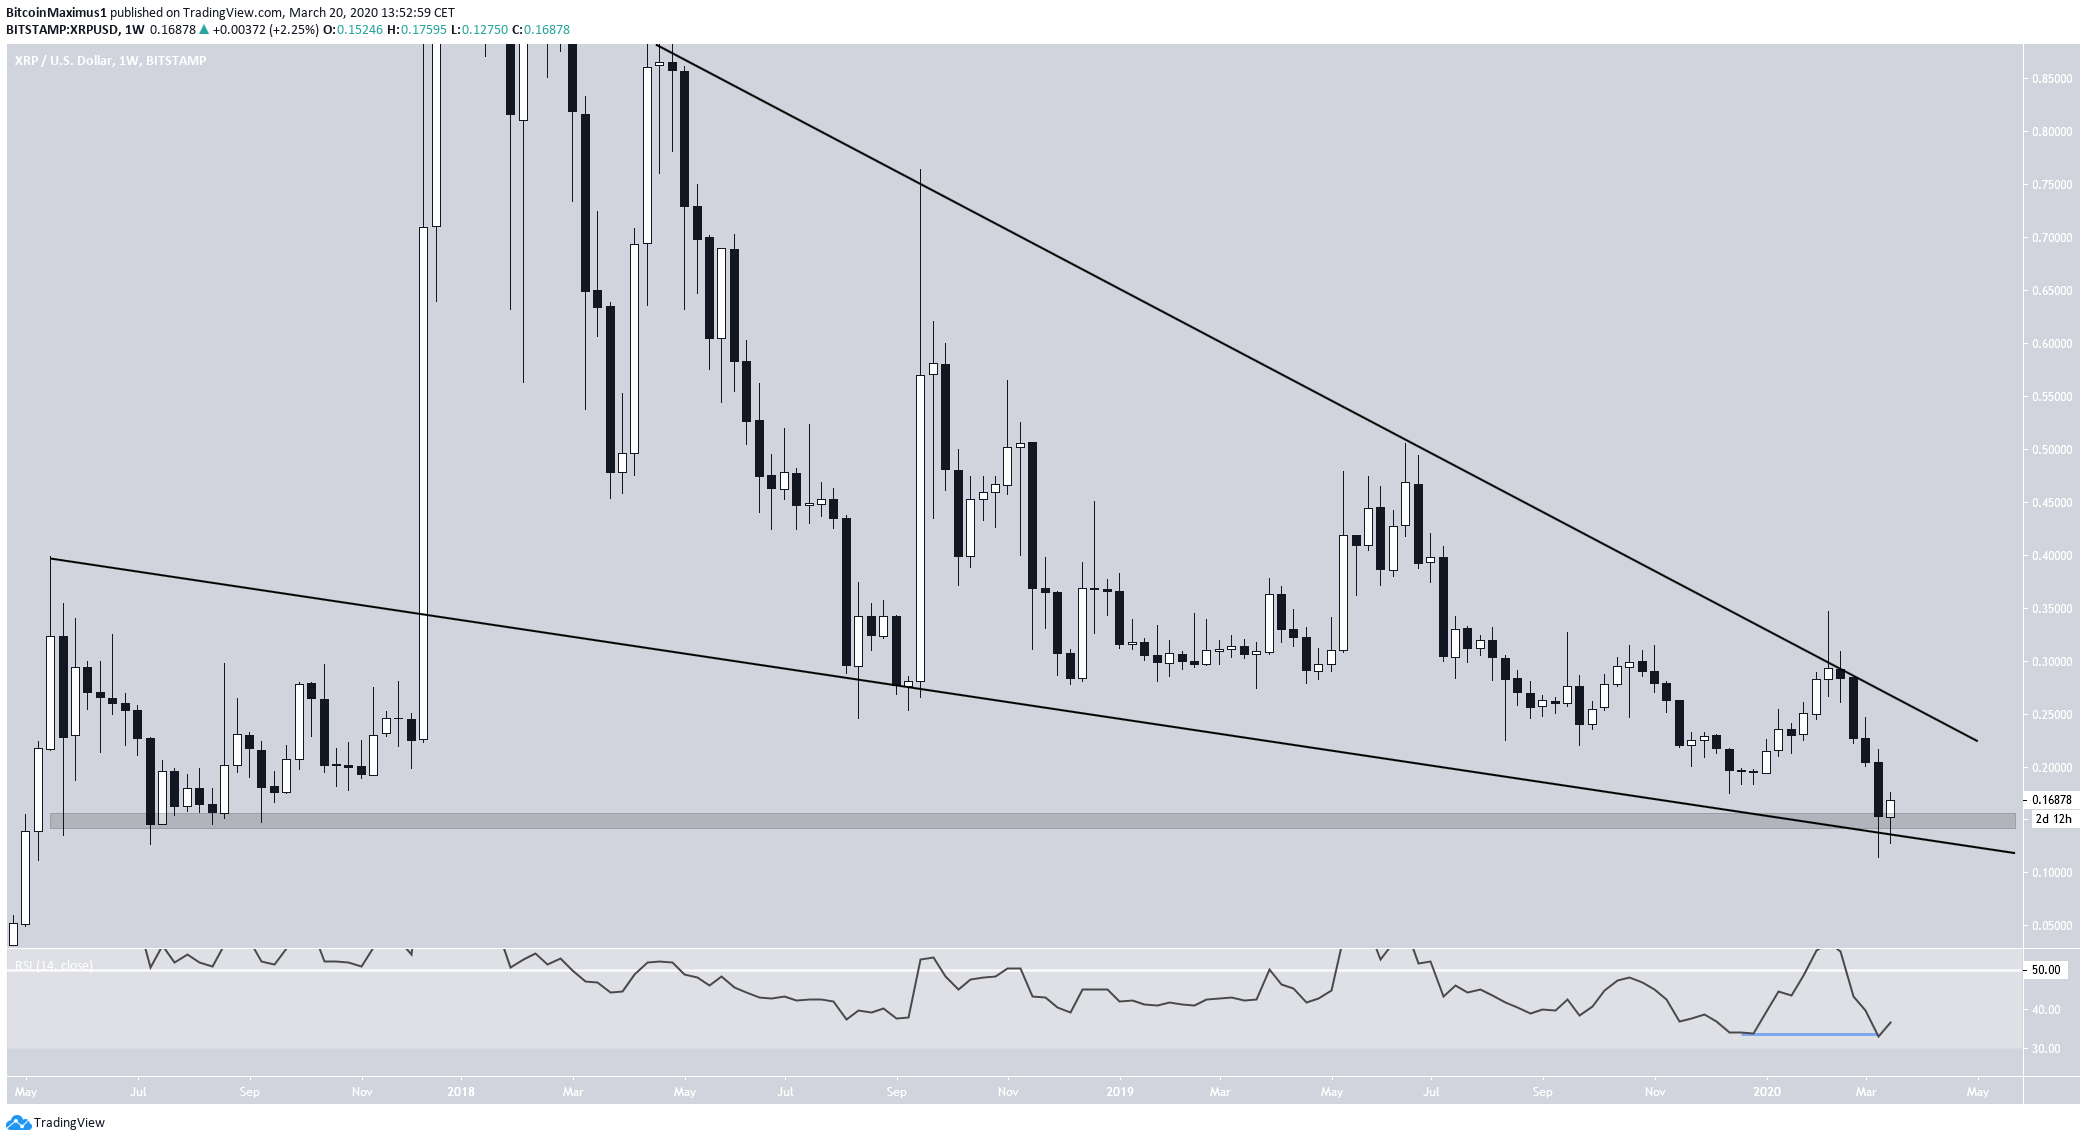
Descending Wedge
The XRP price is also trading inside a long-term descending wedge, which is considered a bullish reversal pattern. The support line of the wedge also coincides with the previously outlined support area.
Since December 2019, the weekly RSI has been generating bullish divergence and has created a double bottom. This is a sign that the price wants to move upward, especially when it is combined with the creation of a bullish reversal pattern and a significant support area.
However, until the XRP price actually breaks out from the descending wedge, we cannot state that the current trend is bullish.
To conclude, the XRP price briefly decreased below a significant support area but reclaimed it shortly afterward. It is trading inside a long-term bullish pattern, a breakout above which would indicate that the long-term correction that the price has been mired in since January 2018 has ended.
