The Sandbox (SAND) has failed to break out from a descending resistance line that has been in place for the past 87 days. However, it is trading very close to an important short-term support level, which could initiate another breakout attempt.
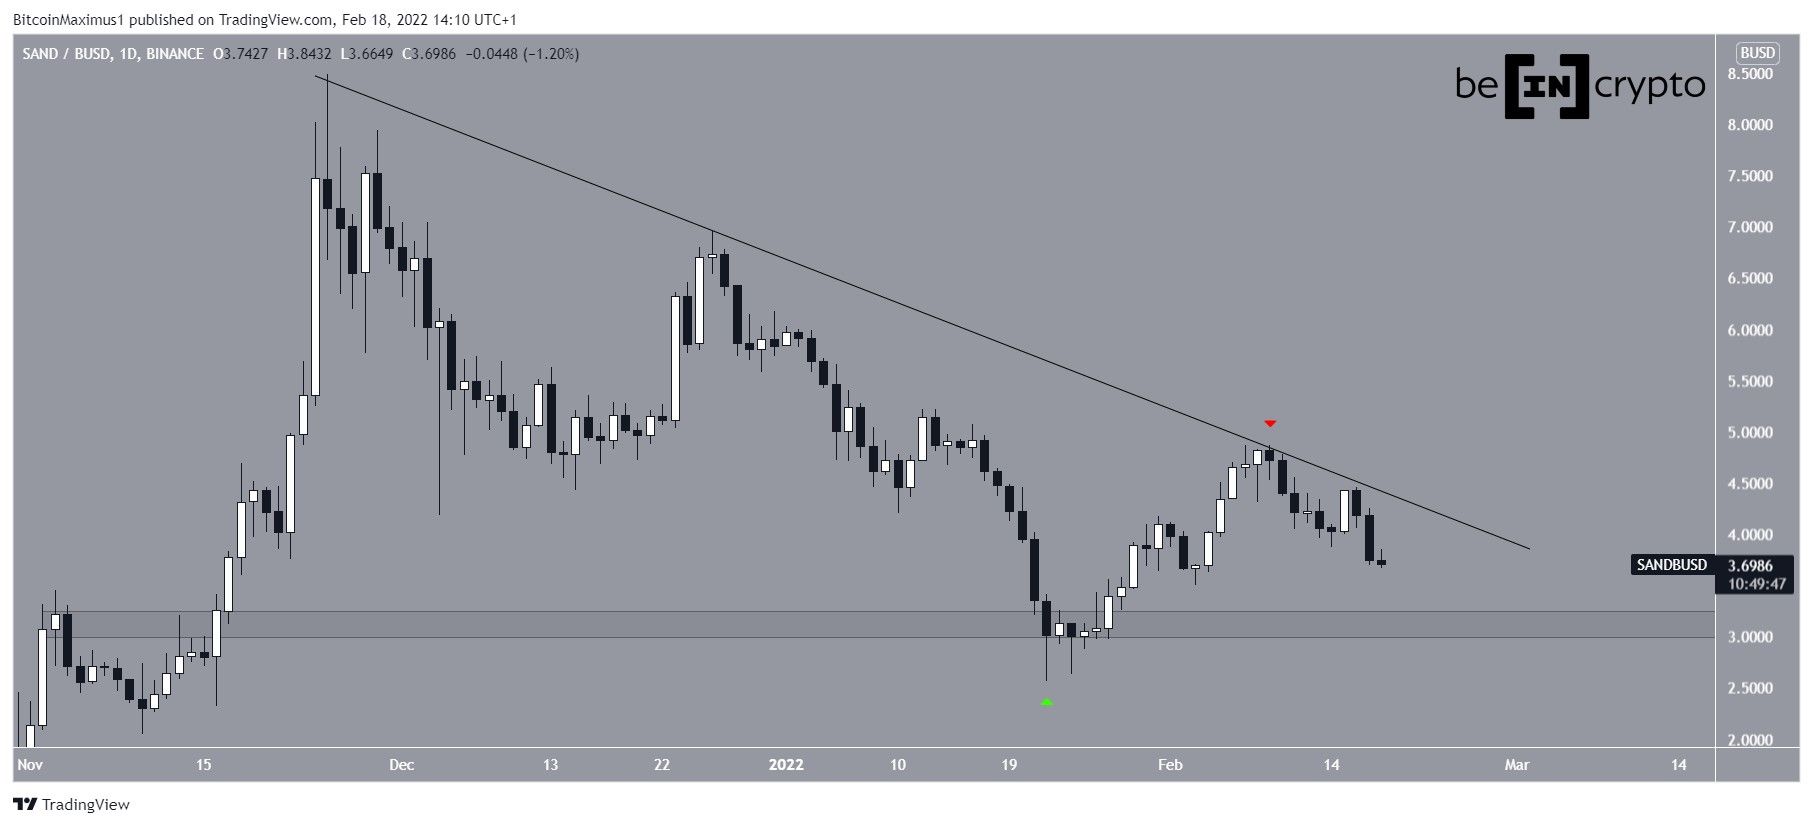
SAND has been falling since reaching an all-time high on Nov 25. SO far, the downward movement has led to a low of $2.56 on Jan 22.
The price has been following a descending resistance line throughout the descent, which has rejected it thrice so far, most recently on Feb 9 (red icon).
SAND has been decreasing since and is approaching the $3.15 horizontal support area, which was validated with the aforementioned Jan 22 low (green icon). The support area has been in place since Nov 2021. Therefore, a breakdown below it could be the catalyst for a sharp fall.
Will SAND break out?
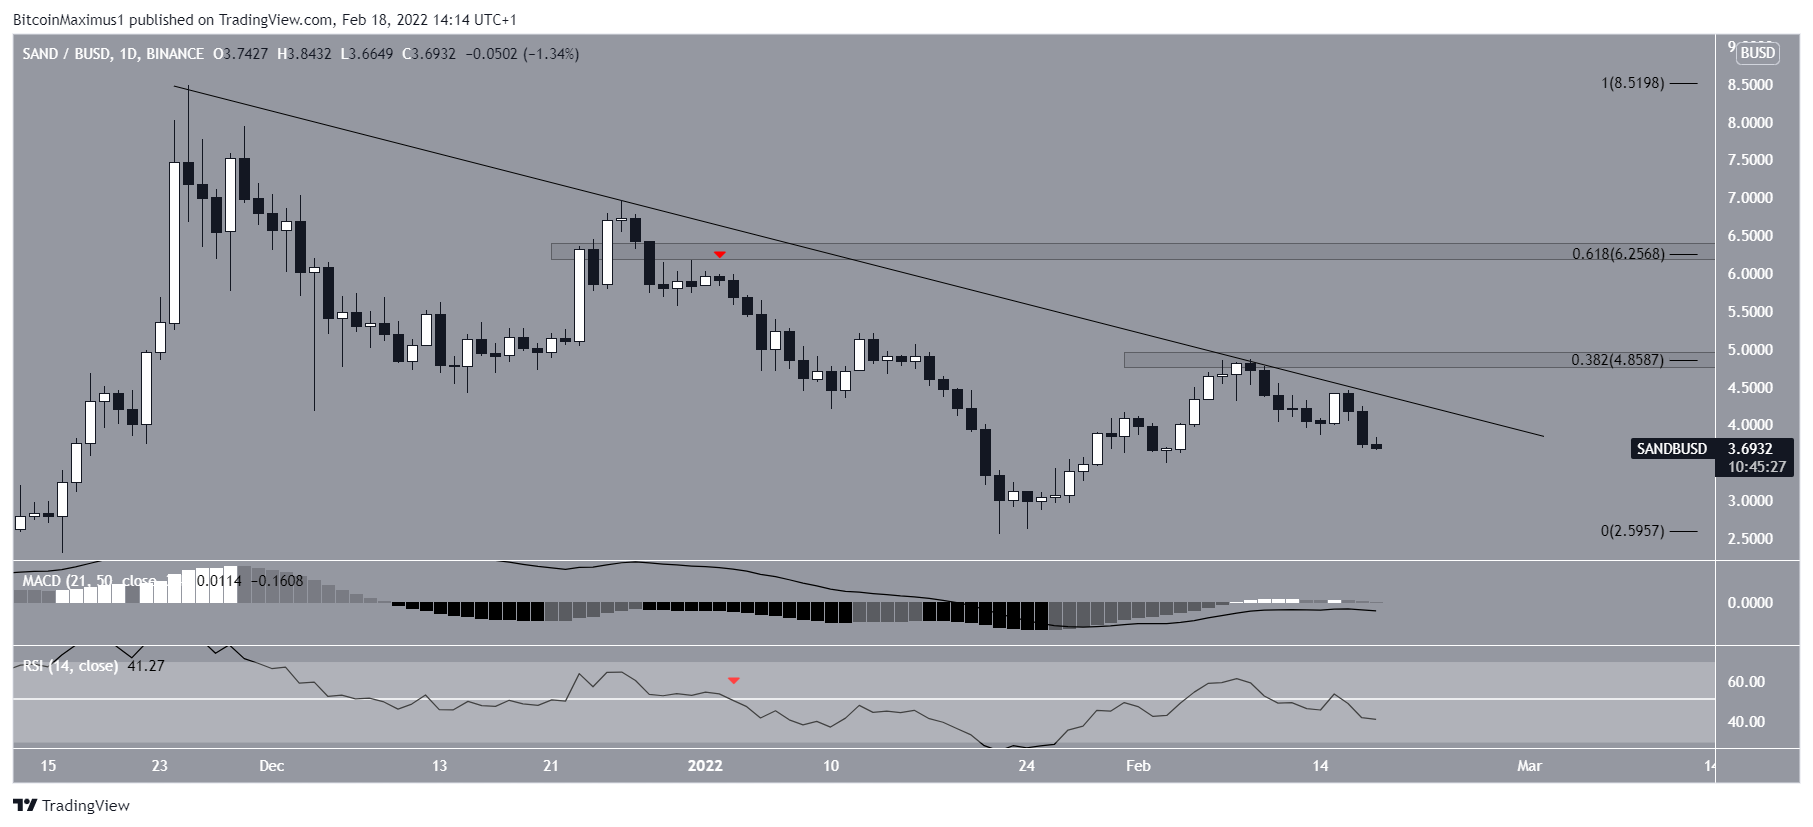
In the daily time-frame, technical indicators provide a neutral/bearish outlook. The reason for this is that both the MACD and RSI are falling. Furthermore, the former is negative while the latter is below 50, both of which are considered signs of a bearish trend.
Going by the RSI, the trend has been definitively bearish since Jan 3 (red icon), when the RSI first crossed below 50.
If SAND were to break out instead, the main resistances would be at $4.85 and $6.25, respectively. These are the 0.382 and 0.618 Fib retracement resistance levels and both are also horizontal resistance areas.
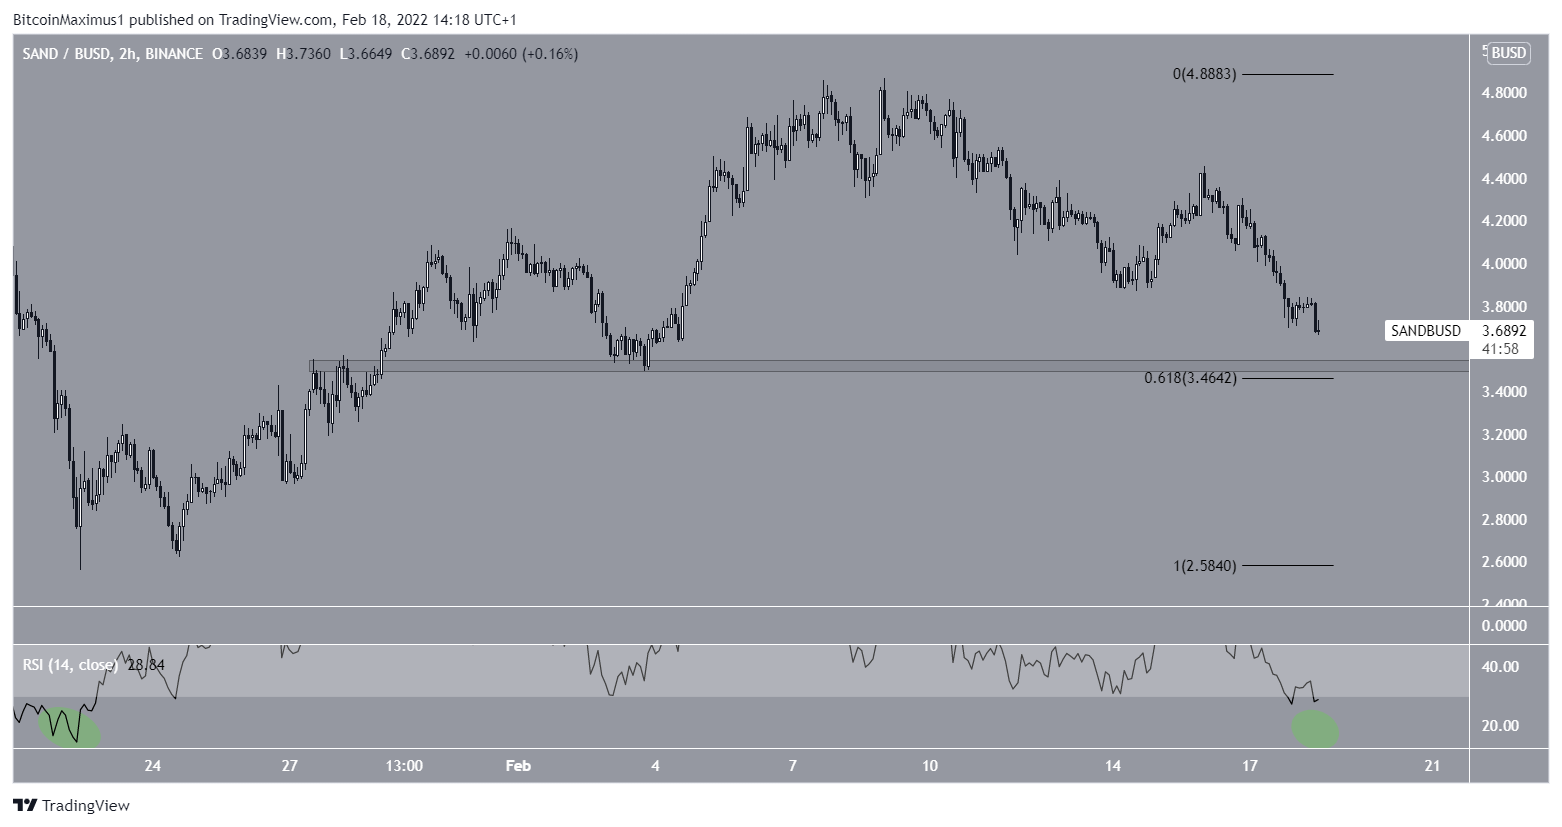
However, the two-hour chart provides a more valid opportunity for a reversal. The reason for this is that SAND is trading just above a crucial support level between $3.45-$3.55. This support is created by the 0.618 Fib retracement support level and a horizontal support area.
Furthermore, the RSI is nearly into oversold territory. The previous time it reached this region, SAND initiate a nearly month long upward movement.
Wave count analysis
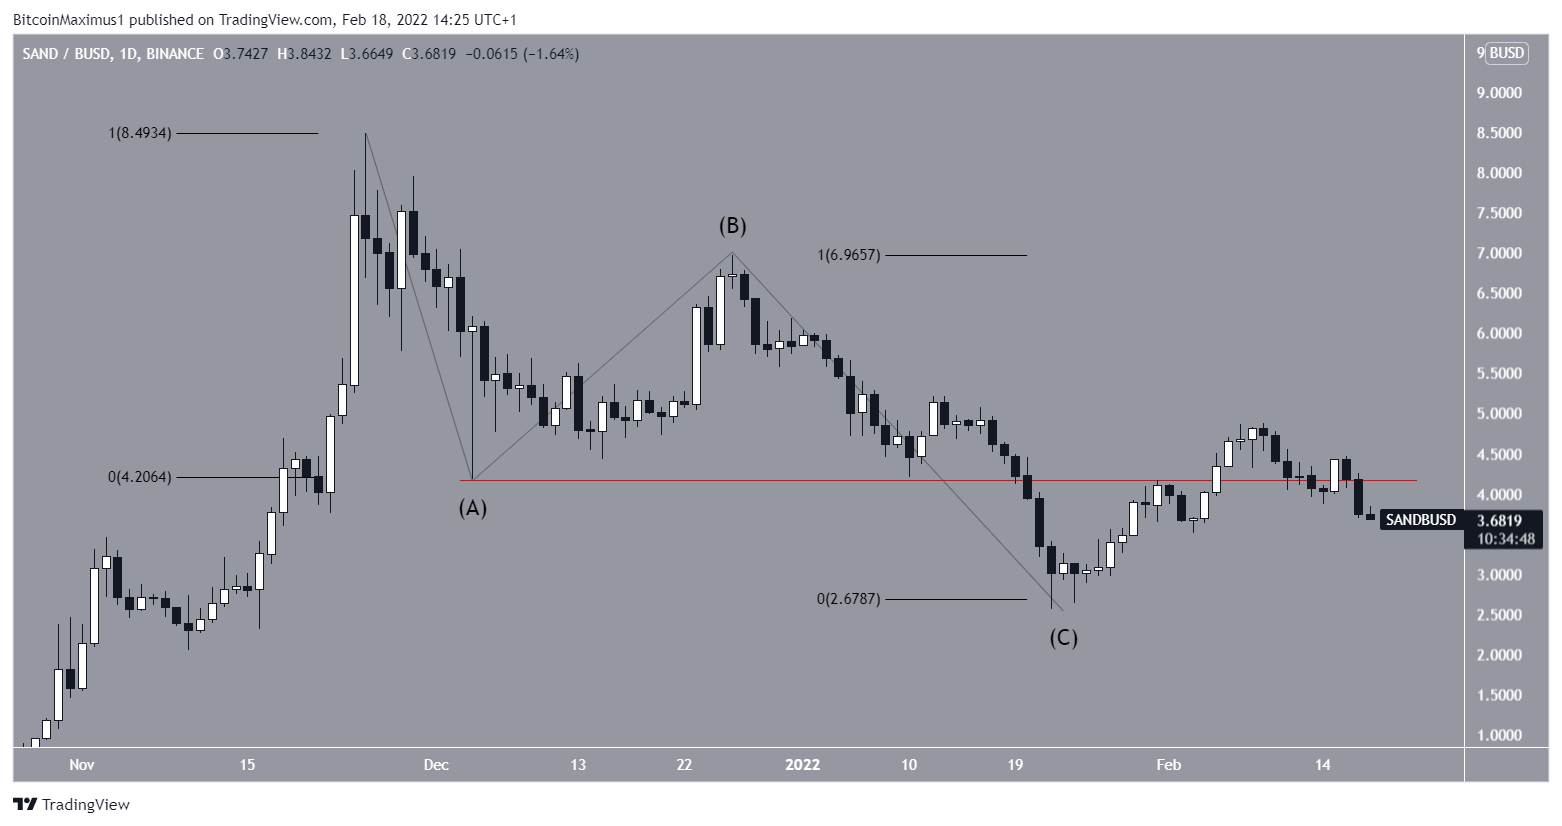
Cryptocurrency trader @Altstreetbet tweeted a chart of SAND, stating that the token is finishing an A-B-C corrective structure.
First off, measuring from the all-time high price, the decrease clearly looks like a three wave structure, in which waves A:C have had an exactly 1:1 ratio.
Afterwards, the ensuing overlap (red line) serves to further confirm this possibility.
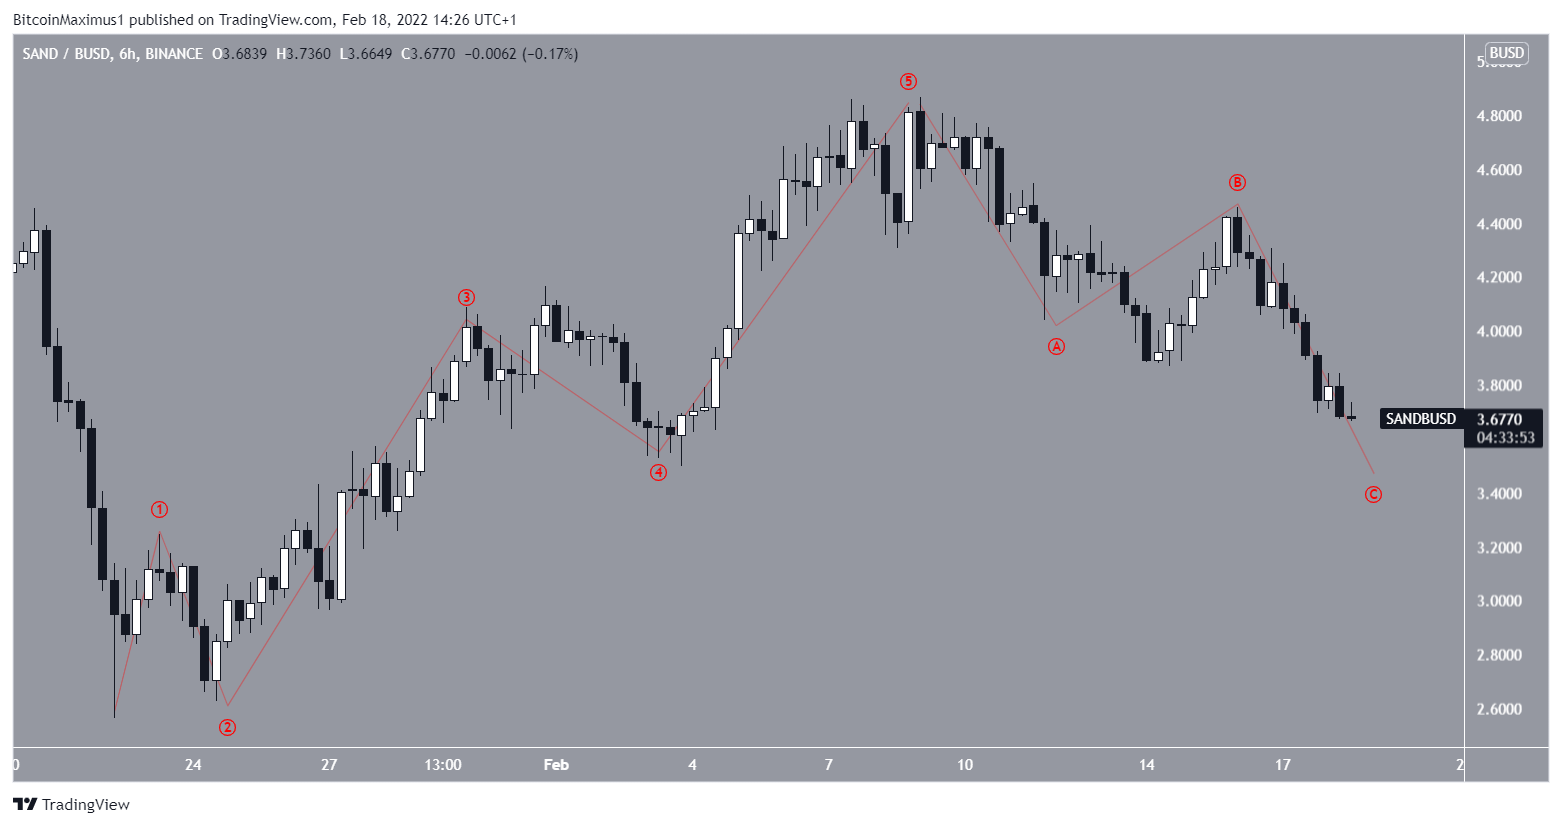
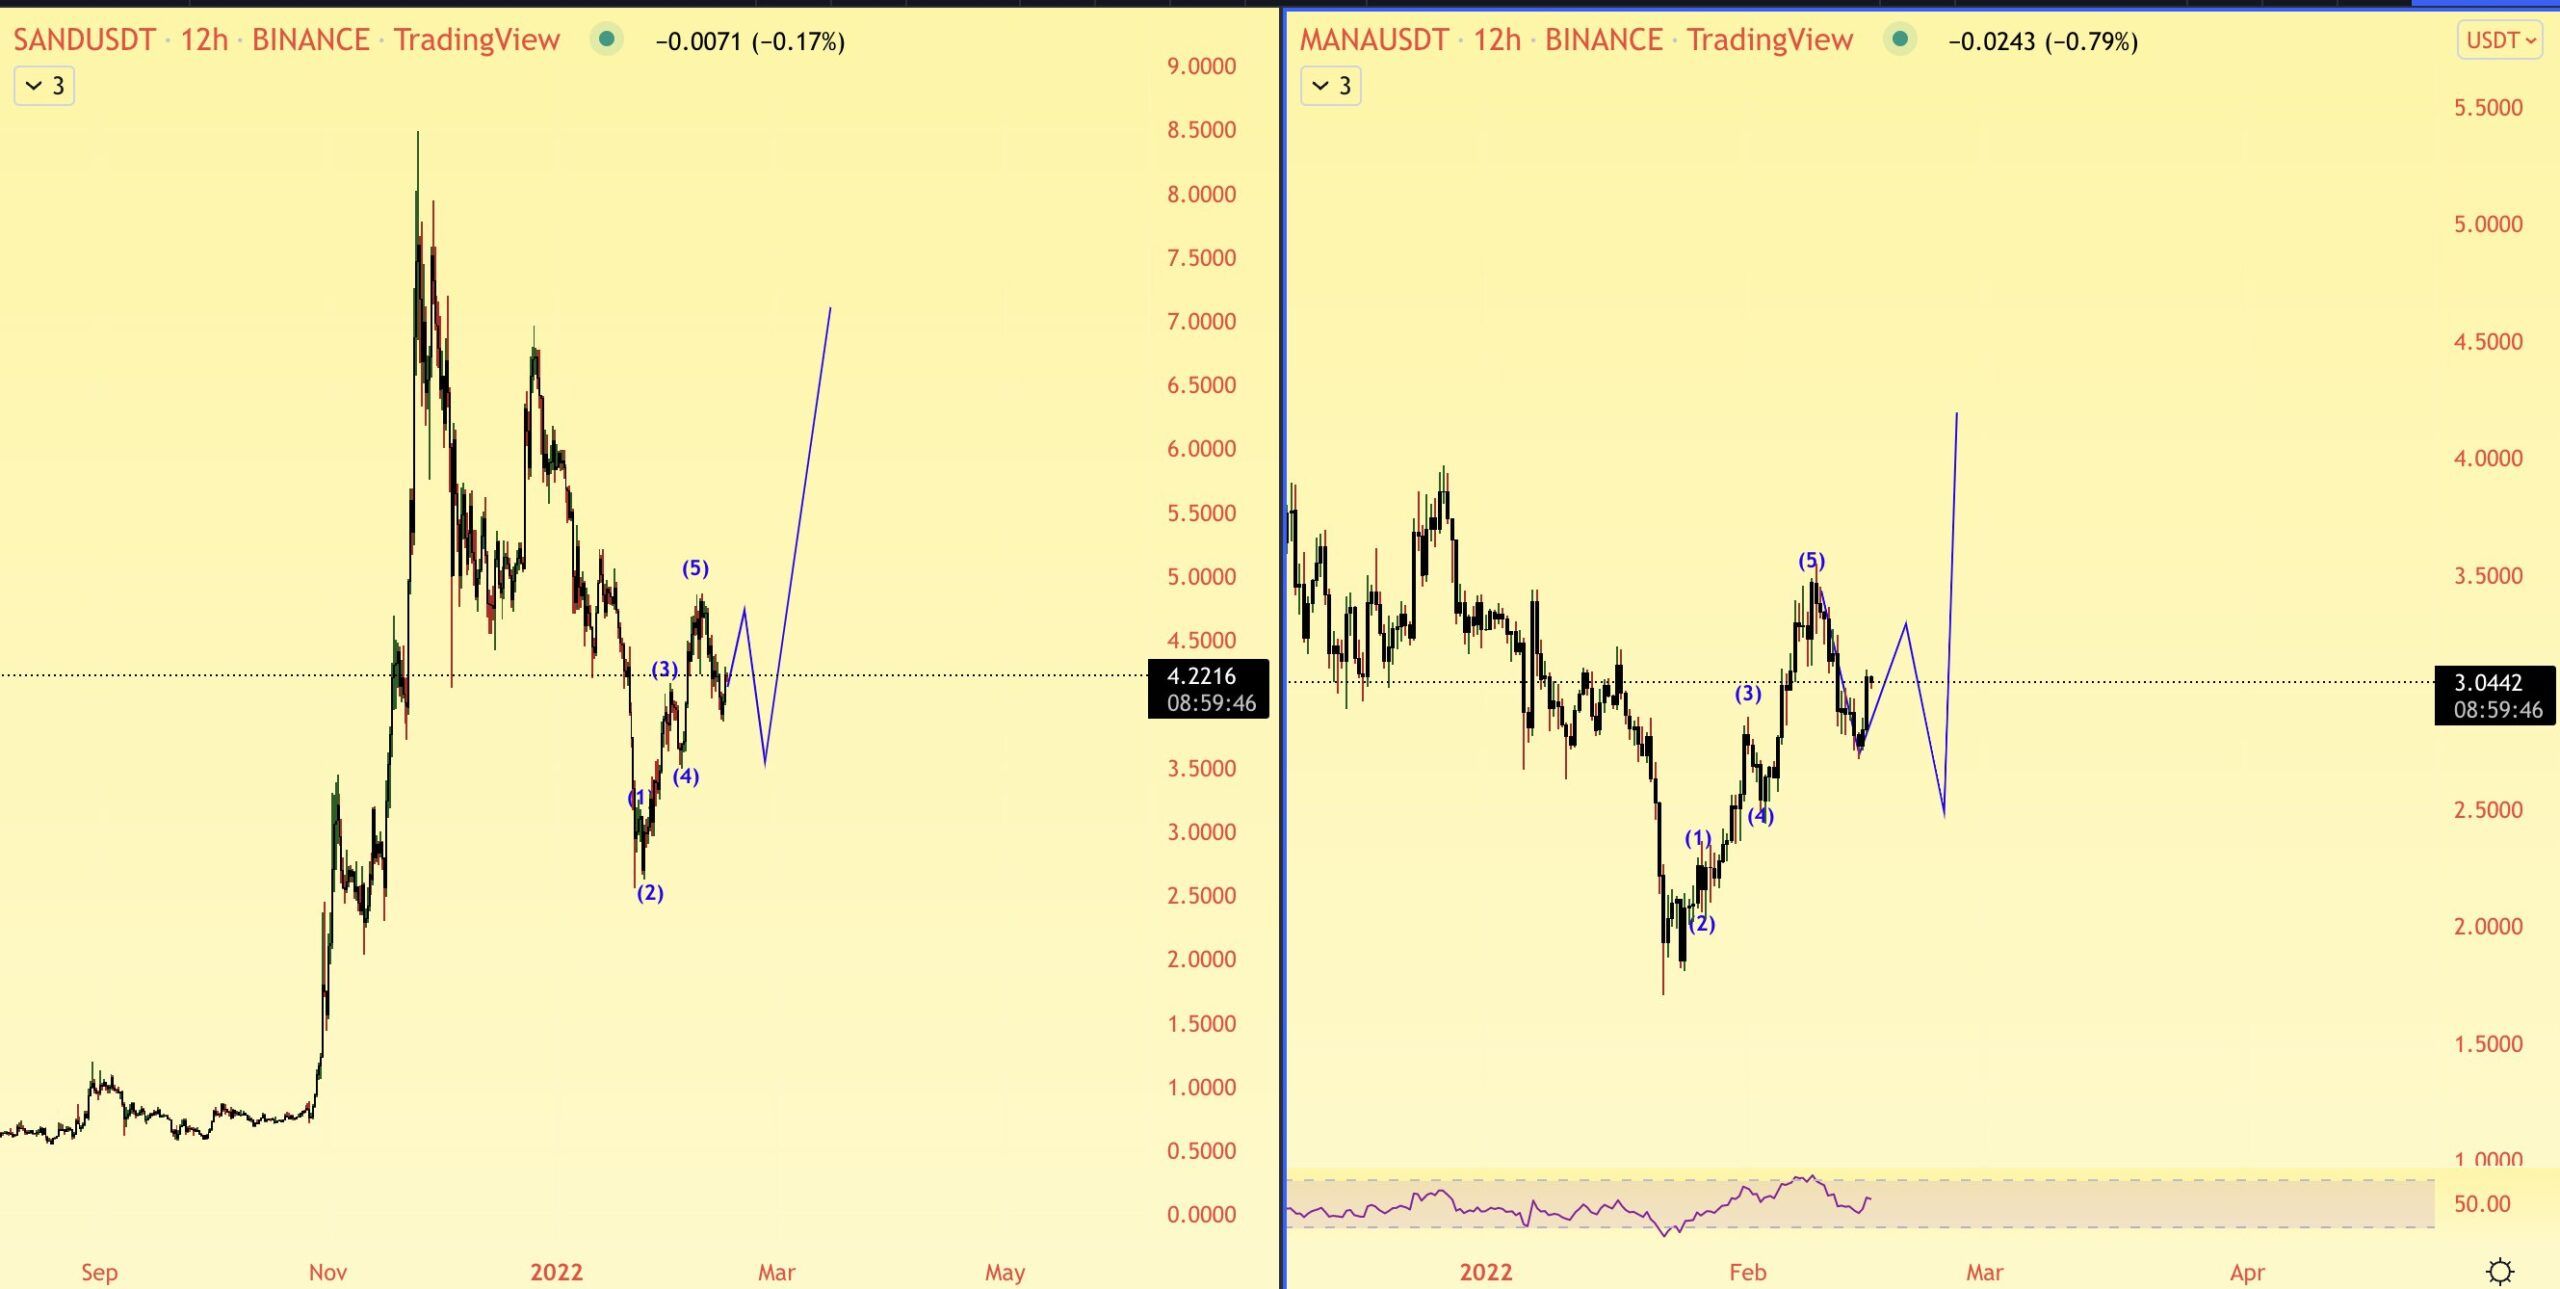
The six-hour chart shows that the increase after Jan 22 was a five wave upward movement, and SAND is now correcting inside a small A-B-C structure.
Therefore, this suggests that SAND will eventually break out from the resistance line and potentially move towards the $6.25 resistance level.