BeInCrypto takes a look at the price movement for seven different cryptocurrencies, including the Sandbox (SAND), which has been moving upwards with strength since Jan 22.
BTC
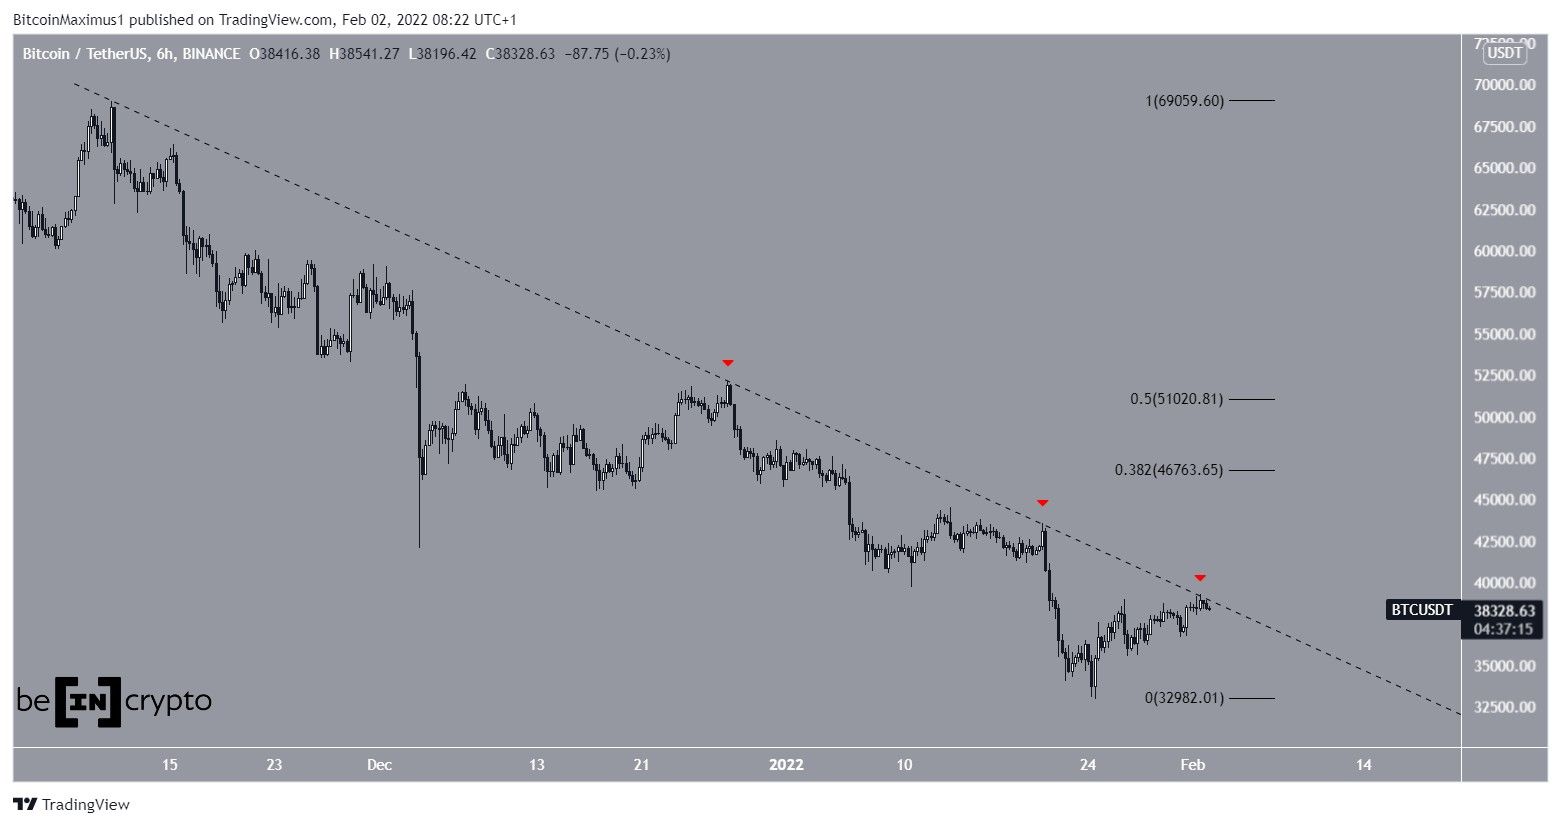
BTC has been following a descending resistance line since Nov 10, 2021. So far, it has made three breakout attempts (red icons), most recently on Feb 1.
Since resistances get weaker each time that are touched, the next closest resistance would be at $46,750. This is the 0.382 Fib retracement resistance level.
ETH
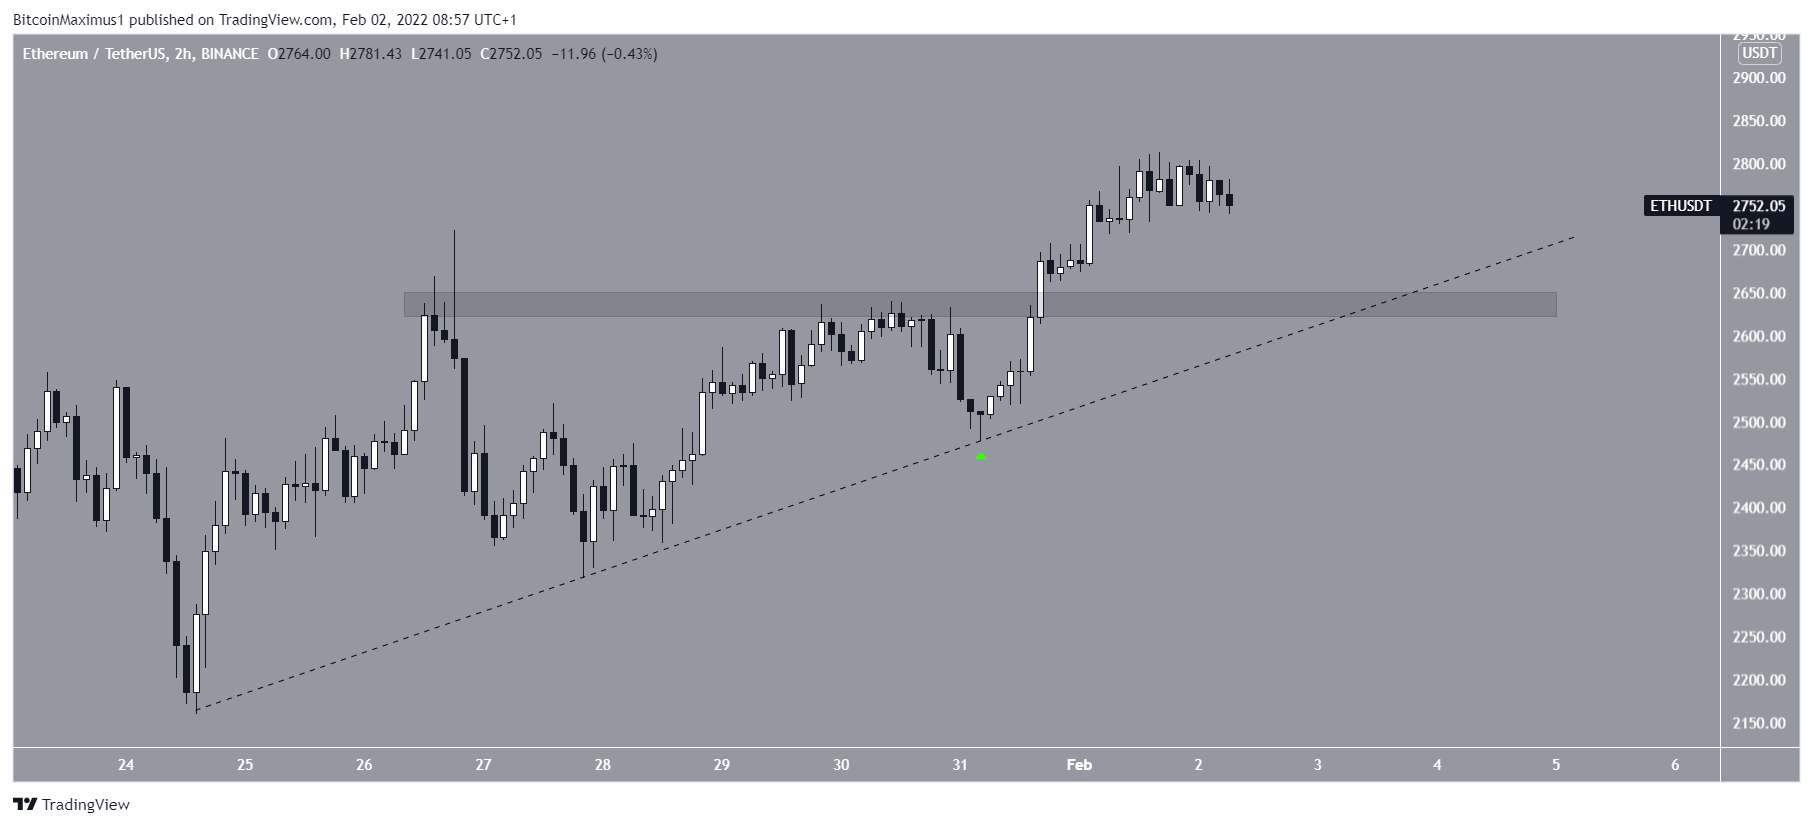
ETH has been following a very steep ascending support line since Jan 4. Most recently, it bounced at the line on Jan 31 (green icon) and proceeded to break out from the $2,640 horizontal resistance area. The area is now expected to provide support in case a short-term drop transpires.
The long-term readings indicate that the upward move is expected to continue.
SXP
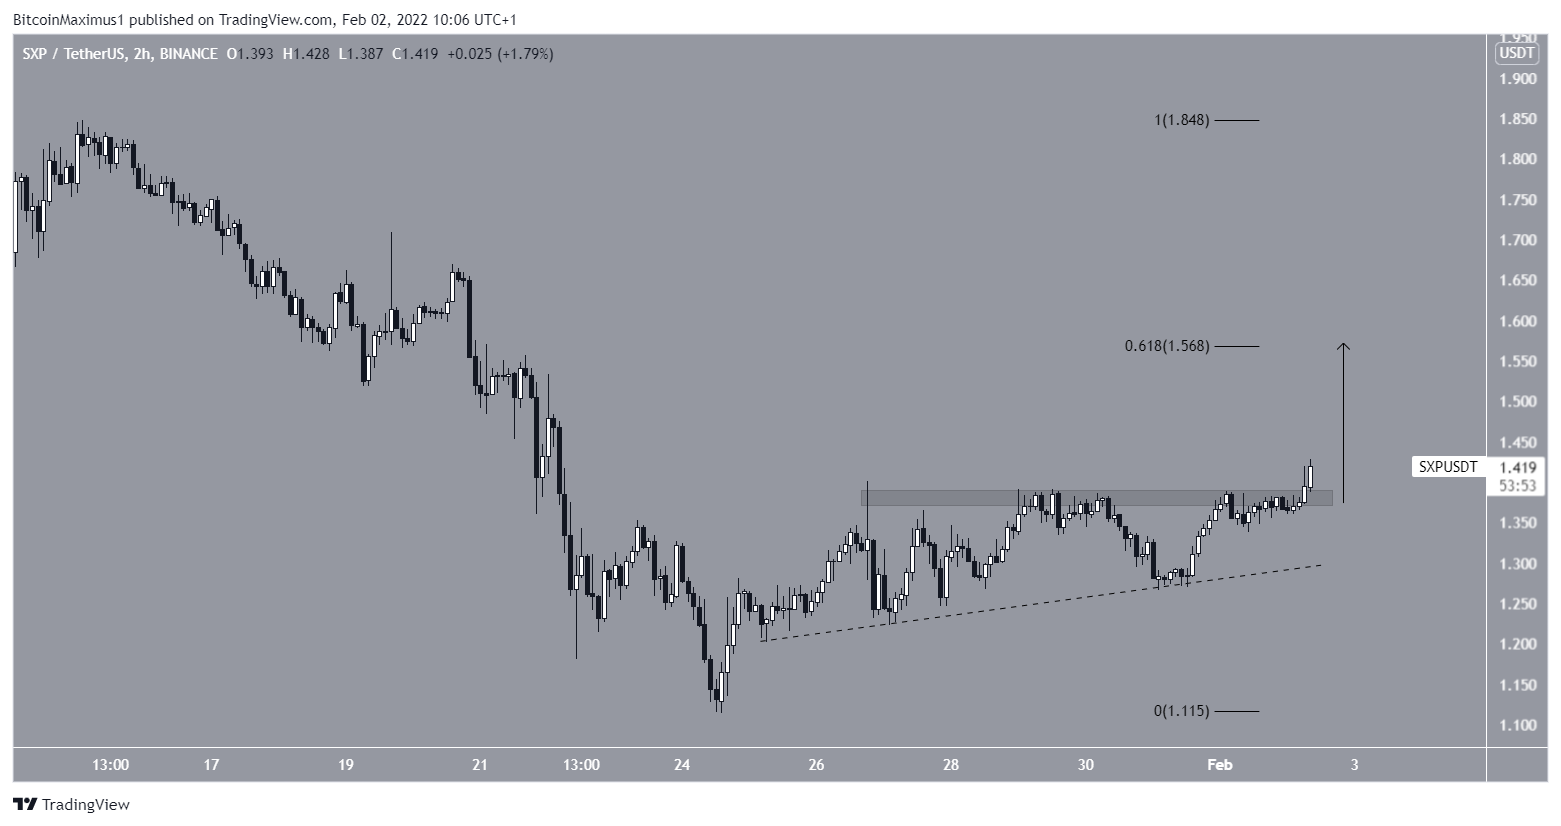
SXP has been increasing alongside an ascending support line since Jan 25. When combined with the $1.35 resistance area, this created an ascending triangle, from which SXP broke out on Feb 2.
If the token increases the entire height of the pattern, it would reach a high of $1.57, reaching the 0.618 Fib retracement resistance level in the process.
LUNA
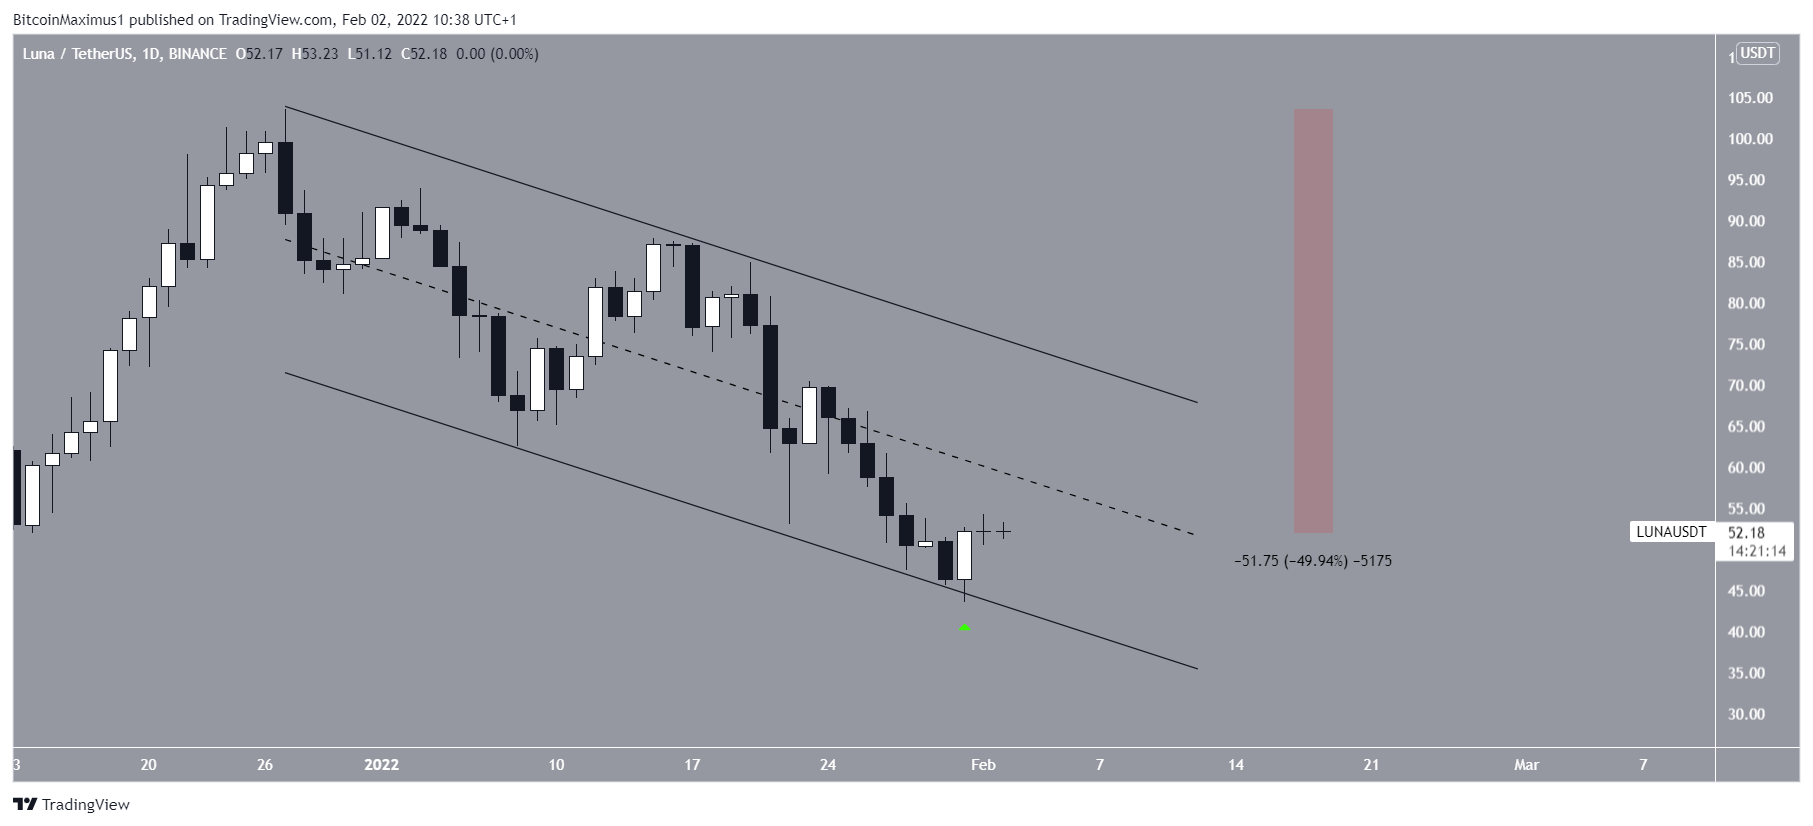
LUNA has been falling since reaching an all-time high on Dec 27. The decrease led to a low of $43.44 on Jan 31. So far, it has decreased by 50%.
However, the token bounced afterwards and created a bullish engulfing candlestick (green icon). This also served to validate a descending parallel channel. The first resistance area is at $55, created by the middle of the channel.
RUNE
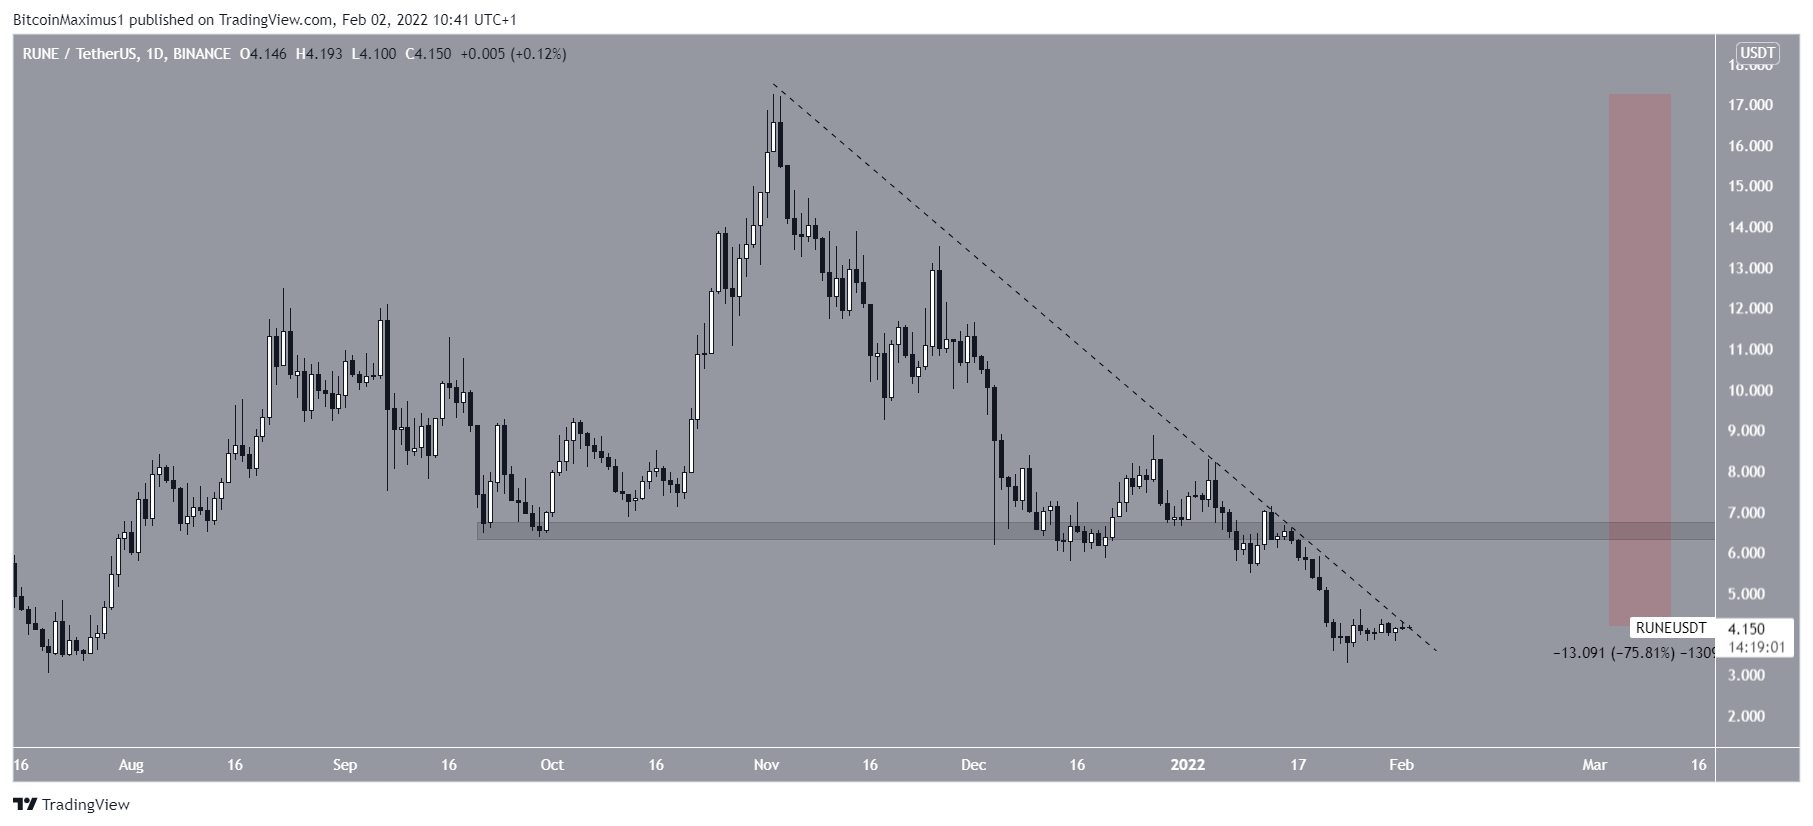
RUNE has been falling alongside a descending resistance line since Nov 2. So far, the downward movement has led to a low of $3.25, which amounted to a decrease of 76%. Similarly to BTC, RUNE is following a descending resistance line. The trend cannot be considered bullish until it manages to break out from this line.
The closest resistance area is at $6.50.
SAND
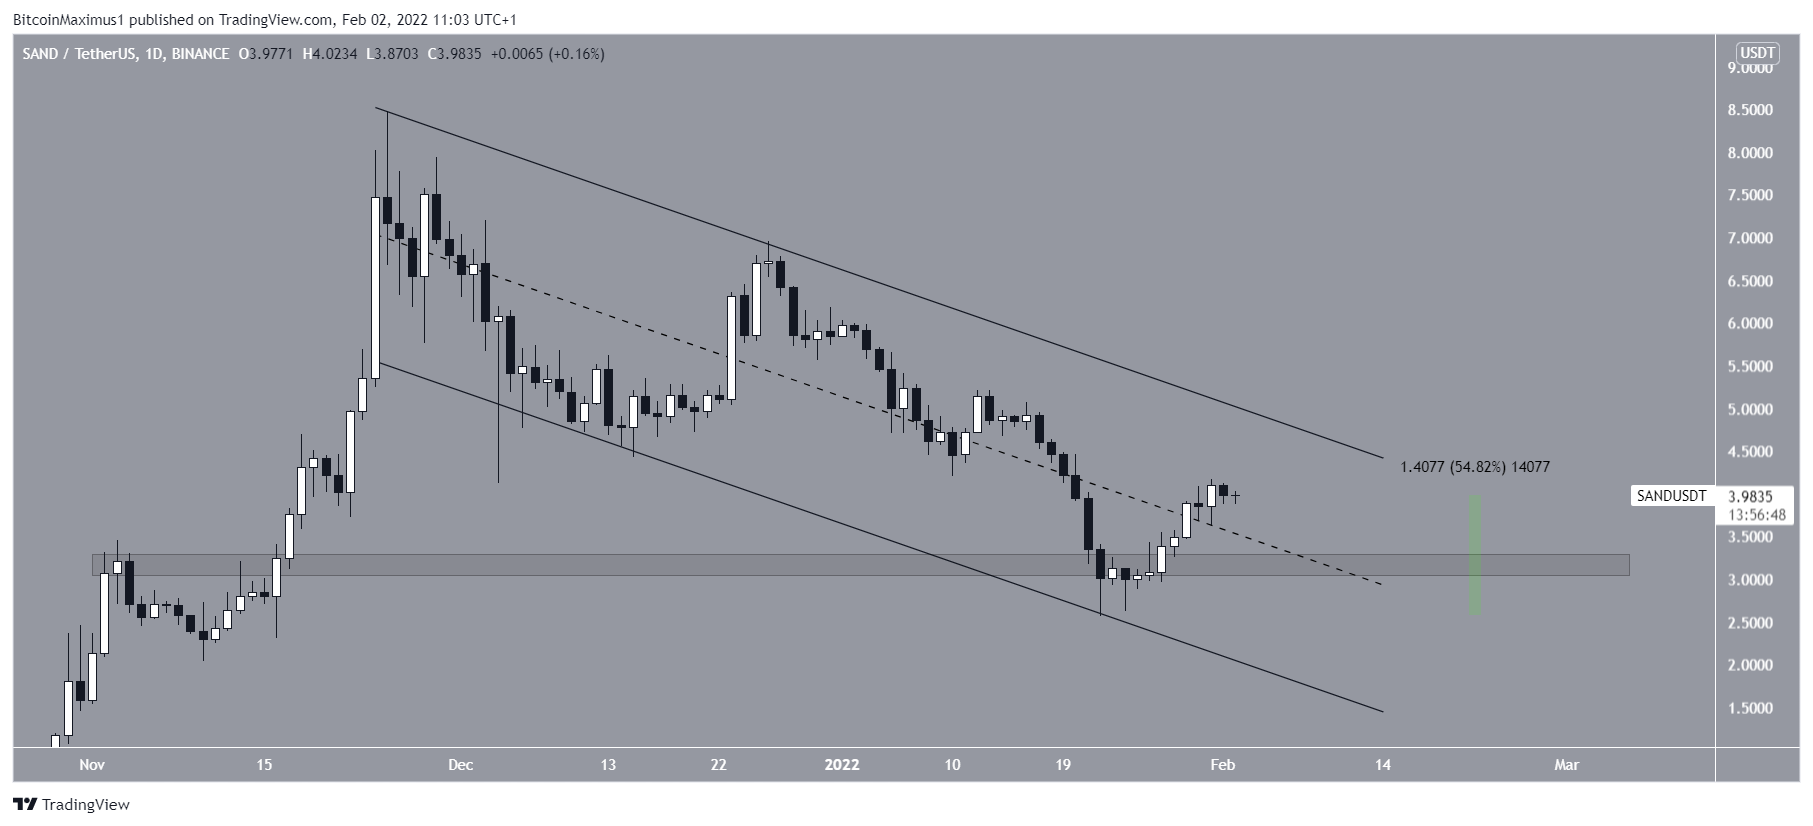
Similarly to LUNA, SAND has been falling inside a descending parallel channel since reaching an all-time high price on Nov 25. The downward movement led to a low of $2.55 on Jan 22. SAND has been moving upwards since and has increased by 55% so far.
The ongoing bounce has also served to validate the $3.20 area as support.
A breakout from this channel would confirm that the correction is complete.
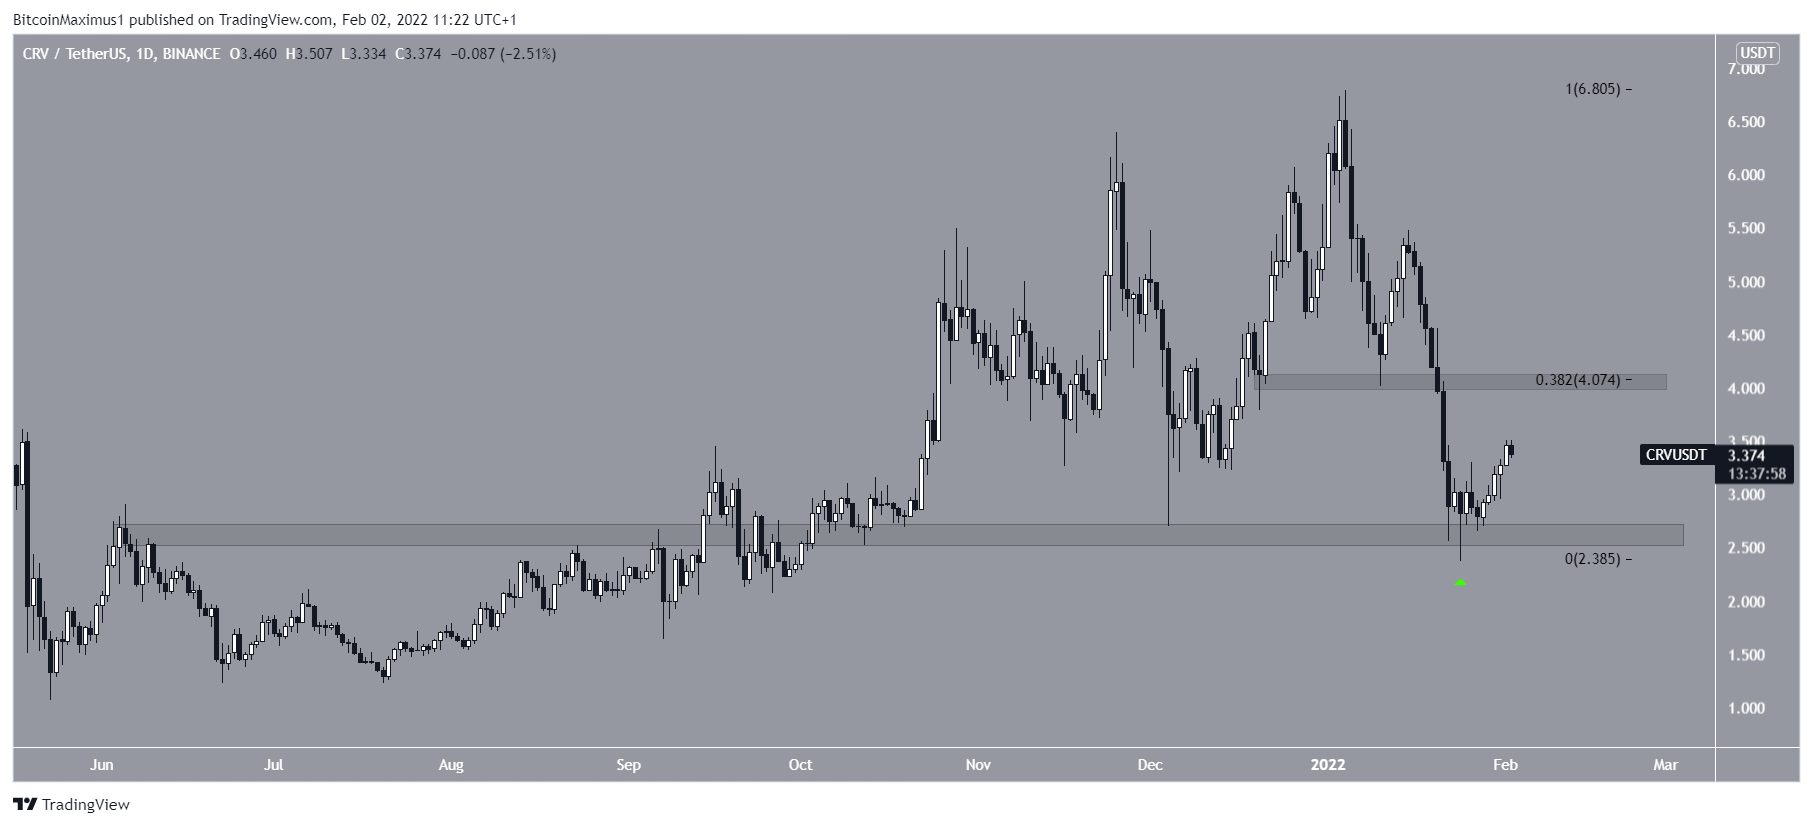
CRV
CRV has been falling since Jan 4, when it reached a high of $6.80.
On Jan 24, it reached a low of $2.36 (green icon) and bounced. The bounce served to validate the $2.50 area as support, which has been in place since Oct 2021.
If the upward movement continues, the closest resistance area would be at $4.07, created by the 0.382 Fib retracement resistance level and a horizontal resistance area.