The Sandbox (SAND) initiated a strong bounce on Dec 4, but failed to break out from the closest resistance afterwards.
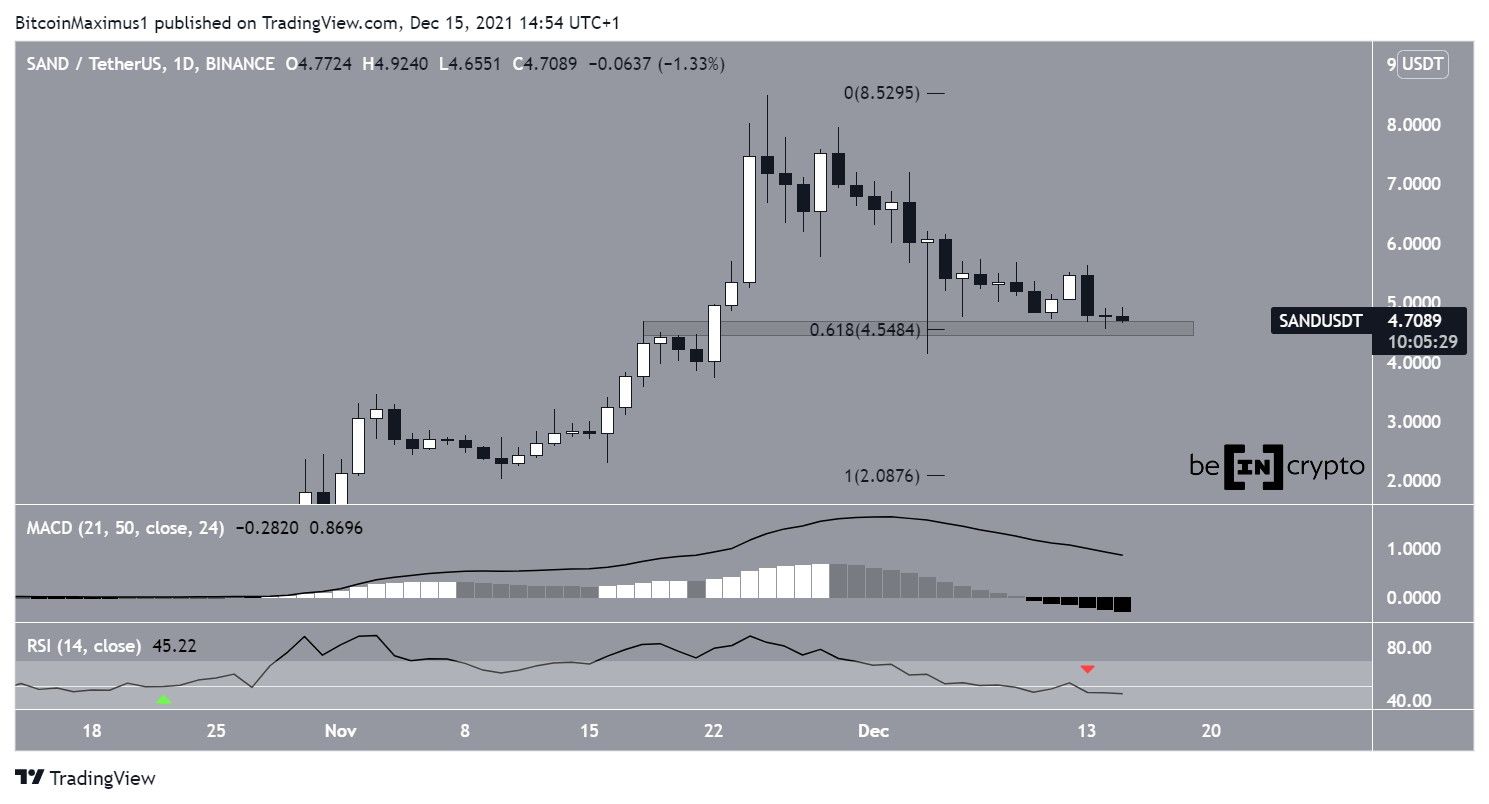
SAND has been decreasing since reaching an all-time high price of $8.48 on Nov 25. So far, it has reached a low of $4.12 on Dec 4. A bounce ensued afterwards, leaving a very long lower wick in place.
More importantly, the bounce served to validate the $4.55 area as support. This is both a horizontal support area and the 0.618 Fib retracement support level. Due to the confluence of these factors, it is likely to initiate a bounce.
However, technical indicators for SAND are still bearish.
The MACD, which is created by a short- and a long-term moving average (MA), is falling. This means that the short-term MA is losing ground relative to the long-term one. However, the fact that the indicator is still positive means that the short-term MA is not yet slower than the long-term one.
The RSI has already fallen below 50 (red icon). This is a sign associated with bearish trends. The previous cross above the 50 line (green icon) preceded the entire upward movement to the all-0time high.
Therefore, the price action and technical indicator readings from the daily time-frame are not in alignment with each other
Short-term SAND movement
Cryptocurrency trader @TradingTank tweeted a SAND chart, stating that there is no more resistance above the $5.60 horizontal area.
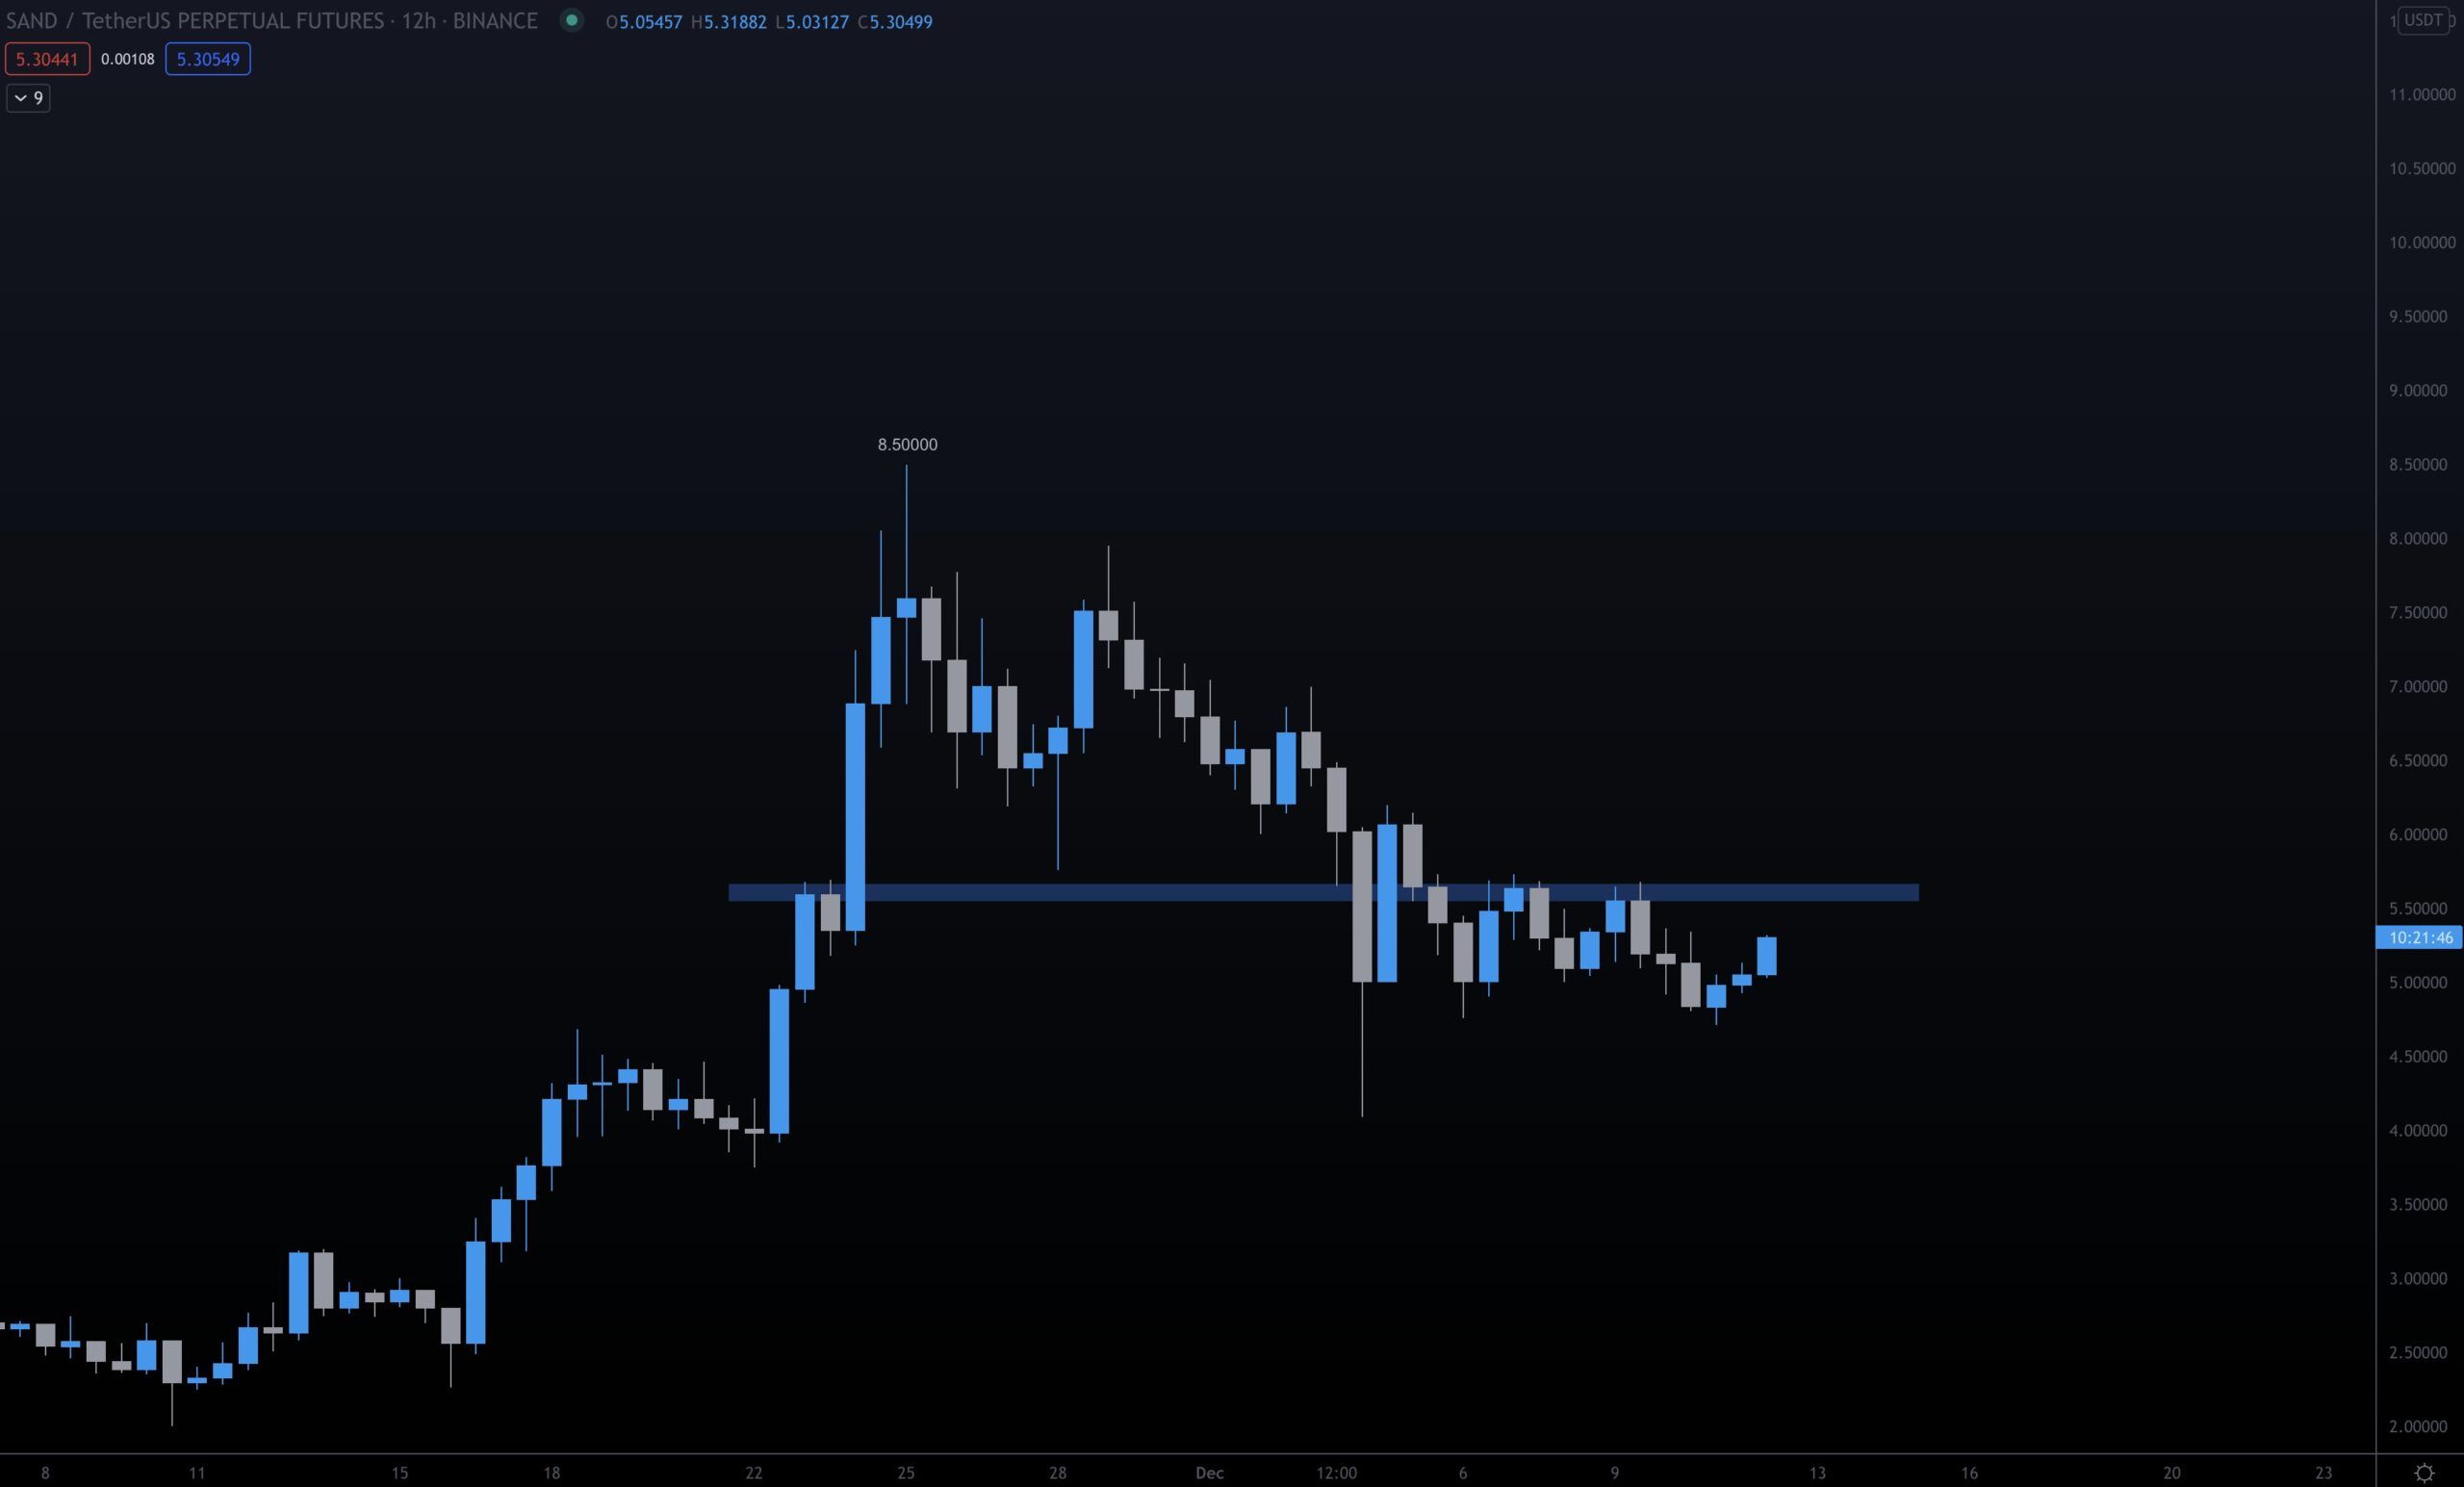
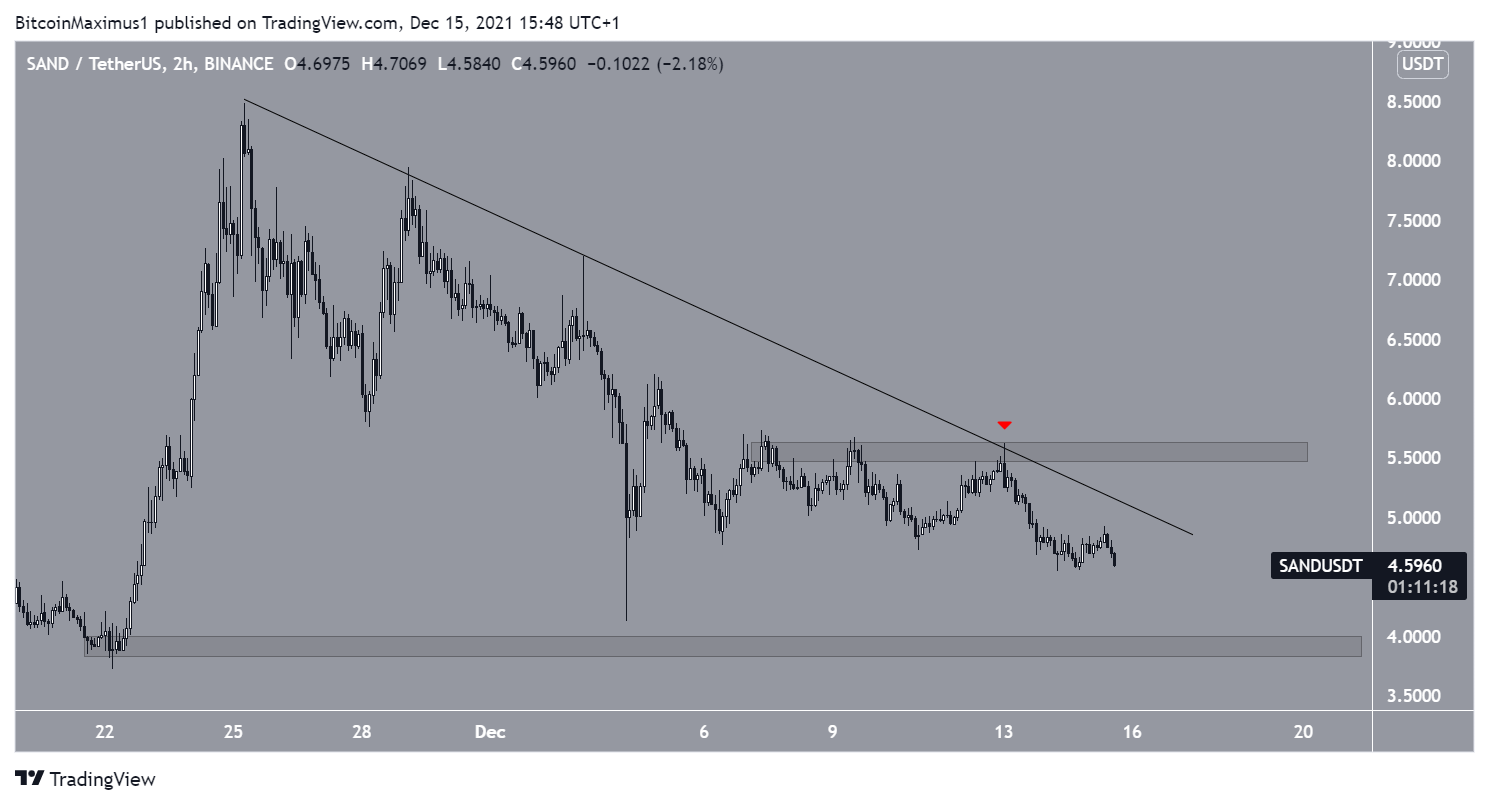
The main resistance area is found at $5.60. It coincides with a descending resistance line in place since the all-time high.
More recently, it rejected SAND on Dec 13, being the catalyst for the current downward movement. Until this level is reclaimed, the trend cannot be considered bullish.
Conversely, the closest horizontal support area is at $3.95.
Due to the short-term rejection, it seems that SAND is decreasing towards this level.