


The Litecoin (LTC) price is struggling to move above the $98 resistance area. It could drop in the short term before mounting another upward movement.
There was some positive Litecoin news last week, especially relating to the Litecoin network. The network processed its 141 millionth transaction. Transaction counts have been steady, hovering around 100,000 per day. However, while the Litecoin (LTC) price increased significantly last week, it failed to move above $100, despite this positive piece of Litecoin news.
Litecoin Struggles With Resistance
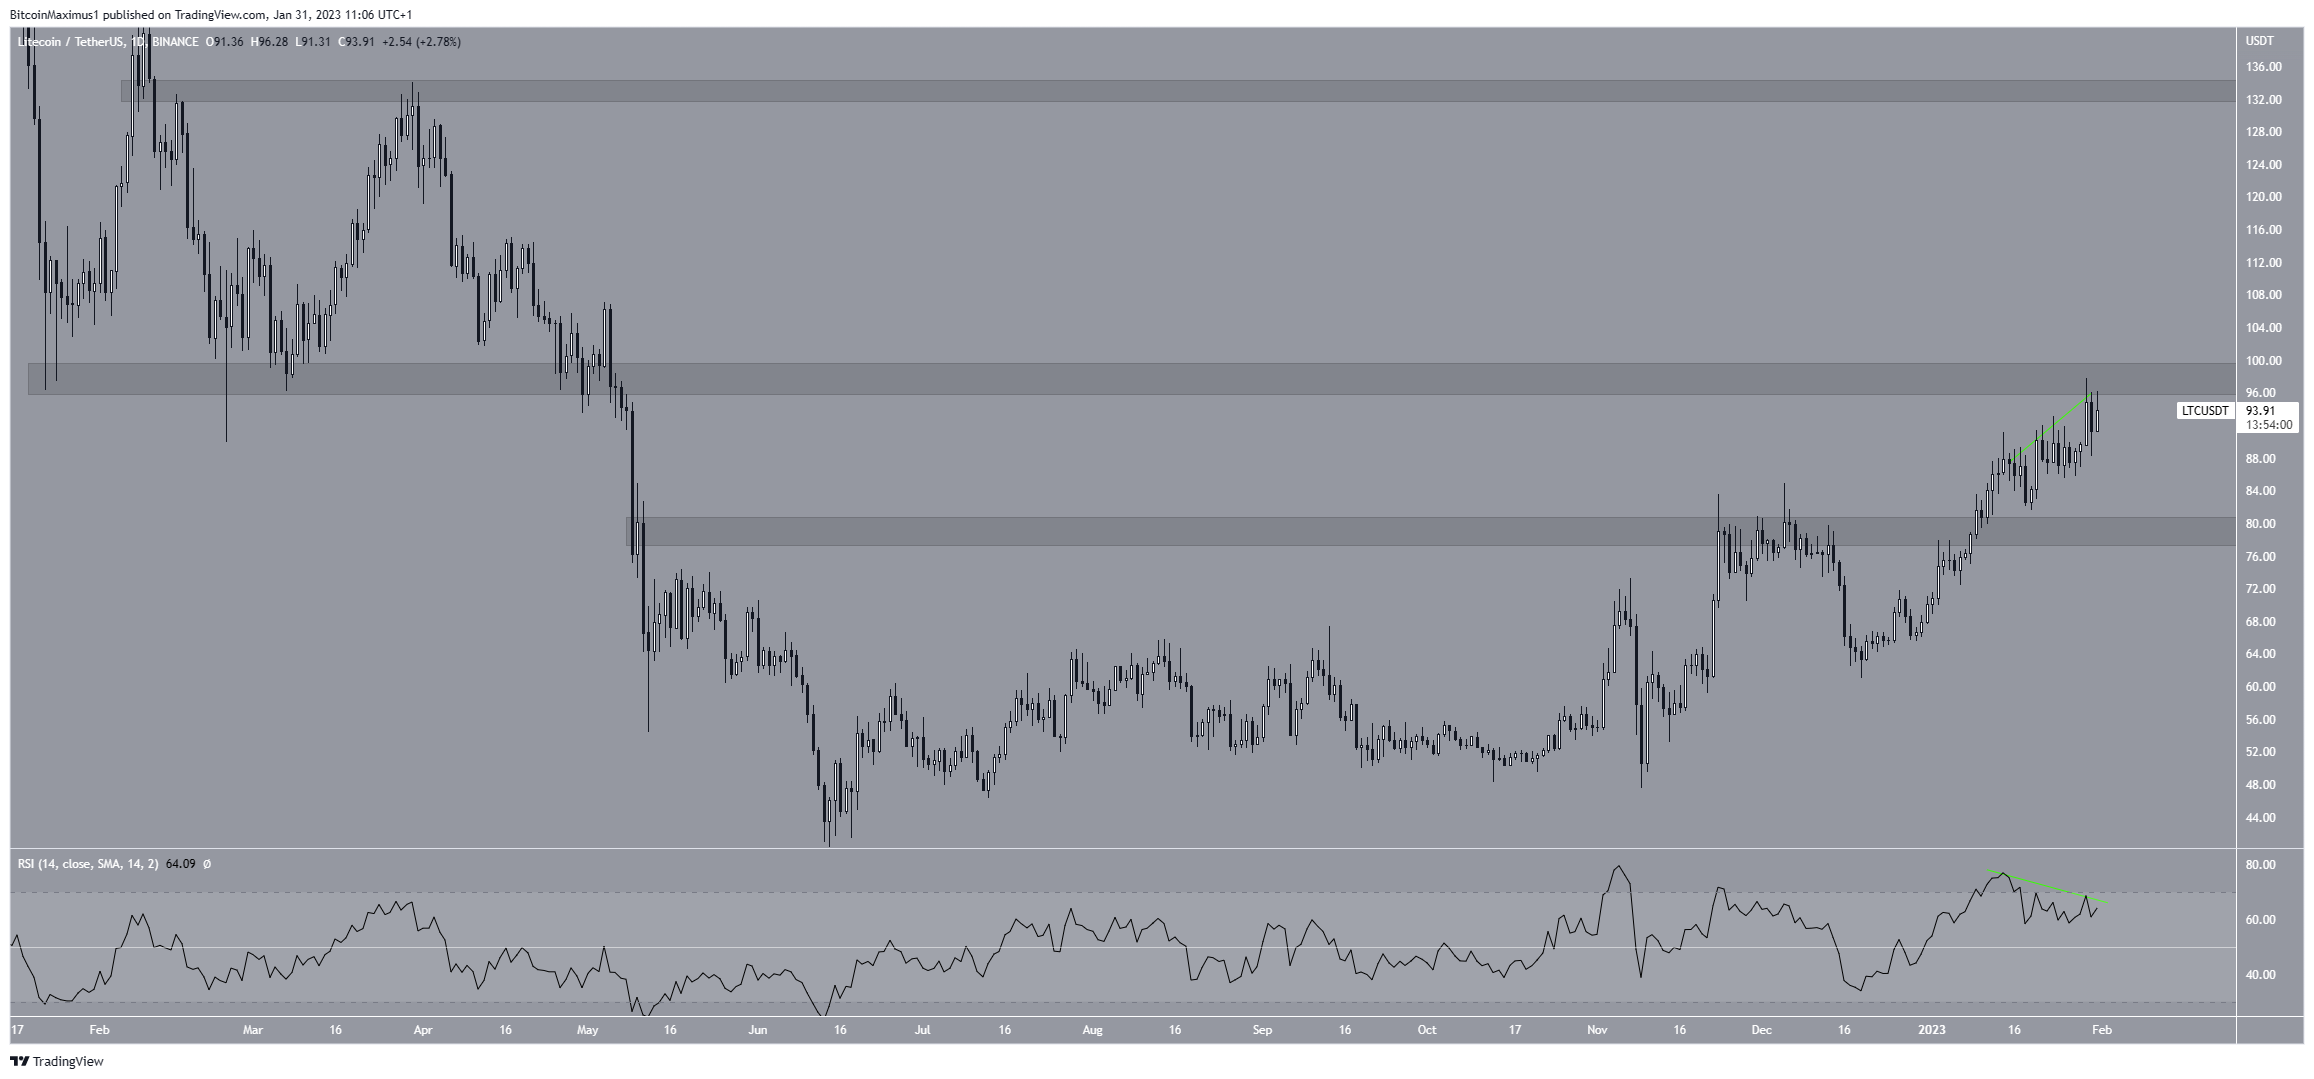
The technical analysis from the daily time frame shows that the Litecoin price has moved upward since June 2022. At the beginning of 2023, the price broke out from the long-term $79 resistance area. The area is now expected to provide support.
On Jan. 29, the price reached a new yearly high of $97.77 (red icon). This validated the $98 area as resistance. The ensuing fall also validated a bearish divergence in the daily RSI. Such divergences often precede downward movements, as was the case for the past 24 hours. As a result, the digital asset may fall to the $79 area, which could now provide support.
On the other hand, a daily close above $98 would invalidate this bearish Litecoin price forecast and could lead to an upward movement toward an average price of $133.
Litecoin Price Prediction for Feb: Drop Could Occur
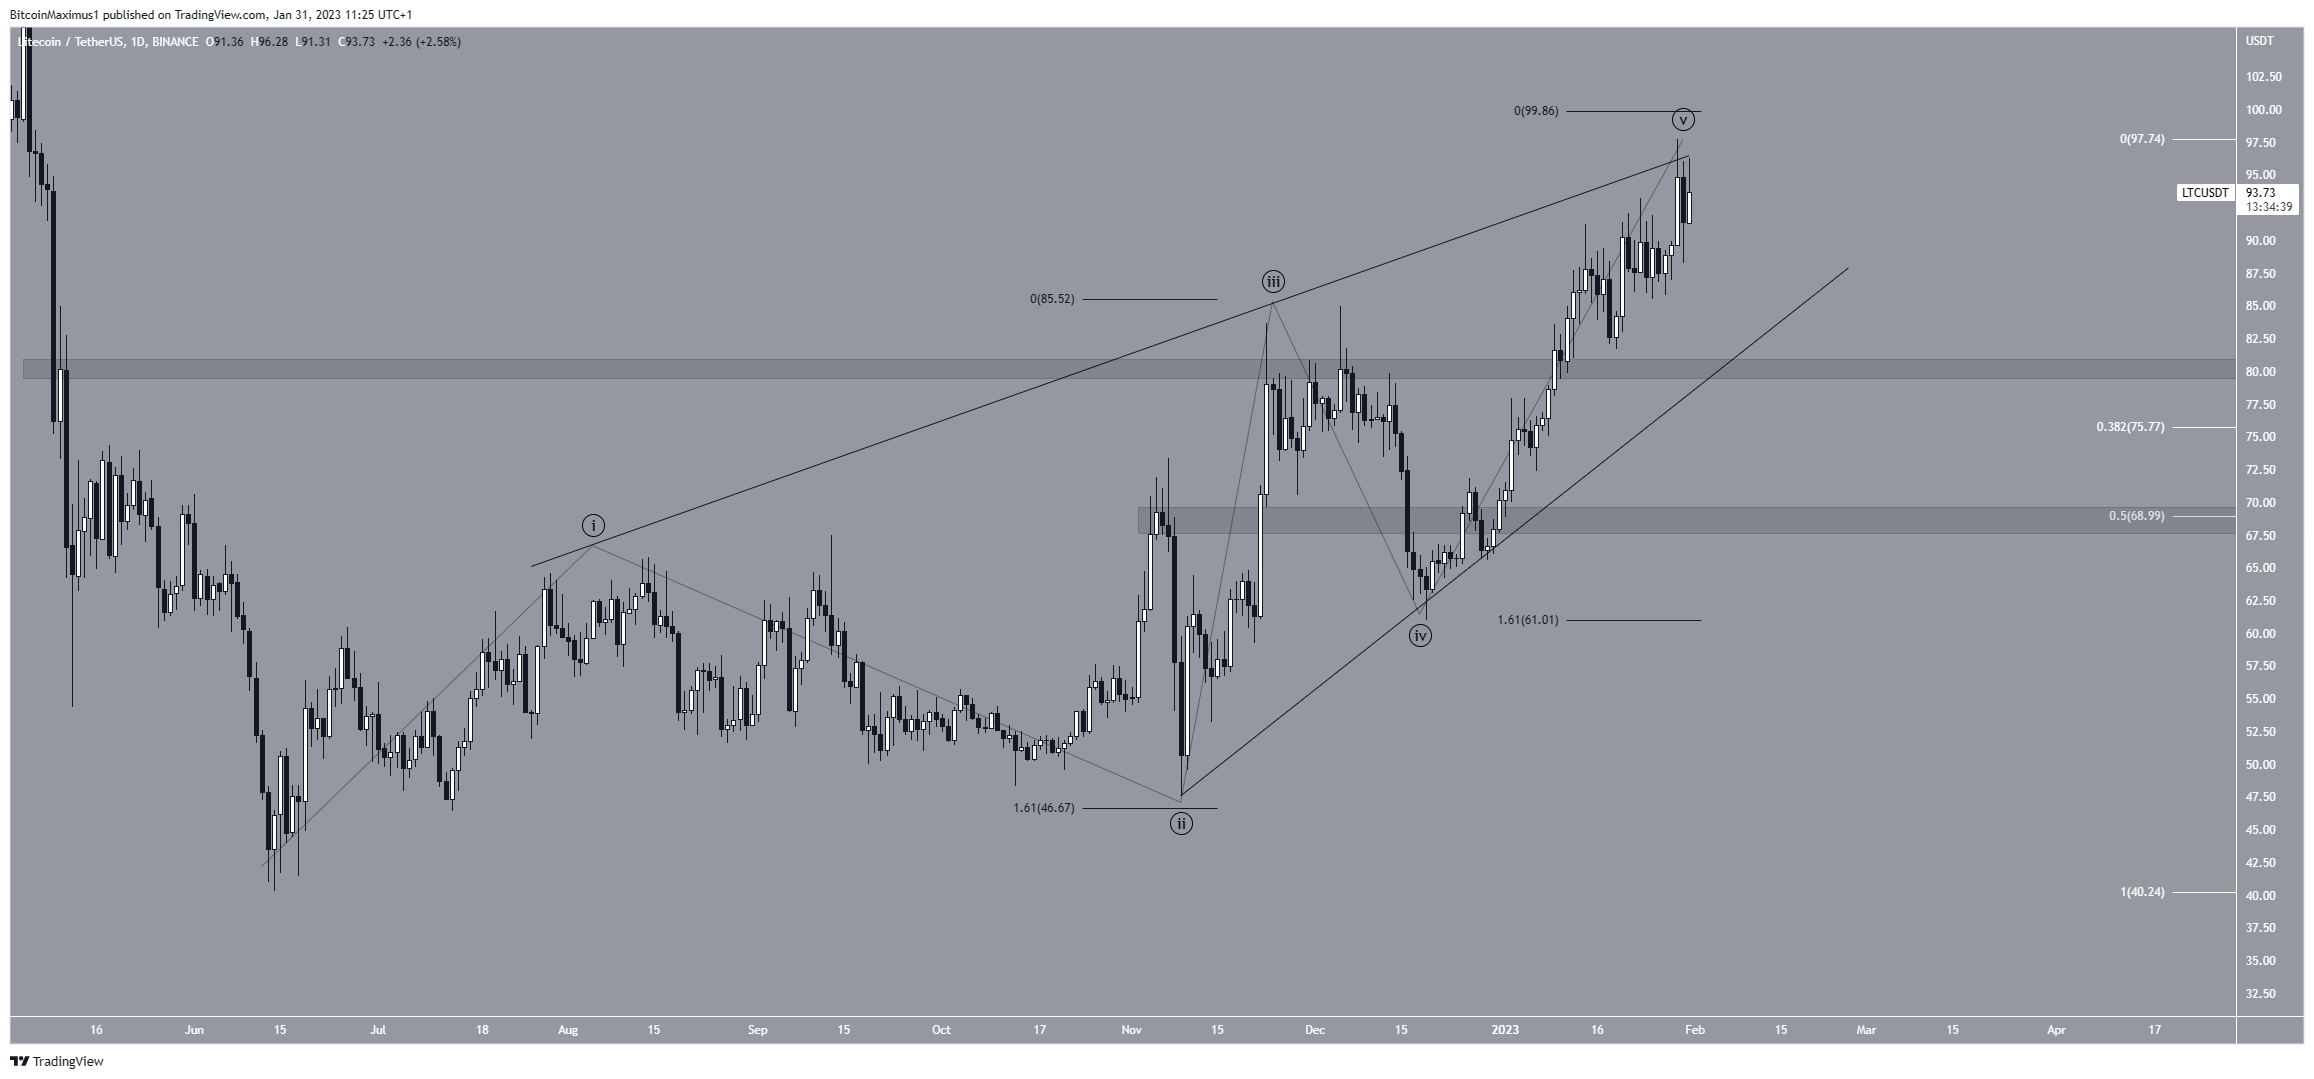
A closer look at the wave count supports the possibility of a drop. The reason for this is that the Litecoin price has completed a five-wave upward movement (black) in what is likely a leading diagonal. If the count is correct, a significant drop would be likely.
The proportion of the waves supports the possibility that this is the correct count since waves three and five are both 1.61 times the length of wave one, common in diagonals.
The closest Fib support level is at $75.77. Since this is below the $79 support area, a breakdown from the latter is likely in case the count is correct. Then, the LTC price could fall to $69, the 0.5 Fib retracement support level, and a horizontal support area.
As a result of this count and the bearish divergence, the Litecoin price prediction for Feb. is bearish. As stated previously, a daily close above $98 would invalidate this outlook and suggest that an upward movement toward $133 is expected.
For BeInCrypto’s latest crypto market analysis, click here.
